Chronic Obstructive Pulmonary Disease Among Adults Aged 18 and Over in the United States, 1998–2009
- Key findings
- Prevalence of COPD was stable from 1998 through 2009 and was significantly higher among women than men.
- Prevalence of COPD was higher in older age groups, and women had higher rates than men throughout most of the lifespan.
- Prevalence of COPD was highest among non-Hispanic white and Puerto Rican adults and among adults with family income below the poverty level.
- COPD prevalence was higher in the East South Central division of the United States than in any other U.S. Census division.
- COPD hospitalization rates declined for both men and women from 1999 through 2007. COPD death rates declined for men but not women from 1999 through 2007.
- Summary
- Definitions
- Data sources and methods
- About the authors
- References
- Suggested citation
NCHS Data Brief No. 63, June 2011
PDF Version (584 KB)
Lara J. Akinbami, M.D.; and Xiang Liu, M.Sc.
Key findings
- The prevalence of chronic obstructive pulmonary disease (COPD) in the United States was stable from 1998 through 2009 and has remained higher in women than in men.
- COPD was more prevalent in older age groups.
- COPD was more prevalent among Puerto Rican and non-Hispanic white adults than among non-Hispanic black and Mexican-American adults, and among adults with family income below the poverty level (8.3%) than among adults with income at least 200% of the poverty level (4.3%).
- Prevalence of COPD was almost twice as high in the East South Central U.S. Census division (7.5%) as in the Pacific division (3.9%).
- From 1999 through 2007, COPD hospitalization rates declined for both men and women, but COPD death rates declined only for men.
Chronic obstructive pulmonary disease (COPD) causes substantial morbidity and mortality (1) and may be unrecognized in its early stages. Chronic lower respiratory disease (CLRD), which includes both COPD and asthma, was the third leading cause of death in the United States in 2008 (2). COPD includes chronic bronchitis and emphysema, which both make emptying air from the lungs progressively more difficult and can be associated with cough, mucus production, wheezing, and breathlessness (1,3). Risk factors include primarily cigarette smoking, but also exposure to noxious particles or gases, recurrent infection, diet, and genetic factors (1). COPD is often preventable, but there is no cure. Treatment can control symptoms and slow disease progression (1). This report presents trends in COPD prevalence, hospitalization, and death rates, and detailed recent estimates for population subgroups. Asthma is excluded from this report because it is considered a different condition with fully reversible symptoms, although some people may have asthma and COPD concurrently (1,3).
Keywords: lung disease, National Health Interview Survey, National Hospital Discharge Survey, National Vital Statistics System
Prevalence of COPD was stable from 1998 through 2009 and was significantly higher among women than men.
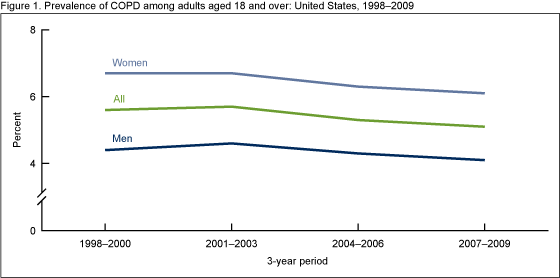
NOTES: COPD is chronic obstructive pulmonary disease. Age-adjusted to the 2000 U.S. standard population. Access data table for Figure 1 [PDF 59 KB]
SOURCES: CDC/NCHS, Health Data Interactive and National Health Interview Survey.
- In 2007–2009, 5.1% (11.8 million) of adults aged 18 and over had COPD—a rate that was stable from 1998 through 2009.
- For each 3-year period from 1998 through 2009, women had higher COPD prevalence than men. For 2007–2009, 6.1% of women (7.4 million) had COPD compared with 4.1% of men (4.4 million) (Figure 1).
Prevalence of COPD was higher in older age groups, and women had higher rates than men throughout most of the lifespan.
- The prevalence of COPD rose with age for both men and women throughout most of the lifespan (i.e., across most age groups) (Figure 2).
- COPD prevalence was highest among women aged 65–74 (10.4%) and 75–84 (9.7%) and among men aged 75–84 (11.2%).
- COPD prevalence was greater among women than men in all age groups except the two highest age groups (75–84 and 85 and over), for which the difference was not statistically significant.
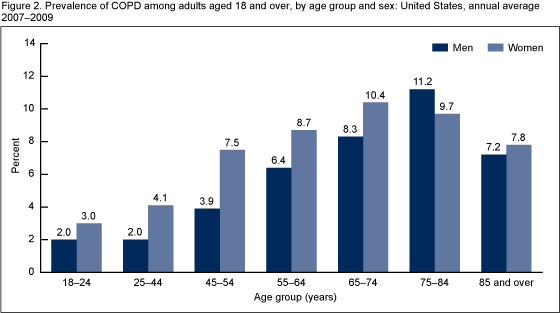
NOTES: COPD is chronic obstructive pulmonary disease. Access data table for Figure 2 [PDF 59 KB]
SOURCES: CDC/NCHS, Health Data Interactive and National Health Interview Survey.
Prevalence of COPD was highest among non-Hispanic white and Puerto Rican adults and among adults with family income below the poverty level.
- Overall, Puerto Rican (6.9%) and non-Hispanic white (5.7%) adults had higher COPD prevalence than non-Hispanic black adults (4.4%). Mexican-American adults had the lowest COPD prevalence (2.6%) (Figure 3).
- Overall, COPD prevalence decreased with increasing income levels: adults with family income below the federal poverty level had the highest COPD prevalence (8.3%), those at 100%–199% of the poverty level had intermediate prevalence (6.8%), and those with income more than 200% of the poverty level had the lowest prevalence (4.3%).
- Within each racial and ethnic group, COPD prevalence among poor adults (those with income less than 100% of the poverty level) was higher than for adults with income levels above the poverty level.
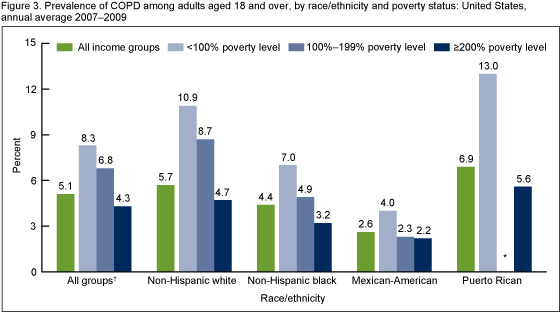
* Estimate does not meet standards of reliability or precision.
† Includes all racial and ethnic groups, including categories not shown separately in the figure.
NOTES: COPD is chronic obstructive pulmonary disease. Age-adjusted to the 2000 U.S. standard population. Access data table for Figure 3 [PDF 59 KB]
SOURCES: CDC/NCHS, Health Data Interactive and National Health Interview Survey.
COPD prevalence was higher in the East South Central division of the United States than in any other U.S. Census division.
- Prevalence of COPD differed by geographic location and was highest in the East South Central Census division among adults aged 18 and over (7.5% in 2007–2009) (Figure 4).
- Other Census divisions (West South Central, East North Central, and South Atlantic) had 2007–2009 COPD prevalence levels of 5.6%–5.8%—significantly higher than those in the New England, Middle Atlantic, and Pacific divisions (3.9%–4.3%).
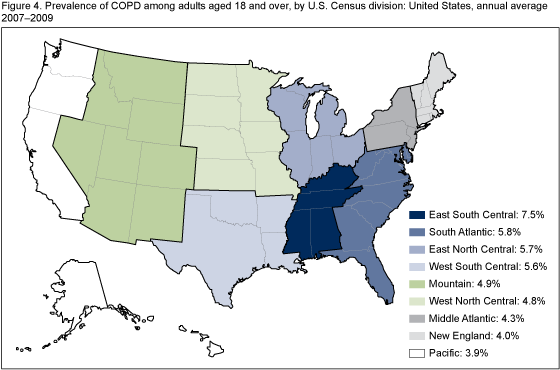
NOTES: COPD is chronic obstructive pulmonary disease. For definitions of Census divisions, visit: Census Regions and Divisions of the United States [PDF – 1 MB]. Age-adjusted to the 2000 U.S. standard population. Access data table for Figure 4 [PDF 59 KB]
SOURCES: CDC/NCHS, Health Data Interactive and National Health Interview Survey.
COPD hospitalization rates declined for both men and women from 1999 through 2007. COPD death rates declined for men but not women from 1999 through 2007.
- COPD death rates were higher for men than women throughout the period 1999–2007, while hospitalization rates were similar for men and women (Figure 5).
- From 1999 through 2007, COPD hospitalization rates declined for both men and women.
- From 1999 through 2007, COPD death rates declined for men but did not change significantly for women, thus narrowing the mortality gap between men and women.
- Still, in 2007, nearly 60,000 men and nearly 65,000 women died from COPD, with death rates of 63.5 per 100,000 population for men and 46.8 per 100,000 for women.
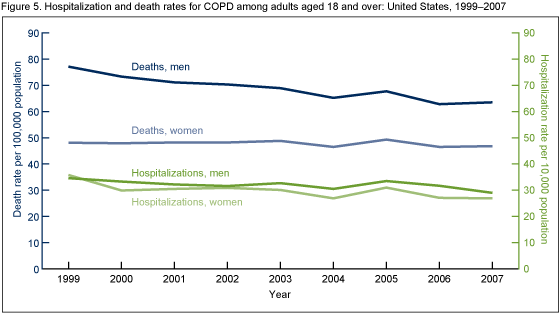
NOTES: COPD is chronic obstructive pulmonary disease. Age-adjusted to the 2000 U.S. standard population. Figure shows first-listed hospitalizations and underlying cause of death identified as COPD. Access data table for Figure 5 [PDF 59KB]
SOURCES: CDC/NCHS, Health Data Interactive, National Hospital Discharge Survey, and National Vital Statistics System.
Summary
The prevalence of COPD did not change significantly from 1998 through 2009. This pattern follows a period (1980–1996) during which COPD prevalence increased for women but not for men, and during which there were greater increases in COPD hospitalizations and deaths among women compared with men (3). Increased COPD morbidity among women is believed to reflect increased smoking rates among women beginning in the 1940s. Although smoking prevalence remains higher in men, the gap between men and women narrowed through the 1980s (3,4). In the more recent period presented in this report, COPD hospitalization rates were similar for men and women and declined for both sexes over the period. Although death rates from COPD remained lower among women overall, death rates did not change for women from 1999 through 2007, while they decreased for men. The narrowing gap in death rates represents a continuing shift in the relative burden of COPD to women.
For the most recent period examined (2007–2009), COPD prevalence was highest in the East South Central Census division. Women had higher prevalence rates than men over nearly the entire lifespan. Prevalence was highest among Puerto Rican and non-Hispanic white adults and among adults with family income levels below poverty.
The American Thoracic Society (ATS) updated its Standards for the Diagnosis and Management of Patients With COPD in 2004 (1). Primary prevention and treatment strategies include smoking cessation and early detection and diagnosis of COPD. Healthy People 2020 objectives (5) incorporate these prevention and treatment strategies by targeting for reduction in activity limitations, emergency department visits, hospitalizations, and deaths from COPD, and by setting an objective of increased diagnosis of COPD among adults with abnormal lung function.
Definitions
Chronic bronchitis: The ATS clinical definition includes a chronic productive cough for 3 months in each of two successive years in a patient in whom other causes of productive chronic cough have been excluded. The National Health Interview Survey (NHIS) definition included respondents who answered “yes” to the question, “During the past 12 months, have you been told by a doctor or other health professional that you had chronic bronchitis?”
Chronic obstructive pulmonary disease (COPD): Defined by ATS as a preventable and treatable disease state characterized by airflow limitation that is not fully reversible. The definitions used in this report differ by data source:
- Prevalence: Adheres to ATS COPD clinical guidelines (1) and CDC COPD surveillance summary (3) definitions and includes chronic bronchitis and emphysema. NHIS respondents who reported either or both of these conditions were considered to have COPD.
- Hospitalization: Includes first-listed International Classification of Diseases, Ninth Revision, Clinical Modification (ICD–9–CM) codes 490–492 and 496 (3), which include Chronic bronchitis; Bronchitis, not specified as acute or chronic; Emphysema; and Chronic airway obstruction, not elsewhere classified. The first-listed diagnosis is specified as the principal diagnosis in the discharge summary of the medical record. It is usually the main cause of the hospitalization.
- Mortality: Includes ICD–10 codes J40–J44 and J47 as the underlying cause of death, including Bronchitis, not specified as acute or chronic; Chronic bronchitis; Unspecified chronic bronchitis; Emphysema; Other chronic obstructive pulmonary disease; and Bronchiectasis.
Emphysema: Defined by ATS (1) as a permanent enlargement of the air spaces in the lungs, which is accompanied by destruction of the air space walls. The NHIS definition used in the present report included all respondents who answered “yes” to the question, “Have you ever been told by a doctor or other health professional that you had emphysema?”
Poverty status or percentage of poverty level: Defined based on family income, family size, and the number of children in the family, and, for families with two or fewer adults, on the age of the adults in the family. The poverty level is based on a set of income thresholds that vary by family size and composition. Families or individuals with income below their appropriate thresholds are classified as below the poverty level. These thresholds are updated annually by the U.S. Census Bureau to reflect changes in the Consumer Price Index for all urban consumers (6). Estimates by poverty status from NHIS are based on both reported and imputed family income (7).
Data sources and methods
All estimates were obtained from the Centers for Disease Control and Prevention’s National Center for Health Statistics (NCHS), Health Data Interactive tables. COPD prevalence was obtained from the table, “Asthma and Chronic Obstructive Pulmonary Disease: U.S., 1998–2009.” First-listed hospitalization rates for COPD were obtained from the table, “Hospital Discharges by First- and Any-listed Diagnosis: U.S., 1990–2007.” CLRD and asthma death rates were obtained from the table “Mortality by Underlying and Multiple Cause, Ages 18+: U.S., 1981–2007.” Asthma deaths were subtracted from CLRD deaths to obtain COPD deaths and death rates (see definition above).
The following NCHS data sets were used to calculate estimates for the Health Data Interactive tables:
National Health Interview Survey (NHIS) data were used to estimate COPD prevalence. NHIS operates continuously throughout the year to collect information on the health and health care of the civilian noninstitutionalized U.S. population. Data for this report were taken from the Sample Adult component, which collects detailed self-reported information about health conditions for a randomly selected adult. For more information, or to view the NHIS questionnaire, visit the NHIS website.
National Hospital Discharge Survey (NHDS) data were used to estimate hospitalizations. NHDS collects information from a national sample of inpatient stays in nonfederal, short-stay hospitals in the United States. Patient information is collected from medical records and automated data files and includes demographics, length of stay, diagnoses, and procedures. For more information, visit the NHDS website.
The National Vital Statistics System (NVSS), Mortality component was used to calculate COPD death rates. Data are based on information from all death certificates filed in the 50 states and the District of Columbia. Mortality statistics are based on information coded by the states and provided to NCHS through the Vital Statistics Cooperative Program, as well as on data from copies of original certificates received by NCHS from state registration offices. For more information, visit the NVSS Mortality website.
Data from both NHIS and NHDS are based on nationally representative samples. For both surveys, sample weights are used to produce national estimates. Data weighting procedures are described elsewhere (8,9). Point estimates and variances for this analysis were calculated using SUDAAN software (10) to account for the complex sample designs of NHIS and NHDS. Civilian population estimates from the U.S. Census Bureau were used to calculate inpatient hospitalization rates. Residential population estimates were used to calculate death rates. Age-adjusted death rates were calculated using the direct method and the 2000 standard population.
Differences between percentages were evaluated using two-sided significance tests at the 0.05 level. Terms such as “higher than” and “less than” indicate statistically significant differences. Terms such as “similar” and “no difference” indicate that the statistics being compared were not significantly different. Lack of comment regarding the difference between any two statistics does not necessarily suggest that the difference was tested and found to be not significant.
All estimates shown in this report have a relative standard error less than or equal to 30%. The significance of trends was tested using weighted least squares regression models of the log of each outcome and using Joinpoint software (11) to determine whether an apparent change over time was statistically significant. The standard error for each data point was taken into account.
About the authors
Lara Akinbami and Xiang Liu are with the Centers for Disease Control and Prevention’s National Center for Health Statistics, Office of Analysis and Epidemiology.
References
- American Thoracic Society/European Respiratory Society Task Force. Standards for the diagnosis and management of patients with COPD [online]. Version 1.2. New York: American Thoracic Society. 2004.
- Miniño AM, Xu JQ, Kochanek KD. Deaths: Preliminary data for 2008. National Vital Statistics Reports; vol 59 no 2. Hyattsville, MD: National Center for Health Statistics. 2010.
- Mannino DM, Homa DM, Akinbami LJ, Ford ES, Redd SC. Chronic obstructive pulmonary disease surveillance—United States, 1971–2000. In: Surveillance Summaries, August 2, 2002. MMWR 51(SS–6):1–16. 2002.
- Smoking and tobacco use—Highlights: Patterns of tobacco use among women and girls [online]. Centers for Disease Control and Prevention, Office on Smoking and Health. 2000.
- Healthy People 2020 summary of objectives: Respiratory diseases [online]. U.S. Department of Health and Human Services, Office of Disease Prevention and Health Promotion.
- Poverty [online]. U.S. Census Bureau. 2011.
- Schenker N, Raghunathan TE, Chiu P-L, et al. Multiple imputation of family income and personal earnings in the National Health Interview Survey: Methods and examples [online]. National Center for Health Statistics and University of Michigan. 2008.
- Botman SL, Moore TF, Moriarity CL, Parsons VL. Design and estimation for the National Health Interview Survey, 1995–2004. National Center for Health Statistics. Vital Health Stat 2(130). 2000.
- Dennison C, Pokras R. Design and operation of the National Hospital Discharge Survey: 1988 redesign. Vital Health Stat 1(39). 2000.
- SUDAAN, release 9.1 [computer software]. Research Triangle Park, NC: Research Triangle Institute. 2004.
- Joinpoint Regression Program, version 3.4 [computer software]. Bethesda, MD: National Cancer Institute, National Institutes of Health. 2010.
Suggested citation
Akinbami LJ, Liu X. Chronic obstructive pulmonary disease among adults aged 18 and over in the United States, 1998–2009. NCHS data brief, no 63. Hyattsville, MD: National Center for Health Statistics. 2011.
Copyright information
All material appearing in this report is in the public domain and may be reproduced or copied without permission; citation as to source, however, is appreciated.
National Center for Health Statistics
Edward J. Sondik, Ph.D., Director
Jennifer H. Madans, Ph.D., Associate Director for Science
Office of Analysis and Epidemiology
Linda T. Bilheimer, Ph.D., Director