Anemia Prevalence: United States, August 2021–August 2023
NCHS Data Brief No. 519, December 2024
PDF Version (454 KB)
Anne M. Williams, Ph.D., M.P.H., Nicholas Ansai, M.P.H., Namanjeet Ahluwalia, Ph.D., D.Sc., and Duong T. Nguyen, D.O.
Data from the National Health and Nutrition Examination Survey
- During August 2021–August 2023, the overall prevalence of anemia in people age 2 years and older was 9.3%. Prevalence was higher in females (13.0%) than in males (5.5%).
- Anemia prevalence was lowest in children ages 2–11 (4.7%) and highest in adults 60 and older (12.5%).
- Anemia prevalence was highest in Black non-Hispanic females (31.4%) and Black non-Hispanic males (10.8%) age 2 and older compared with all other race and Hispanic-origin groups.
- Anemia prevalence decreased with increasing family income overall and in both males and females age 2 and older.
Anemia is a condition in which not enough red blood cells are available to deliver oxygen to the body, which can cause fatigue and shortness of breath (1). Severe anemia is a risk factor for adverse health outcomes ranging from poor child development to maternal mortality (2,3). Anemia can result from many causes, including iron deficiency, chronic or infectious diseases, or inherited blood disorders such as thalassemia (1,4). This report provides estimates of anemia in those age 2 years and older by selected characteristics during the August 2021–August 2023 National Health and Nutrition Examination Survey (NHANES).
Keywords: hemoglobin, red blood cells, National Health and Nutrition Examination Survey (NHANES)
What was the prevalence of anemia during August 2021–August 2023, and were differences observed by age and sex?
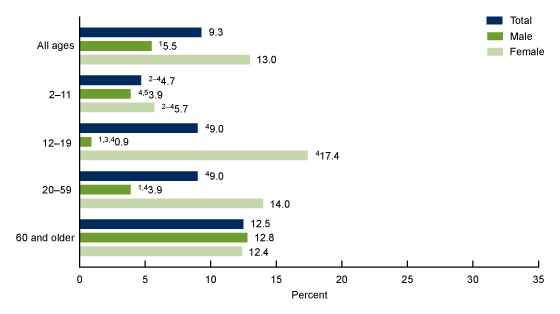
In August 2021–August 2023, the prevalence of anemia was 9.3% in those age 2 years and older (Figure 1, Table 1). The prevalence was higher in females (13.0%) than in males (5.5%) overall, and for some age groups. The prevalence of anemia in females ages 12–19 years (17.4%) and 20–59 (14.0%) was higher than in males in the same age groups (0.9% and 3.9%, respectively). The prevalence of anemia in children ages 2–11 and adults 60 and older did not differ by sex.
The prevalence of anemia was lower in children ages 2–11 (4.7%) than in any other age group. The prevalence of anemia was also lower in adolescents ages 12–19 and in adults 20–59 (9.0% each) than in adults 60 and older (12.5%). In males, the prevalence of anemia was lower in ages 2–11 (3.9%, although this estimate did not meet statistical reliability criteria), adolescents 12–19 (0.9%), and adults 20–59 (3.9%) than in men 60 and older (12.8%). In females, the pattern was different: The prevalence of anemia was lower in ages 2–11 (5.7%) compared with all other age groups, and higher in adolescents ages 12–19 (17.4%) than in women 60 and older (12.4%).
Figure 1. Prevalence of anemia in people age 2 years and older, by age group and sex: United States, August 2021–August 2023

1Significantly different from female.
2Significantly different from ages 12–19 years.
3Significantly different from ages 20–59.
4Significantly different from age 60 and older.
5Estimate does not meet National Center for Health Statistics presentation standards; see “National Center for Health Statistics Data Presentation Standards for Proportions,” available from: https://www.cdc.gov/nchs/data/series/sr_02/sr02_175.pdf.
NOTES: Anemia is defined as hemoglobin (Hb) less than 11.0 g/dL for children ages 2–4; Hb less than 11.5 g/dL for children ages 5–11; Hb less than 12.0 g/dL for children ages 12–14 and nonpregnant females age 15 and older; and Hb less than 13.0 g/dL for males age 15 and older, with Hb values adjusted for smoking following 2024 World Health Organization guidance.
SOURCE: National Center for Health Statistics, National Health and Nutrition Examination Survey, August 2021–August 2023.
Did the prevalence of anemia differ by race and Hispanic origin and sex?
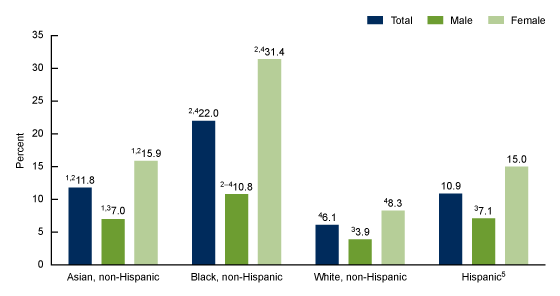
The prevalence of anemia was higher in Black non-Hispanic (subsequently, Black) people (22.0%) compared with Asian non-Hispanic (subsequently, Asian) (11.8%), Hispanic (10.9%), and White non-Hispanic (subsequently, White) (6.1%) people (Figure 2, Table 2). Prevalence was also higher in Asian and Hispanic people compared with White people. The prevalence of anemia was higher in females than males among all race and Hispanic-origin groups.
Among males, the prevalence of anemia was highest in Black males (10.8%) compared with Hispanic (7.1%), Asian (7.0%), and White (3.9%) males.
Among females, the prevalence of anemia in Black females (31.4%) was highest compared with Asian (15.9%), Hispanic (15.0%), and White (8.3%) females. The prevalence of anemia also was higher in Asian and Hispanic females compared with White females.
Figure 2. Prevalence of anemia in people age 2 years and older, by race and Hispanic origin and sex: United States, August 2021–August 2023

1Significantly different from Black non-Hispanic.
2Significantly different from White non-Hispanic.
3Significantly different from female.
4Significantly different from Hispanic.
5People of Hispanic origin may be of any race.
NOTES: Anemia is defined as hemoglobin (Hb) less than 11.0 g/dL for children ages 2–4; Hb less than 11.5 g/dL for children ages 5–11; Hb less than 12.0 g/dL for children ages 12–14 and nonpregnant females age 15 and older; and Hb less than 13.0 g/dL for males age 15 and older, with Hb values adjusted for smoking following 2024 World Health Organization guidance.
SOURCE: National Center for Health Statistics, National Health and Nutrition Examination Survey, August 2021–August 2023.
Did anemia prevalence vary by family income and sex?
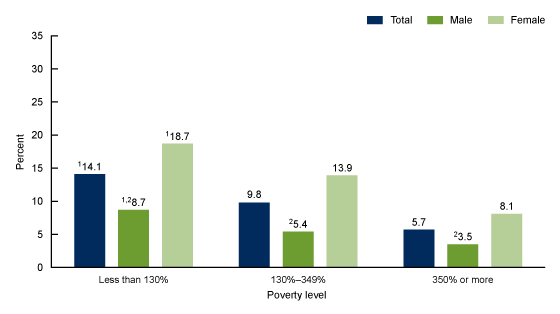
The prevalence of anemia decreased with increasing income, from 14.1% in people whose family income was less than 130% of the poverty level to 9.8% in people with family income 130%–349% of the poverty level and 5.7% in those with family income 350% or more of the poverty level (Figure 3, Table 3).
The trend of lower anemia with increasing income was observed for both males and females. Males and females age 2 years and older at the highest poverty level had more than double the anemia prevalence (males, 8.7%; females, 18.7%) compared with those at the lowest poverty level (males, 3.5%; females, 8.1%). Anemia prevalence was higher in females than males for all income groups.
Figure 3. Prevalence of anemia in people age 2 years and older, by family income and sex: United States, August 2021–August 2023

1Significant linear trend by family income.
2Significantly different from female.
NOTES: Anemia is defined as hemoglobin (Hb) less than 11.0 g/dL for children ages 2–4; Hb less than 11.5 g/dL for children ages 5–11; Hb less than 12.0 g/dL for children ages 12–14 and nonpregnant females age 15 and older; and Hb less than 13.0 g/dL for males age 15 and older, with Hb values adjusted for smoking following 2024 World Health Organization guidance. Poverty level is annual total family income divided by the dollar amount defined by the U.S. Department of Health and Human Services poverty guidelines to account for inflation and family size.
SOURCE: National Center for Health Statistics, National Health and Nutrition Examination Survey, August 2021–August 2023.
Summary
During August 2021–August 2023, the prevalence of anemia was 9.3% in the U.S. population age 2 years and older. Males had a lower prevalence of anemia than females in all race and Hispanic-origin groups; this was also true in all income groups, but not in all age groups.
Clear trends were seen in anemia prevalence by income group. Males and females age 2 and older in the lowest income group had more than double the prevalence of anemia compared with males and females in the highest income group. Differences by race and Hispanic origin also were found, with Black people having the highest prevalence of anemia compared with all other race and Hispanic-origin groups.
Reducing anemia prevalence is a global goal (5). In 2012, the World Health Assembly (the health policy body of the World Health Organization) set a target to reduce anemia prevalence in women of reproductive age by 50% by 2025 (5). Like most countries, the United States is not on track to meet that goal (6). In females ages 15–49, anemia prevalence increased from 7.8% in 2000 to 11.5% in 2018 (7), and during August 2021–August 2023, the prevalence of anemia was 17.4% for adolescent girls 12–19 and 14.0% for women 20–59.
Definitions
Anemia: Hemoglobin (Hb) less than 11.0 g/dL for children ages 2–4; Hb less than 11.5 g/dL for children 5–11; Hb less than 12.0 g/dL for children 12–14 and females 15 and older; and Hb less than 13.0 g/dL for males 15 and older (8). Hb concentration was not adjusted for the effects of altitude, but it was adjusted for smoking following World Health Organization guidance (8).
Poverty level: Annual total family income divided by the dollar amount defined by the U.S. Department of Health and Human Services poverty guidelines to account for inflation and family size (9).
Data source and methods
Data from NHANES for August 2021–August 2023 were used to estimate anemia prevalence, with measured Hb and published cutoffs based on age and sex (8).
NHANES is a cross-sectional survey designed to monitor the health and nutritional status of the U.S. civilian noninstitutionalized population. The NHANES sample is selected through a complex, multistage probability design. NHANES is conducted by the National Center for Health Statistics (10) and consists of home interviews followed by standardized health examinations conducted in mobile examination centers, where venous blood is collected for a variety of measurements including Hb. Hb is measured for NHANES participants age 1 year and older as part of a complete blood count laboratory test using a Beckman Coulter DxH 800 instrument.
This report is based on analyses that included all examined NHANES participants age 2 years and older. Pregnant women and anyone with missing Hb concentration were excluded. Phlebotomy sample weights were used to calculate nationally representative estimates. These weights—provided for the first time with the August 2021–August 2023 public file release for use with phlebotomy-related variables—account for the differential probabilities of selection and nonresponse, including nonresponse to venous blood collection. All analyses accounted for the survey’s complex, multistage probability design. For August 2021–August 2023, differences between estimates overall and among subgroups were evaluated using t tests at the 0.05 level. Linear regression was used to test the significance of a linear trend by income.
Data management and statistical analyses were conducted using SAS System for Windows version 9.4 (SAS Institute, Inc., Cary, N.C.) and SUDAAN version 11.0.4 (RTI International, Research Triangle Park, N.C.).
About the authors
Anne M. Williams, Nicholas Ansai, Namanjeet Ahluwalia, and Duong T. Nguyen are with the National Center for Health Statistics, Division of Health and Nutrition Examination Surveys.
References
- Brittenham GM, Moir-Meyer G, Abuga KM, Datta-Mitra A, Cerami C, Green R, et al. Biology of anemia: A public health perspective. J Nutr 153 Suppl 1:S7–S28. 2023.
- Allen LH. Anemia and iron deficiency: Effects on pregnancy outcome. Am J Clin Nutr 71(5 Suppl):1280S–4S. 2000.
- Daru J, Zamora J, Fernández-Félix BM, Vogel J, Oladapo OT, Morisaki N, et al. Risk of maternal mortality in women with severe anaemia during pregnancy and post partum: A multilevel analysis. Lancet Glob Health 6(5):e548–e54. 2018.
- Kassebaum NJ, GBD 2013 Anemia Collaborators. The global burden of anemia. Hematol Oncol Clin North Am 30(2):247–308. 2016.
- World Health Organization. Global nutrition targets 2025: Policy brief series. 2014.
- Stevens GA, Paciorek CJ, Flores-Urrutia MC, Borghi E, Namaste S, Wirth JP, et al. National, regional, and global estimates of anaemia by severity in women and children for 2000–19: A pooled analysis of population-representative data. Lancet Glob Health 10(5):e627–e39. 2022.
- World Health Organization. The Global Health Observatory: SDG target 2.2 malnutrition.
- World Health Organization. Guideline on haemoglobin cutoffs to define anaemia in individuals and populations. 2024.
- U.S. Department of Health and Human Services, Assistant Secretary of Planning and Evaluation. 2021 poverty guidelines.
- Terry AL, Chiappa MM, McAllister J, Woodwell DA, Graber JE. Plan and operations of the National Health and Nutrition Examination Survey, August 2021–August 2023. National Center for Health Statistics. Vital Health Stat 1(66). 2024. DOI: https://dx.doi.org/10.15620/cdc/151927.
Suggested citation
Williams AM, Ansai N, Ahluwalia N, Nguyen DT. Anemia prevalence: United States, August 2021–August 2023. NCHS Data Brief, no 519. Hyattsville, MD: National Center for Health Statistics. 2024. DOI: https://dx.doi.org/10.15620/cdc/168890.
Copyright information
All material appearing in this report is in the public domain and may be reproduced or copied without permission; citation as to source, however, is appreciated.
National Center for Health Statistics
Brian C. Moyer, Ph.D., Director
Amy M. Branum, Ph.D., Associate Director for Science
Division of Health and Nutrition Examination Surveys
Alan E. Simon, M.D., Director
Lara J. Akinbami, M.D., Associate Director for Science