Chronic Pain and High-impact Chronic Pain in U.S. Adults, 2023
NCHS Data Brief No. 518, November 2024
PDF Version (472 KB)
Jacqueline W. Lucas, M.P.H., and Inderbir Sohi, M.S.P.H.
- Key findings
- The percentage of adults who had chronic pain and high-impact chronic pain in the past 3 months was higher in women than men.
- The percentage of adults who had chronic pain and high-impact chronic pain increased with age.
- The percentage of adults who had chronic pain and high-impact chronic pain varied by race and Hispanic origin.
- The percentage of adults who had chronic pain and high-impact chronic pain increased with decreasing urbanization.
Data from the National Health Interview Survey
- In 2023, 24.3% of adults had chronic pain, and 8.5% of adults had chronic pain that frequently limited life or work activities (referred to as high-impact chronic pain) in the past 3 months.
- Chronic pain and high-impact chronic pain both increased with age.
- American Indian and Alaska Native non-Hispanic adults were significantly more likely to have chronic pain (30.7%) compared with Asian non-Hispanic (11.8%) and Hispanic (17.1%) adults.
- The percentage of adults with chronic pain and high-impact chronic pain increased with decreasing urbanization level.
Chronic pain (1) and pain that often restricts life or work activities, referred to in this report as high-impact chronic pain (2), are the most common reasons adults seek medical care (3), and are associated with decreased quality of life (2,4), opioid misuse (5), increased anxiety and depression (6), and unmet mental health needs (7). In 2019, 20.4% of adults had chronic pain, and 7.4% of adults had high-impact chronic pain (8). This report uses data from the 2023 National Health Interview Survey (NHIS) to provide updated percentages of adults who experienced chronic pain and high-impact chronic pain in the past 3 months by selected demographic characteristics and urbanization level.
Keywords: pain, health disparities, urbanicity, National Health Interview Survey
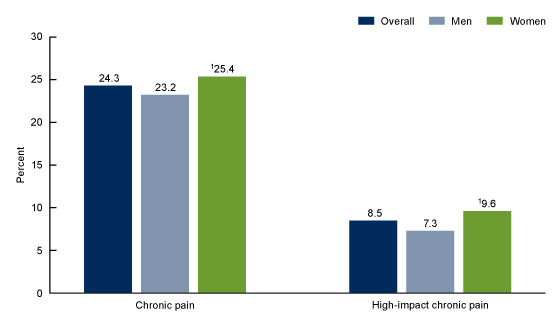
The percentage of adults who had chronic pain and high-impact chronic pain in the past 3 months was higher in women than men.
- In 2023, 24.3% of adults had chronic pain, and 8.5% of adults had high-impact chronic pain (Figure 1, Table 1).
- Women were more likely to have chronic pain (25.4%) and high-impact chronic pain (9.6%) than men (23.2% and 7.3%, respectively).
Figure 1. Percentage of adults age 18 and older with chronic pain and high-impact chronic pain in the past 3 months, overall and by sex: United States, 2023

1Significantly different from men (p < 0.05).
NOTES: Chronic pain is based on responses of “most days” or “every day” to the survey question, “In the past 3 months, how often did you have pain? Would you say never, some days, most days, or every day?” High-impact chronic pain is defined as adults who have chronic pain and who responded “most days” or “every day” to the survey question, “Over the past 3 months, how often did your pain limit your life or work activities? Would you say never, some days, most days, or every day?” Estimates are based on household interviews of a sample of the U.S. civilian noninstitutionalized population.
SOURCE: National Center for Health Statistics, National Health Interview Survey, 2023.
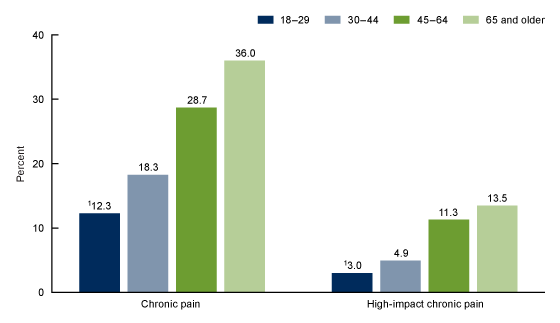
The percentage of adults who had chronic pain and high-impact chronic pain increased with age.
- The percentage of adults who had chronic pain in the past 3 months increased with age, from 12.3% among those ages 18–29 to 36.0% among those age 65 and older (Figure 2, Table 2).
- Similarly, the percentage of adults who had high-impact chronic pain in the past 3 months increased with age, from 3.0% among those ages 18–29 to 13.5% among those age 65 and older.
Figure 2. Percentage of adults age 18 and older with chronic pain and high-impact chronic pain in the past 3 months, by age group: United States, 2023

1Significant linear trend by age group (p < 0.05).
NOTES: Chronic pain is based on responses of “most days” or “every day” to the survey question, “In the past 3 months, how often did you have pain? Would you say never, some days, most days, or every day?” High-impact chronic pain is defined as adults who have chronic pain and who responded “most days” or “every day” to the survey question, “Over the past 3 months, how often did your pain limit your life or work activities? Would you say never, some days, most days, or every day?” Estimates are based on household interviews of a sample of the U.S. civilian noninstitutionalized population.
SOURCE: National Center for Health Statistics, National Health Interview Survey, 2023.
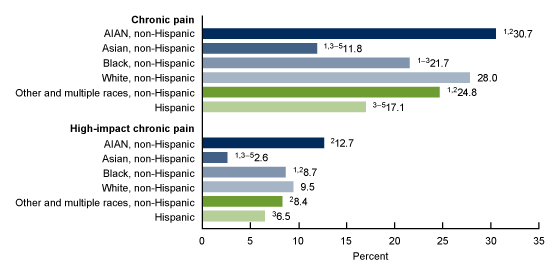
The percentage of adults who had chronic pain and high-impact chronic pain varied by race and Hispanic origin.
- American Indian and Alaska Native non-Hispanic (subsequently, American Indian and Alaska Native) adults were more likely to have chronic pain in the past 3 months (30.7%) compared with Asian non-Hispanic (subsequently, Asian) (11.8%) and Hispanic (17.1%) adults (Figure 3, Table 3). The observed differences between American Indian and Alaska Native adults and the other race and Hispanic-origin groups were not significant.
- American Indian and Alaska Native adults were more likely to have high-impact chronic pain in the past 3 months (12.7%) compared with Asian adults (2.6%). Observed differences with all other race and Hispanic-origin groups were not significant.
- Asian adults were least likely to have both chronic pain (11.8%) and high-impact chronic pain (2.6%) compared with adults of other races and Hispanic-origin groups.
Figure 3. Percentage of adults age 18 and older with chronic pain and high-impact chronic pain in the past 3 months, by race and Hispanic origin: United States, 2023

1Significantly different from Hispanic adults (p < 0.05).
2Significantly different from Asian non-Hispanic adults (p < 0.05).
3Significantly different from White non-Hispanic adults (p < 0.05).
4Significantly different from AIAN non-Hispanic adults (p < 0.05).
5Significantly different other single and multiple races (p < 0.05).
NOTES: AIAN is American Indian and Alaska Native. Categories shown for non-Hispanic adults are for those who selected only one racial group. Adults categorized as Hispanic may be of any race or combination of races. Other and multiple races non-Hispanic includes those who did not identify as American Indian and Alaska Native, Asian, Black, White, or Hispanic, and those who identified as more than one race. Chronic pain is based on responses of “most days” or “every day” to the survey question, “In the past 3 months, how often did you have pain? Would you say never, some days, most days, or every day?” High-impact chronic pain is defined as adults who have chronic pain and who responded “most days” or “every day” to the survey question, “Over the past 3 months, how often did your pain limit your life or work activities? Would you say never, some days, most days, or every day?” Estimates are based on household interviews of a sample of the U.S. civilian noninstitutionalized population.
SOURCE: National Center for Health Statistics, National Health Interview Survey, 2023.
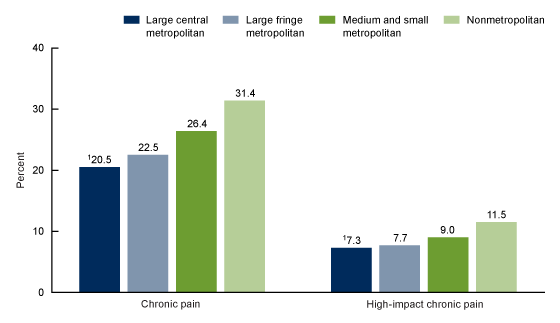
The percentage of adults who had chronic pain and high-impact chronic pain increased with decreasing urbanization.
- The percentage of adults with chronic pain in the past 3 months increased with decreasing urbanization level, from 20.5% in large central metropolitan areas to 31.4% in nonmetropolitan areas (Figure 4, Table 4).
- The percentage of adults with high-impact chronic pain in the past 3 months also increased with decreasing urbanization level, from 7.3% in large central metropolitan areas to 11.5% in nonmetropolitan areas.
Figure 4. Percentage of adults age 18 and older with chronic pain and high-impact chronic pain in the past 3 months, by urbanization level: United States, 2023

1Significant quadratic trend by urbanization level (p < 0.05).
NOTES: Chronic pain is based on responses of “most days” or “every day” to the survey question, “In the past 3 months, how often did you have pain? Would you say never, some days, most days, or every day?” High-impact chronic pain is defined as adults who have chronic pain and who responded “most days” or “every day” to the survey question, “Over the past 3 months, how often did your pain limit your life or work activities? Would you say never, some days, most days, or every day?” Estimates are based on household interviews of a sample of the U.S. civilian noninstitutionalized population.
SOURCE: National Center for Health Statistics, National Health Interview Survey, 2023.
Summary
In 2023, 24.3% of adults experienced chronic pain, and 8.5% of adults experienced high-impact chronic pain (or 34.9% of adults who had chronic pain). Women were more likely than men to experience chronic pain. Chronic pain was also generally higher in American Indian and Alaska Native adults and those age 65 and older. Similarly, high-impact chronic pain was higher in women, American Indian and Alaska Native adults, and those age 65 and older. Percentages of adults who had chronic pain and high-impact chronic pain in the past 3 months increased with decreasing urbanization level. NHIS continues to be an important source of chronic pain and high-impact chronic pain data (9).
Definitions
Chronic pain: Based on responses of “most days” or “every day” to the survey question, “In the past 3 months, how often did you have pain? Would you say never, some days, most days, or every day?”
High-impact chronic pain: Defined as adults who have chronic pain and who responded “most days” or “every day” to the survey question, “Over the past 3 months, how often did your pain limit your life or work activities? Would you say never, some days, most days, or every day?”
Race and Hispanic origin: Categories shown for non-Hispanic adults are for those who selected only one racial group. Adults categorized as Hispanic may be of any race or combination of races. The category other and multiple races non-Hispanic includes those who did not identify as American Indian and Alaska Native, Asian, Black, White, or Hispanic, and those who identified as more than one race.
Urbanization level: Metropolitan status and size were determined using the 2013 National Center for Health Statistics Urban–Rural Classification Scheme for counties (10). Large metropolitan areas are metropolitan statistical areas of 1 million people or more and are categorized into central and fringe counties. Medium and small metropolitan areas are counties in metropolitan statistical areas of 250,000–999,999 people and less than 250,000 people, respectively. Nonmetropolitan areas are counties in micropolitan statistical areas and noncore counties.
Data source and methods
This analysis used data from the Sample Adult module of the 2023 NHIS, a nationally representative household survey of the U.S. civilian noninstitutionalized population. NHIS is conducted continuously throughout the year by the National Center for Health Statistics. Interviews are typically initiated face-to-face in respondents’ homes with follow-ups conducted by telephone as needed. The Sample Adult response rate was 47% (11). For more information about the survey, visit: https://www.cdc.gov/nchs/nhis.htm. Point estimates and corresponding confidence intervals for this analysis were calculated using SAS-callable SUDAAN software (12) to account for the complex sample design of NHIS. All estimates meet National Center for Health Statistics data presentation standards for proportions (13). Differences between percentages were evaluated using two-sided significance tests at the 0.05 level. Linear and quadratic trends by age group and urbanization level were evaluated using orthogonal polynomials.
About the authors
Jacqueline W. Lucas and Inderbir Sohi are with the National Center for Health Statistics, Division of Health Interview Statistics.
References
- Institute of Medicine. Relieving pain in America: A blueprint for transforming prevention, care, education, and research. 2011.
- Pitcher MH, Von Korff M, Bushnell MC, Porter L. Prevalence and profile of high-impact chronic pain in the United States. J Pain 20(2):146–60. 2019.
- National Institutes of Health, National Center for Complementary and Integrative Health. Pain.
- Cohen SP, Vase L, Hooten WM. Chronic pain: An update on burden, best practices, and new advances. Lancet 397(10289):2082–97. 2021.
- Thomas KH, Dalili MN, Cheng HY, Dawson S, Donnelly N, Higgins JPT, Hickman M. Prevalence of problematic pharmaceutical opioid use in patients with chronic non-cancer pain: A systematic review and meta-analysis. Addiction 119(11):1904–22. 2024.
- De La Rosa JS, Brady BR, Ibrahim MM, Herder KE, Wallace JS, Padilla AR, Vanderah TW. Co-occurrence of chronic pain and anxiety/depression symptoms in U.S. adults: Prevalence, functional impacts, and opportunities. Pain 165(3):666–73. 2024.
- De La Rosa JS, Brady BR, Herder KE, Wallace JS, Ibrahim MM, Allen AM, et al. The unmet mental health needs of U.S. adults living with chronic pain. Pain. 2024.
- Zelaya CE, Dahlhamer JM, Lucas JW, Connor EM. Chronic pain and high-impact chronic pain among U.S. adults, 2019. NCHS Data Brief, no 390. Hyattsville, MD: National Center for Health Statistics. 2020.
- Duca LM, Helmick CG, Barbour KE, Nahin RL, Von Korff M, Murphy LB, et al. A review of potential national chronic pain surveillance systems in the United States. J Pain 23(9):1492–1509. 2022.
- Ingram DD, Franco SJ. 2013 NCHS urban–rural classification scheme for counties. National Center for Health Statistics. Vital Health Stat 2(166). 2014.
- National Center for Health Statistics. National Health Interview Survey: 2023 survey description. 2024.
- RTI International. SUDAAN (Release 11.0.3) [computer software].
- Parker JD, Talih M, Malec DJ, Beresovsky V, Carroll M, Gonzalez JF Jr, et al. National Center for Health Statistics data presentation standards for proportions. National Center for Health Statistics. Vital Health Stat 2(175). 2017.
Suggested citation
Lucas JW, Sohi I. Chronic pain and high-impact chronic pain in U.S. adults, 2023. NCHS Data Brief, no 518. Hyattsville, MD: National Center for Health Statistics. 2024. DOI: https://dx.doi.org/10.15620/cdc/169630.
Copyright information
All material appearing in this report is in the public domain and may be reproduced or copied without permission; citation as to source, however, is appreciated.
National Center for Health Statistics
Brian C. Moyer, Ph.D., Director
Amy M. Branum, Ph.D., Associate Director for Science
Division of Health Interview Statistics
Stephen J. Blumberg, Ph.D., Director
Anjel Vahratian, Ph.D., M.P.H.,Associate Director for Science