Suicide Mortality in the United States, 2002–2022
- Key findings
- From 2002 through 2022, age-adjusted suicide rates increased for most years for males and females.
- From 2002 to 2022, suicide rates for females increased for all age groups.
- Suicide rates for males of all ages increased from 2002 to 2022, although rates for those ages 10–14 and 15–24 have declined since 2020.
- For females, firearms were the leading means of suicide in 2022.
Data from the National Vital Statistics System
- After increasing between 2002 to 2018, the age-adjusted suicide rate declined from 2018 (14.2 deaths per 100,000 standard population) through 2020 (13.5) and then increased to 14.2 in 2022, which was similar to the rate in 2021 (14.1).
- Following declines between 2018 and 2020, suicide rates generally increased between 2020 and 2022 for females age 25 and older.
- For males ages 10–14 and 15–24, rates decreased between 2020 and 2022, while rates for older age groups generally increased.
- For females in 2022, firearm-related suicide (2.0) was the leading means of suicide, with rates generally increasing since 2007.
- For males in 2022, firearm-related suicide (13.5) was the leading means of suicide, with rates increasing since 2006.
In 2022, suicide was the 11th leading cause of death for all ages in the United States, the same as in 2021 (1). Suicide was the second leading cause of death for people ages 10–14 and 20–34, and the third leading cause for people ages 15–19 (1). Following a peak in overall suicide rates in 2018, rates declined through 2020 (2), but provisional death data showed that suicide increased through 2022 (3). This report presents final suicide rates from 2002 through 2022 by sex, age, and means of suicide, using mortality data from the National Vital Statistics System.
Keywords: intentional self-harm, mechanism, mental health, suicidology, National Vital Statistics System
From 2002 through 2022, age-adjusted suicide rates increased for most years for males and females.
- The total age-adjusted suicide rate increased 30% from 2002 (10.9 deaths per 100,000 standard population) to 2018 (14.2), declined through 2020 (13.5), and then increased to 14.2 in 2022, which was similar to the rate in 2021 (14.1) (Figure 1, Table 1).
- The suicide rate for males increased from 18.5 in 2002 to 22.8 in 2018, declined for 2 years, and then increased again through 2022 (23.0), which was similar to the rate in 2021 (22.8).
- The suicide rate for females increased from 4.2 in 2002 to 6.0 in 2015, followed by a period of stability through 2018 (6.2). The rate then declined to 5.5 in 2020, followed by an increase to 5.9 in 2022, which was also higher than the rate in 2021 (5.7).
- The suicide rate for males was three to four times the rate for females across the period.
Figure 1. Age-adjusted suicide rate, by sex: United States, 2002–2022
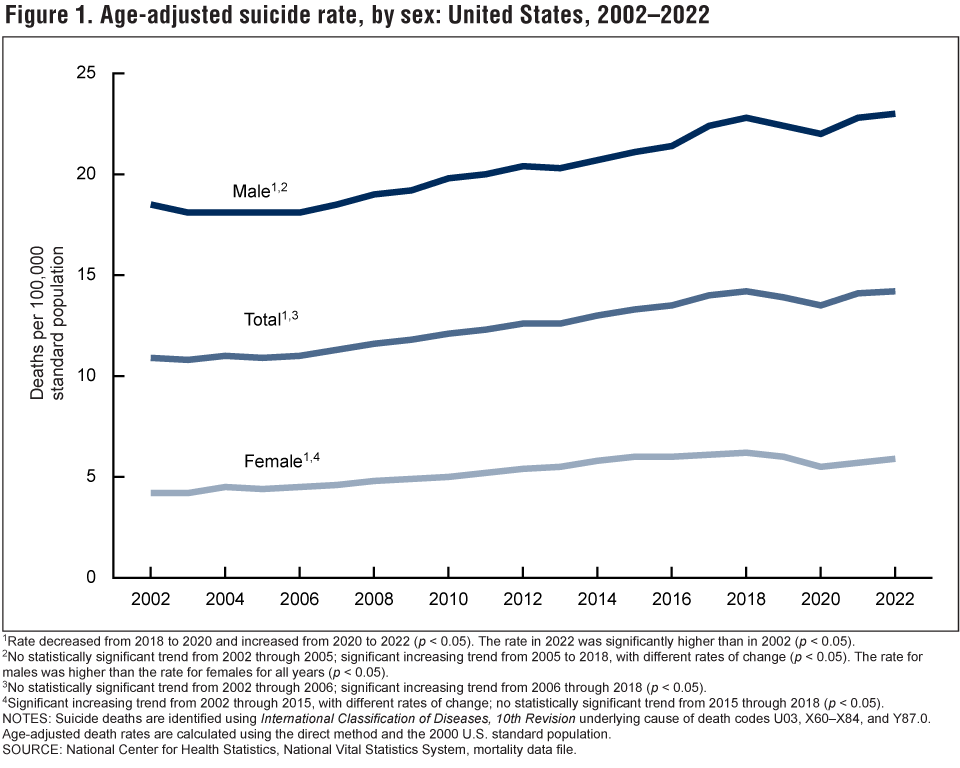
1Rate decreased from 2018 to 2020 and increased from 2020 to 2022 (p < 0.05). The rate in 2022 was significantly higher than in 2002 (p < 0.05).
2No statistically significant trend from 2002 through 2005; significant increasing trend from 2005 to 2018, with different rates of change (p < 0.05). The rate for males was higher than the rate for females for all years (p < 0.05).
3No statistically significant trend from 2002 through 2006; significant increasing trend from 2006 through 2018 (p < 0.05).
4Significant increasing trend from 2002 through 2015, with different rates of change; no statistically significant trend from 2015 through 2018 (p < 0.05).
NOTES: Suicide deaths are identified using International Classification of Diseases, 10th Revision underlying cause of death codes U03, X60–X84, and Y87.0. Age-adjusted death rates are calculated using the direct method and the 2000 U.S. standard population.
SOURCE: National Center for Health Statistics, National Vital Statistics System, mortality data file.
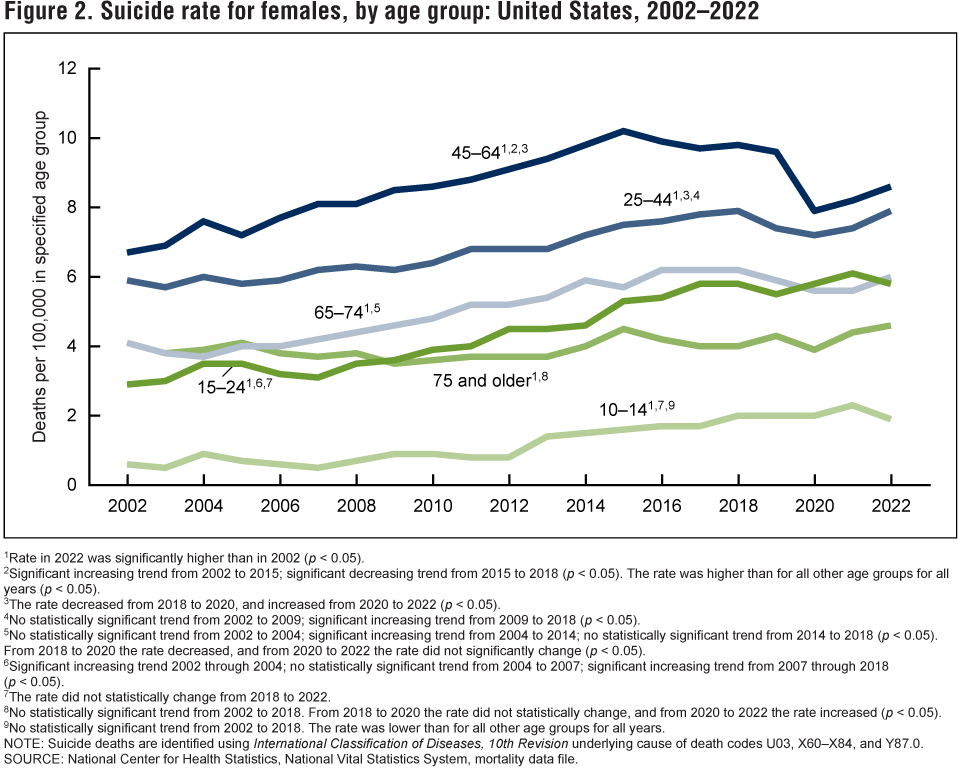
From 2002 to 2022, suicide rates for females increased for all age groups.
- For females age 74 and younger, suicide rates generally increased at varying rates between 2002 and 2018, followed by a period of decline or stability between 2018 and 2020 (Figure 2, Table 2). For females age 75 and older, suicide rates were stable between 2002 and 2020.
- Rates increased from 2020 through 2022 for females in age groups 25 years and older: 25–44 (from 7.2 deaths per 100,000 population to 7.9), 45–64 (7.9 to 8.6), 65–74 (5.6 to 6.0), and 75 and older (3.9 to 4.6). The increase for females 65–74 was not statistically significant.
- For females ages 10–14 and 15–24, rates did not change significantly between 2018 and 2022.
- From 2002 through 2022, suicide rates were highest for women ages 45–64 and lowest for females ages 10–14.
Figure 2. Suicide rate for females, by age group: United States, 2002–2022
1Rate in 2022 was significantly higher than in 2002 (p < 0.05).
2Significant increasing trend from 2002 to 2015; significant decreasing trend from 2015 to 2018 (p < 0.05). The rate was higher than for all other age groups for all years (p < 0.05).
3The rate decreased from 2018 to 2020, and increased from 2020 to 2022 (p < 0.05).
4No statistically significant trend from 2002 to 2009; significant increasing trend from 2009 to 2018 (p < 0.05).
5No statistically significant trend from 2002 to 2004; significant increasing trend from 2004 to 2014; no statistically significant trend from 2014 to 2018 (p < 0.05). From 2018 to 2020 the rate decreased, and from 2020 to 2022 the rate did not significantly change (p < 0.05).
6Significant increasing trend 2002 through 2004; no statistically significant trend from 2004 to 2007; significant increasing trend from 2007 through 2018 (p < 0.05).
7The rate did not statistically change from 2018 to 2022.
8No statistically significant trend from 2002 to 2018. From 2018 to 2020 the rate did not statistically change, and from 2020 to 2022 the rate increased (p < 0.05).
9No statistically significant trend from 2002 to 2018. The rate was lower than for all other age groups for all years.
NOTE: Suicide deaths are identified using International Classification of Diseases, 10th Revision underlying cause of death codes U03, X60–X84, and Y87.0.
SOURCE: National Center for Health Statistics, National Vital Statistics System, mortality data file.
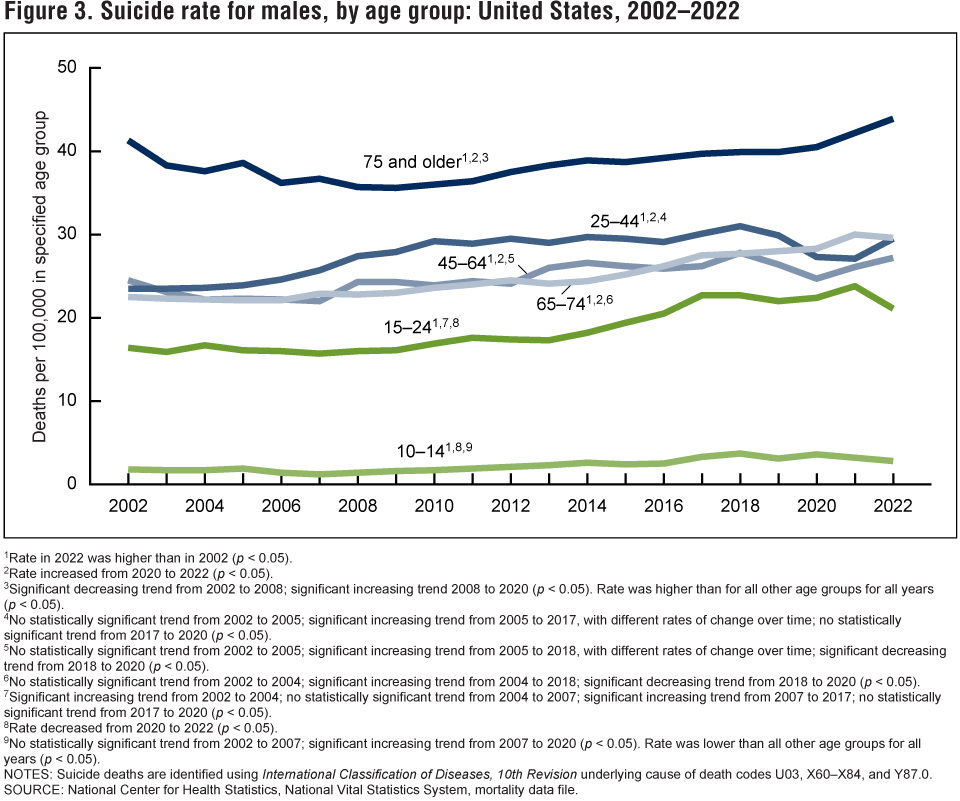
Suicide rates for males of all ages increased from 2002 to 2022, although rates for those ages 10–14 and 15–24 have declined since 2020.
- Despite some fluctuations during the period, suicide rates for males in all age groups were higher in 2022 than 2002 (Figure 3, Table 3).
- Between 2020 and 2022, rates decreased for males ages 10–14 (3.6 deaths per 100,000 population to 2.8) and 15–24 (22.4 to 21.1), while rates increased for males age 25 and older.
- From 2002 through 2022, suicide rates were highest for males age 75 and older and lowest for males ages 10–14.
Figure 3. Suicide rate for males, by age group: United States, 2002–2022
1Rate in 2022 was higher than in 2002 (p < 0.05).
2Rate increased from 2020 to 2022 (p < 0.05).
3Significant decreasing trend from 2002 to 2008; significant increasing trend 2008 to 2020 (p < 0.05). Rate was higher than for all other age groups for all years (p < 0.05).
4No statistically significant trend from 2002 to 2005; significant increasing trend from 2005 to 2017, with different rates of change over time; no statistically significant trend from 2017 to 2020 (p < 0.05).
5No statistically significant trend from 2002 to 2005; significant increasing trend from 2005 to 2018, with different rates of change over time; significant decreasing trend from 2018 to 2020 (p < 0.05).
6No statistically significant trend from 2002 to 2004; significant increasing trend from 2004 to 2018; significant decreasing trend from 2018 to 2020 (p < 0.05).
7Significant increasing trend from 2002 to 2004; no statistically significant trend from 2004 to 2007; significant increasing trend from 2007 to 2017; no statistically significant trend from 2017 to 2020 (p < 0.05).
8Rate decreased from 2020 to 2022 (p < 0.05).
9No statistically significant trend from 2002 to 2007; significant increasing trend from 2007 to 2020 (p < 0.05). Rate was lower than all other age groups for all years (p < 0.05).
NOTES: Suicide deaths are identified using International Classification of Diseases, 10th Revision underlying cause of death codes U03, X60–X84, and Y87.0.
SOURCE: National Center for Health Statistics, National Vital Statistics System, mortality data file.
For females, firearms were the leading means of suicide in 2022.
- For females, poisoning was the leading means of suicide between 2002 and 2015. The poisoning-related suicide rate was significantly lower than the firearm-related rate from 2020 through 2022 and was lower than the suffocation-related rate from 2018 through 2021 (Figure 4, Table 4).
- For females, the age-adjusted rate for firearm-related suicide increased from 2007 (1.4 deaths per 100,000 standard population) to 2016 (1.9), remained stable through 2020 (1.8), and then increased to 2.0 in 2022.
- The rate for suffocation-related suicide (including hanging, asphyxiation, strangulation, and other means) for females increased from 0.8 in 2002 to 1.9 in 2018, but decreased to 1.6 in 2022.
Figure 4. Age-adjusted female suicide rate, by means of suicide: United States, 2002–2022

1Significant increasing trend from 2002 to 2016; no significant trend from 2016 to 2022 (p < 0.05). Rate was higher than for all other groups from 2002 to 2016 (p < 0.05).
2No statistically significant trend from 2002 to 2007; significant increasing trend from 2007 to 2016; no statistically significant trend from 2016 to 2020; significant increasing trend from 2020 to 2022 (p < 0.05). Rate was higher than for all other groups for 2021 and 2022 (p < 0.05).
3Significant increasing trend from 2000 through 2018; significant decreasing trend from 2018 to 2022 (p < 0.05).
4No statistically significant trend from 2002 to 2010; significant increasing trend from 2010 to 2017; significant decreasing trend from 2017 to 2022 (p < 0.05).
NOTES: Suicide deaths are identified using International Classification of Diseases, 10th Revision (ICD–10) underlying cause-of-death codes U03, X60–X84, and Y87.0. Means of suicide are identified using ICD–10 codes X72–X74 for firearm, X60–X69 for poisoning, and X70 for suffocation. “Other means” includes: cut/pierce; drowning; falls; fire or flame; other land transport; struck by or against; other specified, classifiable injury; other specified, not elsewhere classified injury; and unspecified injury, as classified by ICD–10. Age-adjusted death rates are calculated using the direct method and the 2000 U.S. standard population.
SOURCE: National Center for Health Statistics, National Vital Statistics System, mortality data file.
For males, firearms were the leading means of suicide across the period with rates increasing from 2006 through 2022.
- Following a period of decline between 2002 (11.1 deaths per 100,000 standard population) and 2006 (10.3), the firearm-related suicide rate among males increased from 10.3 in 2006 to 13.5 in 2022 (Figure 5, Table 5).
- The rate for suffocation-related suicide for males increased from 3.8 in 2002 to 6.7 in 2018 but decreased to 5.8 in 2022.
- The rate for poisoning-related suicide for males was stable between 2002 (2.2) and 2010 (2.3), decreased though 2020 (1.7), and remained stable through 2022 (1.8).
- Firearms were the leading means of suicide for males across the period.
Figure 5. Age-adjusted male suicide rate, by means of suicide: United States, 2002–2022

1Significant decreasing trend from 2002 to 2006; significant increasing trend from 2006 to 2022 (p < 0.05). Rate was higher than for all other groups for all years (p < 0.05).
2Significant increasing trend from 2002 to 2018; with different rates of change; significant decreasing trend from 2018 to 2022 (p < 0.05).
3No statistically significant trend from 2002 to 2010; significant decreasing trend from 2010 to 2020, with different rates of change over time; no statistically significant trend from 2020 to 2022 (p < 0.05).
4No significant trend from 2002 to 2009; significant increasing trend from 2009 to 2022 (p < 0.05).
NOTES: Suicide deaths are identified using International Classification of Diseases, 10th Revision (ICD–10) underlying cause-of-death codes U03, X60–X84, and Y87.0. Means of suicide are identified using ICD–10 codes X72–X74 for firearm, X60–X69 for poisoning, and X70 for suffocation. “Other means” includes: cut/pierce; drowning; falls; fire or flame; other land transport; struck by or against; other specified, classifiable injury; other specified, not elsewhere classified injury; and unspecified injury, as classified by ICD–10. Age-adjusted death rates are calculated using the direct method and the 2000 U.S. standard population
SOURCE: National Center for Health Statistics, National Vital Statistics System, mortality data file.
Summary
This report presents suicide rates in the United States from 2002 through 2022 for males and females in total and by age and means of suicide. From 2002 to 2018, the total rate increased 30%, from 10.9 deaths per 100,000 standard population to 14.2, which was followed by two consecutive years of declines in 2019 (13.9) and 2020 (13.5). After these declines, however, the rate increased through 2022. The rate in 2022 (14.2), which was the same as the rate in 2018, marks the highest age-adjusted suicide rate in the United States since 1941 (4).
Rates increased for nearly all age groups between 2002 and 2018, followed by a period of decline or stability between 2018 and 2020. Recent changes between 2020 and 2022 have shown increasing trends among some age groups. For age 25 and older, rates for both males and females increased between 2020 and 2022, although the rate increase for females ages 65–74 was not significant. In contrast, for age groups 10–14 and 15–24, rates for females remained similar between 2020 and 2022, while rates for males declined.
For females, firearm-related suicide has been the leading means of suicide since 2020, when rates became significantly higher than poisoning-related suicide rates. Rates of suffocation-related suicide for females increased over the period and surpassed poisoning in 2018, although a recent decline resulted in a similar rate to poisoning in 2022. For males, rates of firearm-related suicide have been increasing since 2006 and remain consistently higher than suffocation, poisoning, and other means. Suffocation-related suicide remained the second leading means of suicide in males across the period, followed by poisoning.
Data source and methods
Data were analyzed using National Vital Statistics System multiple cause-of-death mortality files for 2002 through 2022 (5). Suicide deaths were identified using International Classification of Diseases, 10th Revision underlying cause-of-death codes U03, X60–X84, and Y87.0 (6). For Figure 4 and Figure 5, means of suicide were identified using ICD–10 codes X72–X74 for firearm, X60–X69 for poisoning, and X70 for suffocation. “Other” includes: cut/pierce (X78); drowning (X71); falls (X80); fire and flame (X76); other land transport (X82); struck by or against (X79); other specified, classifiable injury (U03.0, X75, and X81); other specified, not elsewhere classified injury (X83 and Y87.0); and unspecified injury, as classified by ICD–10 (U03.9 and X84).
Age-adjusted death rates were calculated using the direct method and the 2000 U.S. standard population (7). Although suicide deaths for children ages 5–9 years are included in total numbers and age-adjusted rates, they are not shown as part of age-specific numbers or rates because of the small number of suicide deaths per year in this age group.
Trends were evaluated using the Joinpoint Regression Program (5.0.2) (8). Joinpoint software was used to fit weighted least-squares regression models to the rates on the logarithmic scale. Analyses were set to allow as many as four joinpoints across the period, as few as two observed time points from any given joinpoint to either end of the data, and as few as one observed time point between any two joinpoints. The permutation tests for model (number of joinpoints) significance were set at an overall alpha level of 0.05 (8). Pairwise comparisons of rates (for example, age-adjusted rates for males compared with females and year to year comparisons) were conducted using the z test with an alpha level of 0.05 (8). Both Joinpoint software and pairwise z tests were used to discuss changes in rates over time.
About the authors
The authors are with the National Center for Health Statistics. Matthew F. Garnett is with the Division of Analysis and Epidemiology, and Sally C. Curtin is with the Division of Vital Statistics.
References
- National Center for Health Statistics. CDC WONDER. 1999–2020 Underlying Cause of Death by Bridged-Race Categories and 2018–2022 Underlying Cause of Death by Single-Race Categories. 2023.
- Garnett MF, Curtin SC. Suicide mortality in the United States, 2001–2021. NCHS Data Brief, no 464. Hyattsville, MD: National Center for Health Statistics. 2023. DOI: https://dx.doi.org/10.15620/cdc:125705.
- Curtin SC, Garnett MF, Ahmad FB. Provisional numbers and rates of suicide by month and demographic characteristics: United States, 2022. Vital Statistics Rapid Release; no 34. November 2023. DOI: https://dx.doi.org/10.15620/cdc:133702.
- National Center for Health Statistics. National Vital Statistics System. Age-adjusted death rates for selected causes, death registration states, 1900–32, and United States, 1933–98.
- National Center for Health Statistics. Public-use data file documentation: Mortality multiple cause-of-death. 2022.
- World Health Organization. International statistical classification of diseases and related health problems, 10th revision (ICD–10). 2008 ed. 2009
- Kochanek KD, Murphy SL, Xu JQ, Arias E. Deaths: Final data for 2020. National Vital Statistics Reports; vol 72 no 10. Hyattsville, MD: National Center for Health Statistics. 2023. DOI: https://dx.doi.org/10.15620/cdc:131355
- National Cancer Institute. Joinpoint Regression Program (Version 5.0.2) [computer software]. 2023
Suggested citation
Garnett MF, Curtin SC. Suicide mortality in the United States, 2002–2022. NCHS Data Brief, no 509. Hyattsville, MD: National Center for Health Statistics. 2024. DOI: https://dx.doi.org/10.15620/cdc/160504.
Copyright information
All material appearing in this report is in the public domain and may be reproduced or copied without permission; citation as to source, however, is appreciated.
National Center for Health Statistics
Brian C. Moyer, Ph.D., Acting Director
Amy M. Branum, Ph.D., Associate Director for Science
Division of Analysis and Epidemiology
Irma E. Arispe, Ph.D., Director
Kimberly A. Lochner, Sc.D., Associate Director for Science
Division of Vital Statistics
Paul D. Sutton, Ph.D., Acting Director
Andrés A. Berruti, Ph.D., M.A., Associate Director for Science