Obesity and Severe Obesity Prevalence in Adults: United States, August 2021–August 2023
- Key findings
- What was the prevalence of obesity in adults during August 2021–August 2023?
- Were there differences in the prevalence of obesity in adults by education level during August 2021-August 2023?
- What was the prevalence of severe obesity in adults during August 2021–August 2023?
- What are the recent trends in obesity and severe obesity in adults?
Data from the National Health and Nutrition Examination Survey
- During August 2021–August 2023, the prevalence of obesity in adults was 40.3%, with no significant differences between men and women. Obesity prevalence was higher in adults ages 40–59 than in ages 20–39 and 60 and older.
- The prevalence of obesity was lower in adults with a bachelor’s degree or more than in adults with less education.
- The prevalence of severe obesity in adults was 9.4% and was higher in women than men for each age group.
- From 2013–2014 through August 2021–August 2023, the age-adjusted prevalence of obesity did not change significantly, while severe obesity prevalence increased from 7.7% to 9.7%.
Obesity is a chronic condition that increases the risk of hypertension, type 2 diabetes, coronary heart disease, stroke, and certain cancers (1). Obesity and severe obesity prevalence increased from 1999–2000 through 2017–2018 (2). This report provides prevalence estimates of adult obesity and severe obesity during August 2021–August 2023 by age and sex, as well as obesity prevalence by education level. Trends in the prevalence of adult obesity and severe obesity over the previous 10 years are also shown.
Keywords: body mass index (BMI), trends, National Health and Nutrition Examination Survey (NHANES)
What was the prevalence of obesity in adults during August 2021–August 2023?
The prevalence of obesity among adults was 40.3% during August 2021–August 2023 (Figure 1, Table 1). The prevalence was 39.2% in men and 41.3% in women. No significant differences between men and women were seen overall or in any age group.
The prevalence of obesity in adults ages 40–59 was 46.4%, which was higher than the prevalence in adults ages 20–39 (35.5%) and 60 and older (38.9%). This pattern was seen in both men and women.
Figure 1. Prevalence of obesity in adults age 20 and older, by sex and age: United States, August 2021–August 2023
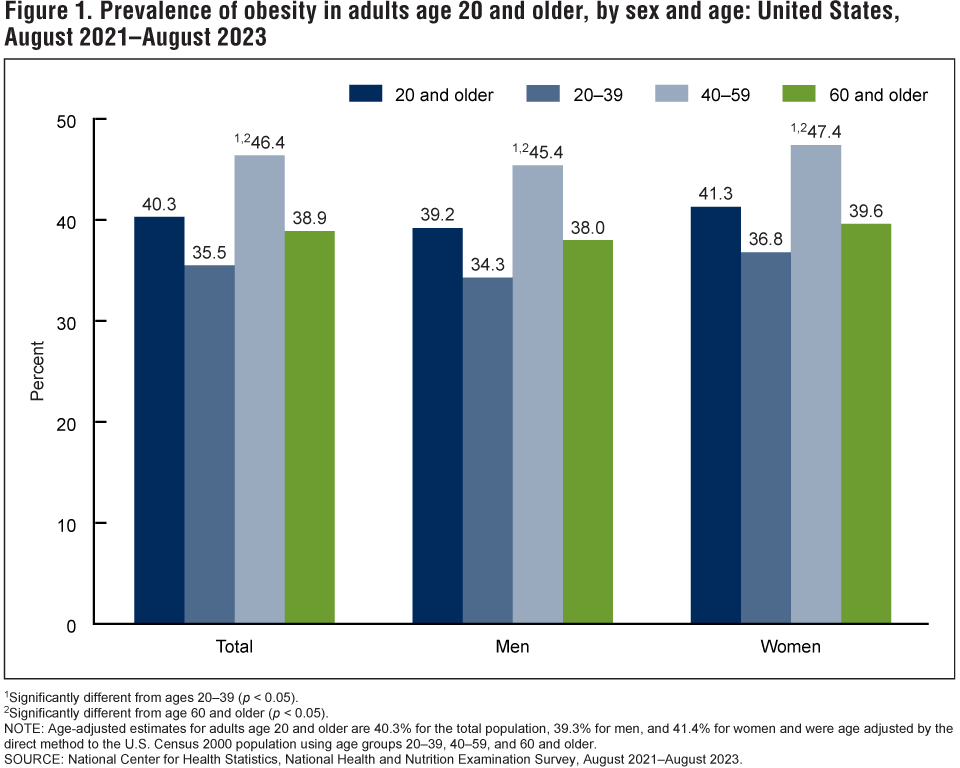
1Significantly different from ages 20–39 (p < 0.05).
2Significantly different from age 60 and older (p < 0.05).
NOTE: Age-adjusted estimates for adults age 20 and older are 40.3% for the total population, 39.3% for men, and 41.4% for women and were age adjusted by the direct method to the U.S. Census 2000 population using age groups 20–39, 40–59, and 60 and older.
SOURCE: National Center for Health Statistics, National Health and Nutrition Examination Survey, August 2021–August 2023.
Were there differences in the prevalence of obesity in adults by education level during August 2021-August 2023?
The prevalence of obesity was lower in adults with a bachelor’s degree or more (31.6%) than in adults with less education (Figure 2, Table 2). The difference in obesity prevalence between adults with a high school diploma or less (44.6%) and those with some college (45.0%) was not significant. No significant differences between men and women were seen in obesity prevalence by education level.
Figure 2. Prevalence of obesity in adults age 20 and older, by sex and education level: United States, August 2021–August 2023
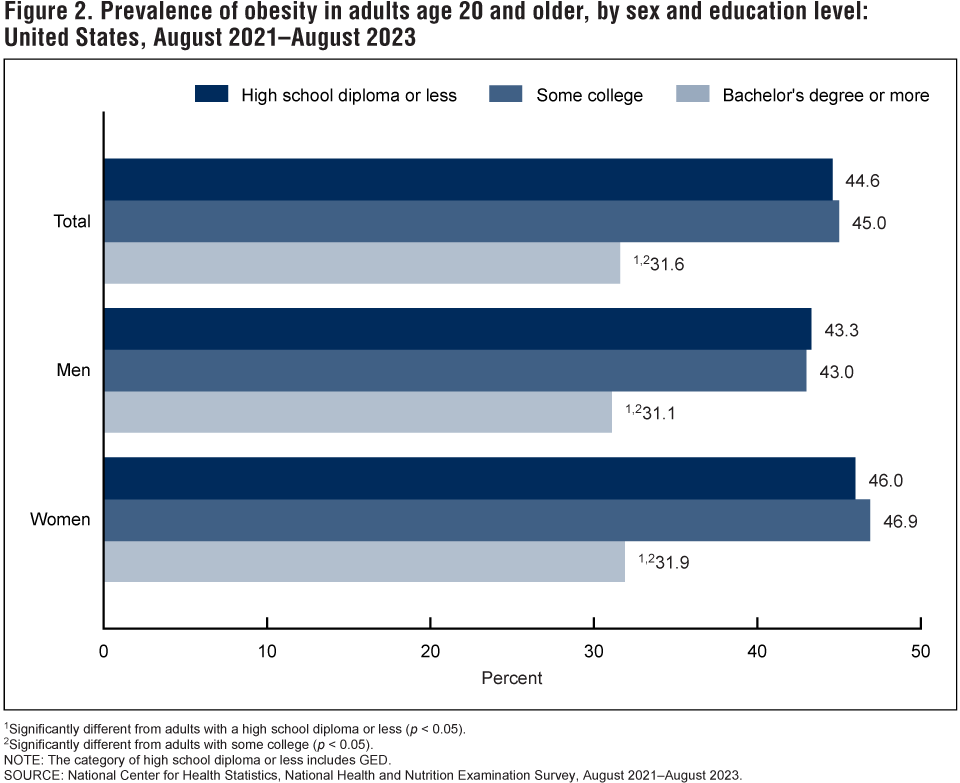
1Significantly different from adults with a high school diploma or less (p < 0.05).
2Significantly different from adults with some college (p < 0.05).
NOTE: The category of high school diploma or less includes GED.
SOURCE: National Center for Health Statistics, National Health and Nutrition Examination Survey, August 2021–August 2023.
What was the prevalence of severe obesity in adults during August 2021–August 2023?
The prevalence of severe obesity in adults was 9.4% during August 2021–August 2023, and was higher in adults ages 20–39 (9.5%) and 40–59 (12.0%) than in adults age 60 and older (6.6%) (Figure 3, Table 3).
The prevalence of severe obesity in men (6.7%) was lower than in women (12.1%) overall and for each age group. Among men, the prevalence was highest in those ages 40–59. Among women, the prevalence was higher in those ages 20–39 and 40–59 than in those age 60 and older.
Figure 3. Prevalence of severe obesity in adults age 20 and older, by sex and age: United States, August 2021–August 2023

1Significantly different from ages 20–39 (p < 0.05).
2Significantly different from ages 40–59 (p < 0.05).
3Significantly different from women (p < 0.05).
NOTE: Age-adjusted estimates for adults age 20 and older are 9.7% for the total population, 6.8% for men, and 12.6% for women and were age adjusted by the direct method to the U.S. Census 2000 population using age groups 20–39, 40–59, and 60 and older.
SOURCE: National Center for Health Statistics, National Health and Nutrition Examination Survey, August 2021–August 2023.
What are the recent trends in obesity and severe obesity in adults?
From 2013–2014 through August 2021–August 2023, the age-adjusted prevalence of obesity in adults did not change significantly, while the age-adjusted prevalence of severe obesity increased from 7.7% to 9.7% (Figure 4, Table 4). Changes in the prevalence of obesity and severe obesity between the two most recent survey cycles, 2017–March 2020 and August 2021–August 2023, were not significant.
Figure 4. Trends in age-adjusted obesity and severe obesity prevalence in adults age 20 and older: United States, 2013–2014 through August 2021–August 2023

1Significant linear trend (p < 0.05).
NOTE: Estimates are age adjusted by the direct method to the U.S. Census 2000 population using the age groups 20–39, 40–59, and 60 and older.
SOURCE: National Center for Health Statistics, National Health and Nutrition Examination Survey, 2013–2014 through August 2021–August 2023.
Summary
During August 2021–August 2023, the prevalence of obesity among adults in the United States was 40.3%. Obesity prevalence was highest in adults ages 40–59 compared with other age groups and was lowest in adults with a bachelor’s degree or more compared with those with less education. The prevalence of severe obesity was 9.4%. Severe obesity prevalence was higher in women than men for each age group.
In this report, obesity is defined by body mass index (BMI), which has limitations. Body fat may vary by sex, age, and race and Hispanic origin at a given BMI level (3,4). BMI does not measure body fat directly, nor does it provide information on body fat distribution (5). The distribution of excess body fat, especially visceral fat, contributes to the risk of cardiovascular and metabolic disease (6). Despite these limitations, BMI is a simple and inexpensive screening tool for conditions that may increase the risk of certain chronic diseases.
In the United States, the prevalence of obesity in adults remains above the Healthy People 2030 goal of 36.0% (7), but from 2013–2014 through August 2021–August 2023, the age-adjusted prevalence of obesity in adults did not change significantly. Monitoring obesity prevalence is important for understanding trends over time.
Definition
Body mass index (BMI): Calculated as weight in kilograms divided by height in meters squared, rounded to one decimal place.
Obesity: Defined as a BMI of greater than or equal to 30.
Severe obesity: Defined as a BMI of greater than or equal to 40.
Data source and methods
Data from the August 2021–August 2023 National Health and Nutrition Examination Survey (NHANES) were used to estimate obesity and severe obesity prevalence and to test for differences between subgroups. Data from four NHANES cycles (2013–2014, 2015–2016, 2017–March 2020, and August 2021–August 2023) were used to assess 10-year trends.
NHANES is a cross-sectional survey designed to monitor the health and nutritional status of the U.S. civilian noninstitutionalized population and is conducted by the National Center for Health Statistics (8–10). It consists of home interviews followed by standardized health examinations conducted in mobile examination centers. The NHANES sample is selected through a complex, multistage probability design.
From 1999 through March 2020, NHANES was conducted continuously. Following a pause in data collection in March 2020 due to the COVID-19 pandemic, field operations resumed in August 2021 with modifications to the survey content, procedures, and methodologies (11). New screening and safety measures were implemented at the mobile examination centers, but no changes from past protocols were made to the anthropometry (body measures) component of the survey. For NHANES August 2021–August 2023, oversampling by race, Hispanic origin, and income was eliminated to reduce the number of households that needed to be screened
This analysis included all examined NHANES participants age 20 and older. Pregnant women and adults with missing height or weight measurements were excluded from the analysis. Measured height and weight were used to calculate BMI. Examination sample weights, which account for the differential probabilities of selection and nonresponse, were incorporated into the analysis. The analysis accounted for the survey’s complex, multistage probability design. For August 2021–August 2023, differences between estimates overall, among subgroups, and compared with 2017–March 2020 were evaluated using t tests at the 0.05 level. Polynomial regression was used to test the significance of linear and nonlinear 10-year trends, accounting for the unequal spacing and lengths of survey cycles.
Data management and statistical analyses were conducted using SAS System for Windows version 9.4 (SAS Institute, Inc., Cary, N.C.), SUDAAN version 11.0.4 (RTI International, Research Triangle Park, N.C.), and R version 4.4.0, including the R survey package version 4.4–2 (12,13).
About the authors
Samuel D. Emmerich is an Epidemic Intelligence Service Officer assigned to the National Center for Health Statistics, Division of Health and Nutrition Examination Surveys. Cheryl D. Fryar, Bryan Stierman, and Cynthia L. Ogden are with the National Center for Health Statistics, Division of Health and Nutrition Examination Surveys.
References
- National Heart, Lung, and Blood Institute. Managing overweight and obesity in adults: Systematic evidence review from the Obesity Expert Panel. 2013.
- Hales CM, Carroll MD, Fryar CD, Ogden CL. Prevalence of obesity and severe obesity among adults: United States, 2017–2018. NCHS Data Brief, no 360. Hyattsville, MD: National Center for Health Statistics. 2020.
- Caleyachetty R, Barber TM, Mohammed NI, Cappuccio FP, Hardy R, Mathur R, et al. Ethnicity-specific BMI cutoffs for obesity based on type 2 diabetes risk in England: A population-based cohort study. Lancet Diabetes Endocrinol 9(7):419–26. 2021.
- Flegal KM, Ogden CL, Yanovski JA, Freedman DS, Shepherd JA, Graubard BI, Borrud LG. High adiposity and high body mass index-for-age in U.S. children and adolescents overall and by race-ethnic group. Am J Clin Nutr 91(4):1020–6. 2010.
- Neeland IJ, Poirier P, Després JP. The cardiovascular and metabolic heterogeneity of obesity: Clinical challenges and implications for management. Circulation 137(13):1391–406. 2018.
- Neeland IJ, Ross R, Després JP, Matsuzawa Y, Yamashita S, Shai I, et al. Visceral and ectopic fat, atherosclerosis, and cardiometabolic disease: A position statement. Lancet Diabetes Endocrinol 7(9):715–25. 2019.
- U.S. Department of Health and Human Services. Office of Disease Prevention and Health Promotion. Healthy People 2030 objectives and data: Overweight and obesity.
- Johnson CL, Dohrmann SM, Burt VL, Mohadjer LK. National Health and Nutrition Examination Survey: Sample design, 2011–2014. National Center for Health Statistics. Vital Health Stat 2(162). 2014.
- Chen TC, Clark J, Riddles MK, Mohadjer LK, Fakhouri THI. National Health and Nutrition Examination Survey, 2015−2018: Sample design and estimation procedures. National Center for Health Statistics. Vital Health Stat 2(184). 2020.
- Akinbami LJ, Chen TC, Davy O, Ogden CL, Fink S, Clark J, et al. National Health and Nutrition Examination Survey, 2017–March 2020 prepandemic file: Sample design, estimation, and analytic guidelines. National Center for Health Statistics. Vital Health Stat 2(190). 2022.
- Terry AL, Chiappa MM, McAllister J, Woodwell DA, Graber JE. Plan and operations of the National Health and Nutrition Examination Survey, August 2021–August 2023. National Center for Health Statistics. Vital Health Stat 1(66). 2024.
- RTI International. SUDAAN (Release 11.0.3) [computer software]. 2020.
- R Foundation. R version 4.4.0 [computer program]. 2024.
Suggested citation
Emmerich SD, Fryar CD, Stierman B, Ogden CL. Obesity and severe obesity prevalence in adults: United States, August 2021–August 2023. NCHS Data Brief, no 508. Hyattsville, MD: National Center for Health Statistics. 2024. DOI: https://dx.doi.org/10.15620/cdc/159281.
Copyright information
All material appearing in this report is in the public domain and may be reproduced or copied without permission; citation as to source, however, is appreciated.
National Center for Health Statistics
Brian C. Moyer, Ph.D., Director
Amy M. Branum, Ph.D., Associate Director for Science
Division of Health and Nutrition Examination Surveys
Alan E. Simon, M.D., Director
Lara J. Akinbami, M.D., Associate Director for Science