Births in the United States, 2023
- Key findings
- The number of births and the general fertility rate declined from 2022 to 2023.
- Birth rates declined for females ages 15–19 from 2022 to 2023.
- Prenatal care beginning in the first trimester declined for the second year in a row in 2023.
- The preterm birth rate was unchanged from 2022 to 2023, but early-term births increased.
Data from the National Vital Statistics System
- The number of births in the United States declined 2% from 2022 to 2023. The general fertility rate declined 3% in 2023 to 54.5 births per 1,000 females ages 15–44.
- Birth rates declined for females ages 15–19 (4%), 15–17 (2%), and 18–19 (5%), from 2022 to 2023.
- The percentage of mothers receiving prenatal care in the first trimester of pregnancy declined 1% from 2022 to 2023, while the percentage of mothers with no prenatal care increased 5%.
- The preterm birth rate was essentially unchanged at 10.41% in 2023, but the rate of early-term births rose 2% to 29.84%.
This report presents highlights from 2023 final birth data on key demographic and maternal and infant health indicators. The number of births, the general fertility rate (births per 1,000 females ages 15–44), teen birth rates, the distribution of births by trimester prenatal care began, and the distribution of births by gestational age (less than 37 weeks, 37–38 weeks, 39–40 weeks, and 41 or later weeks of gestation) are presented. For all indicators, results for 2023 are compared with those for 2022 and 2021.
Keywords: general fertility rate, prenatal care, gestational age, National Vital Statistics System.
The number of births and the general fertility rate declined from 2022 to 2023.
- In 2023, 3,596,017 births were registered in the United States, down 2% from 2022 (3,667,758) and 2021 (3,664,292) (Figure 1, Table 1).
- The general fertility rate for the United States decreased 3% in 2023 to 54.5 births per 1,000 females ages 15–44 from 56.0 in 2022; the general fertility rate was also down 3% from 2021 (56.3).
Figure 1. Number of live births and general fertility rates: United States, 2021–2023
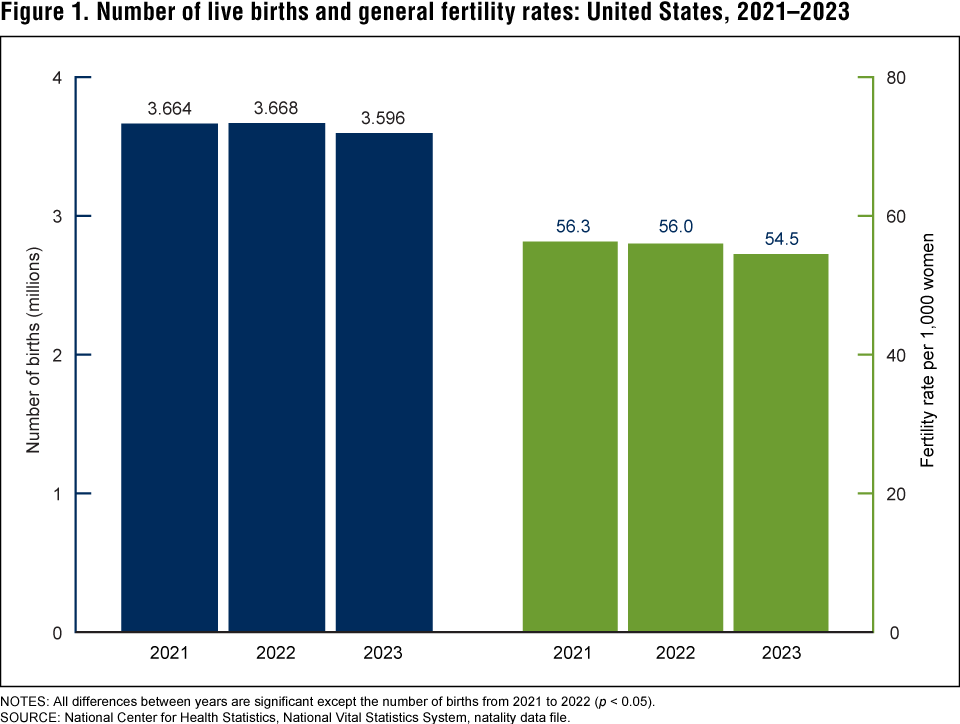
NOTE: All differences between years are significant except the number of births from 2021 to 2022 (p < 0.05).
SOURCE: National Center for Health Statistics, National Vital Statistics System, natality data file.
Birth rates declined for females ages 15–19 from 2022 to 2023.
- The birth rate for teenagers ages 15–19 declined 4% from 2022 to 2023, from 13.6 to 13.1 births per 1,000 females, and was down 6% from 2021 (13.9) (Figure 2, Table 2).
- From 2022 to 2023, the birth rate for teenagers ages 15–17 declined 2%, from 5.6 to 5.5; there was no change in the rate from 2021 to 2022.
- The rate for teenagers ages 18–19 declined 5% from 2022 to 2023, from 25.8 to 24.6 and has declined 8% since 2021 (26.6).
Figure 2. Birth rate for teenagers, by maternal age: United States, 2021–2023
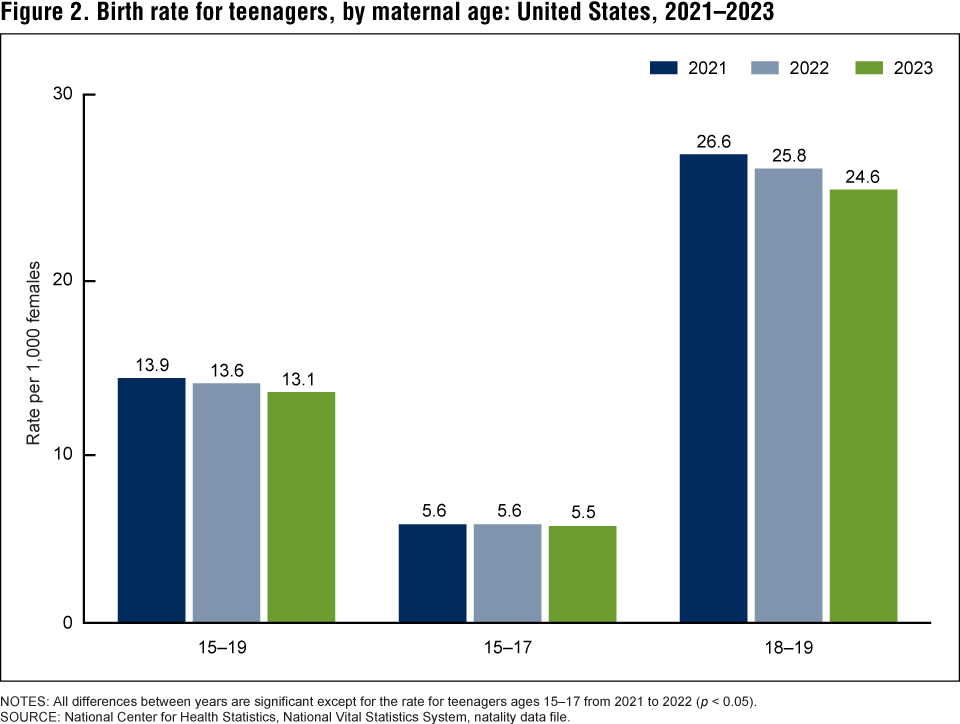
NOTE: All differences between years are significant except for the rate for teenagers ages 15–17 from 2021 to 2022 (p < 0.05).
SOURCE: National Center for Health Statistics, National Vital Statistics System, natality data file.
Prenatal care beginning in the first trimester declined for the second year in a row in 2023.
- Prenatal care beginning in the first trimester declined 1% in 2023 to 76.1%, from 77.0% in 2022. This follows a 2% decline from 2021 (78.3%) to 2022 (Figure 3, Table 3).
- Care beginning in the second trimester increased 4% in 2023, from 16.3% in 2022 to 16.9%. This follows a 6% increase from 2021 (15.4%).
- Care beginning in the third trimester increased 2% from 2022 (4.6%) to 2023 (4.7%) following a 10% increase from 2021 (4.2%) to 2022.
- The percentage of mothers receiving no prenatal care increased 5% in 2023 to 2.3% from 2.2% in 2022; the percentage of mothers with no prenatal care also rose 5% from 2021 (2.1%) to 2022.
Figure 3. Distribution of trimester prenatal care began: United States, 2021–2023
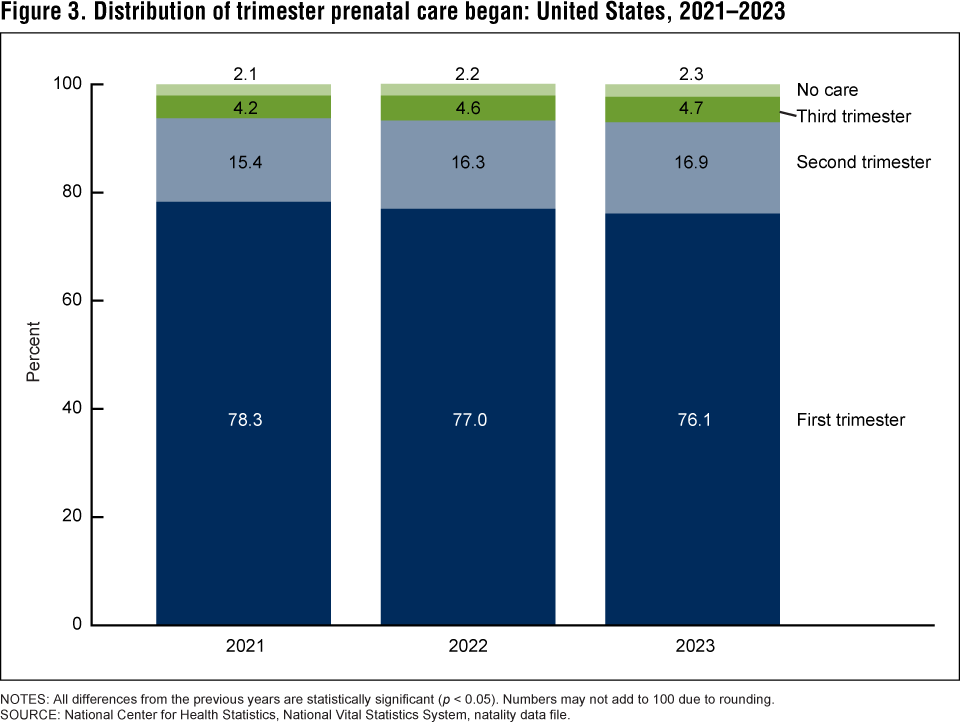
NOTES: All differences from the previous years are statistically significant (p < 0.05). Numbers may not add to 100 due to rounding.
SOURCE: National Center for Health Statistics, National Vital Statistics System, natality data file.
The preterm birth rate was unchanged from 2022 to 2023, but early-term births increased.
- The percentage of infants born preterm was essentially unchanged from 2022 (10.38%) to 2023 (10.41%) but was down 1% from 2021 (10.49%) (Figure 4, Table 4).
- The percentage of infants born early term rose 2% from 2022 to 2023, from 29.31% to 29.84%, and was up 4% from 2021 (28.76%).
- In contrast, the percentage of full-term births declined 1%, from 2022 to 2023 (55.32% to 54.94%) and has declined 2% since 2021 (55.90%).
- The percentage of infants born late or post term was 4.82% in 2023, down 3% from 2022 (4.99%) and 1% from 2021 (4.85%).
Figure 4. Distribution of births by gestational age: United States, 2021–2023

1Significant increase from 2021.
2Significant decline from 2021 and 2022.
3Significant decline from 2021.
4Significant increase from 2021 and 2022.
NOTES: Preterm is less than 37 weeks of gestation, early term is 37–38 weeks, full term is 39–40 weeks, and late and post term is 41 weeks or later. Numbers may not add to 100 due to rounding.
SOURCE: National Center for Health Statistics, National Vital Statistics System, natality data file.
Summary
U.S. birth certificate data for 2023 show continued declines in the number (2%) and rate (3%) of births from 2022 to 2023. Since the most recent high in 2007, the number of births has declined 17%, and the general fertility rate has declined 21% (1). The teen birth rate also continued to decline in 2023 and has declined two-thirds since 2007 (1). The percentage of women beginning care in the first trimester of pregnancy declined in 2023 and was down 3% from the most recent high in 2021; first trimester care had been on the rise from 2016 to 2021. At the same time, the percentage of women with late care or with no care rose from 2021 to 2023; late and no-care levels have risen steadily since 2016 (1). The preterm birth rate was essentially unchanged from 2022 to 2023, but early-term births rose 2%, and full-term and late- and post-term births declined 1% and 3%, respectively. Since the most recent low in 2014, preterm birth rates have risen 9% and early-term births by 21%, while full-term and late- and post-term births have declined (1).
Definition
General fertility rate: Number of births per 1,000 females ages 15–44.
Gestational age: Preterm is births delivered before 37 completed weeks of gestation, early term is 37–38 weeks, full term is 39–40 weeks, and late and post term is 41 or later weeks. Gestational age is based on the obstetric estimate of gestation in completed weeks.
Teenage birth rates: Births per 1,000 females in the specified age groups 15–19, 15–17, and 18–19.
Trimester prenatal care began: The timing of care based on the date a physician or other health care provider examined or counseled the pregnant woman for the pregnancy and the obstetric estimate of gestational age.
Data source and methods
This report uses data from the natality data file from the National Vital Statistics System. The vital statistics natality file is based on information from birth certificates and includes information for all births occurring in the United States. This Data Brief accompanies the release of the 2023 natality public-use file (2). More detailed analyses of the topics presented in this report and other topics such as births by age of mother, tobacco use during pregnancy, pregnancy risk factors, prenatal care timing and utilization, receipt of WIC food, maternal body mass index, and breastfeeding are possible by using the annual natality files (2). Additional information from the 2023 final birth data file is available via the CDC WONDER platform and will be included in the final 2023 National Vital Statistics Births Report.
References to increases or decreases in rates or percentages indicate differences are statistically significant at the 0.05 level based on a two-tailed z test. References to decreases in the number of births indicate differences are statistically significant at the 0.05 level based on a two-tailed chi-squared test. Computations exclude records for which information is unknown.
Rates shown in this report are based on population estimates calculated from a base that incorporates the 2020 census, vintage 2020 estimates for April 1, 2020, and 2020 demographic analysis estimates. Rates are calculated based on population estimates as of July 1, 2022, (vintage 2022) and July 1, 2023 (vintage 2023) (1,3). The vintage 2023 population estimates include methodological changes made after the release of the vintage 2022 population estimates and projection (4,5). Changes in rates from 2022 to 2023 reflect changes in births and changes in population estimates.
About the authors
Joyce A. Martin, Brady E. Hamilton, and Michelle J.K. Osterman are with the National Center for Health Statistics, Division of Vital Statistics.
References
- Osterman MJK, Hamilton BE, Martin JA, Driscoll AK, Valenzuela CP. Births: Final data for 2022. National Vital Statistics Reports; vol 73 no 1. Hyattsville, MD: National Center for Health Statistics. 2024. DOI: https://dx.doi.org/10.15620/cdc:145588
- National Center for Health Statistics. Vital statistics online data portal.
- U.S. Census Bureau. Annual state resident population estimates for six race groups (five race alone groups and two or more races) by age, sex, and Hispanic origin: April 1, 2010, to July 1, 2023. 2024.
- U.S. Census Bureau. Methodology for the United States population estimates: Vintage 2023. Nation, states, counties, and Puerto Rico—April 1, 2010 to July 1, 2023. 2023.
- U.S. Census Bureau. Vintage 2023 release notes. 2024.
Suggested citation
Martin JA, Hamilton BE, Osterman MJK. Births in the United States, 2023. NCHS Data Brief, no 507. Hyattsville, MD: National Center for Health Statistics. 2024. DOI: https://dx.doi.org/10.15620/cdc/158789.
Copyright information
All material appearing in this report is in the public domain and may be reproduced or copied without permission; citation as to source, however, is appreciated.
National Center for Health Statistics
Brian C. Moyer, Ph.D., Acting Director
Amy M. Branum, Ph.D., Associate Director for Science
Division of Vital Statistics
Paul D. Sutton, Ph.D., Acting Director
Andrés A. Berruti, Ph.D., M.A., Associate Director for Science