Walking for Leisure and Transportation Among Adults: United States, 2022
NCHS Data Brief No. 504, July 2024
PDF Version (553 KB)
Dzifa Adjaye-Gbewonyo, Ph.D., and Elizabeth M. Briones, Ph.D.
- Key findings
- What percentage of adults walked for leisure in the past 7 days, and were there differences by demographic characteristics?
- Were there differences in the percentage of adults who walked for leisure in the past 7 days by socioeconomic status?
- Did the percentage of adults who walked for transportation in the past 7 days vary by sex, age, and race and Hispanic origin?
- Were there differences in the percentage of adults who walked for transportation in the past 7 days by socioeconomic status?
Data from the National Health Interview Survey
- In 2022, 58.7% of adults walked for leisure in the past 7 days, with a higher prevalence among Asian non-Hispanic adults than Black non-Hispanic, other and multiple-race non-Hispanic, and Hispanic adults.
- Walking for leisure increased with increasing family income and education level.
- In 2022, 16.2% of adults walked for transportation; men (17.3%) were more likely than women (15.0%) to walk for transportation.
- Transportation walking was highest among adults with family incomes below 100% of the federal poverty level (24.1%) and lowest among those with family incomes from 200% to 399% of the federal poverty level (12.6%).
Walking, either as a leisure activity or to get from place to place, has been shown to offer considerable health benefits (1). Previous studies have found a marked increase in transportation and leisure walking in recent years, as well as variations in walking by certain population characteristics (2,3). This report uses data from the 2022 National Health Interview Survey to describe the percentage of adults who walked for leisure and transportation in the past 7 days by selected sociodemographic characteristics.
Keywords: physical activity, health behaviors, pedestrian, National Health Interview Survey (NHIS)
What percentage of adults walked for leisure in the past 7 days, and were there differences by demographic characteristics?
In 2022, 58.7% of adults walked for leisure in the past 7 days (Figure 1, Table 1). The percentage of adults who walked for leisure decreased with increasing age, from 61.8% of adults ages 18–44 and 59.1% of adults ages 45–64 to 51.6% of adults age 65 and older. Women (60.5%) were more likely than men (56.9%) to walk for leisure.
Black non-Hispanic (subsequently, Black) adults were less likely (49.2%) than Asian non-Hispanic (subsequently, Asian) (63.8%), White non-Hispanic (subsequently, White) (61.5%), other and multiple-race non-Hispanic (subsequently, other and multiple race) (57.5%), and Hispanic (53.5%) adults to walk for leisure. Asian adults were also more likely than Hispanic and other and multiple-race adults to walk for leisure, while White adults were more likely than Hispanic adults to walk for leisure. Observed differences between American Indian and Alaska Native non-Hispanic (subsequently, American Indian and Alaska Native) adults (55.9%) and all other race and Hispanic-origin groups were not significant.
Figure 1. Percentage of adults who walked for leisure in the past 7 days, by age group, sex, and race and Hispanic origin: United States, 2022
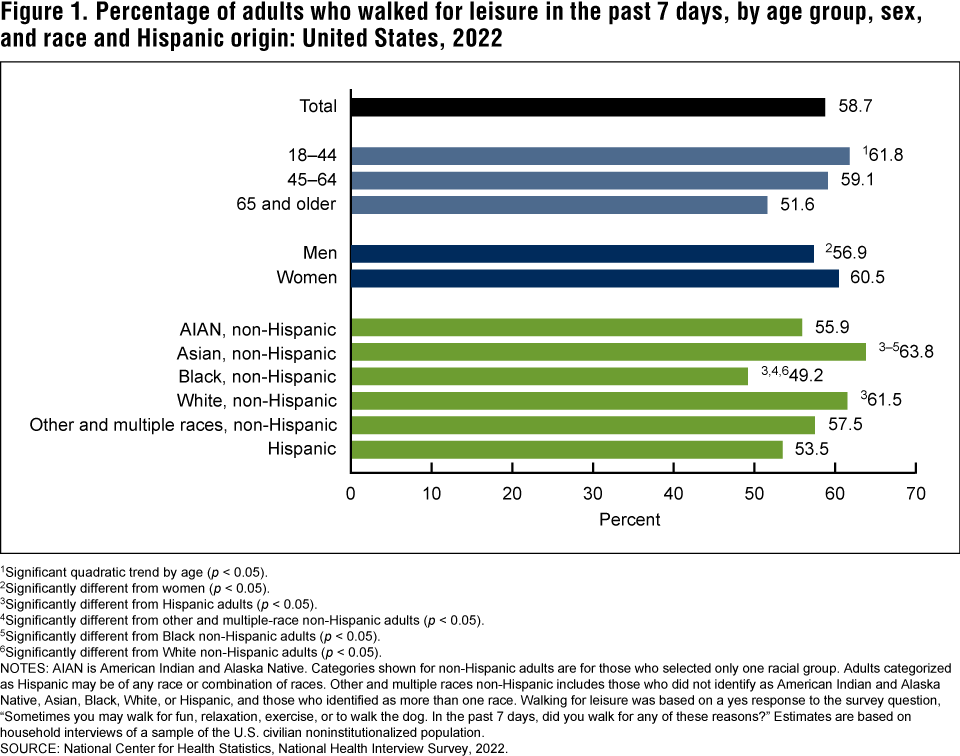
1Significant quadratic trend by age (p < 0.05).
2Significantly different from women (p < 0.05).
3Significantly different from Hispanic adults (p < 0.05).
4Significantly different from other and multiple-race non-Hispanic adults (p < 0.05).
5Significantly different from Black non-Hispanic adults (p < 0.05).
6Significantly different from White non-Hispanic adults(p < 0.05).
NOTES: AIAN is American Indian and Alaska Native. Categories shown for non-Hispanic adults are for those who selected only one racial group. Adults categorized as Hispanic may be of any race or combination of races. Other and multiple races non-Hispanic includes those who did not identify as American Indian and Alaska Native, Asian, Black, White, or Hispanic, and those who identified as more than one race. Walking for leisure was based on a yes response to the survey question, “Sometimes you may walk for fun, relaxation, exercise, or to walk the dog. In the past 7 days, did you walk for any of these reasons?” Estimates are based on household interviews of a sample of the U.S. civilian noninstitutionalized population.
SOURCE: National Center for Health Statistics, National Health Interview Survey, 2022.
Were there differences in the percentage of adults who walked for leisure in the past 7 days by socioeconomic status?
In 2022, the percentage of adults who walked for leisure in the past 7 days increased with family income, from 46.9% among adults with family incomes below 100% of the federal poverty level (FPL), 50.6% among those with family incomes from 100% to 199% FPL, and 54.9% among those with family incomes from 200% to 399% FPL, to 67.2% among adults with family incomes of 400% FPL or greater (Figure 2, Table 2). The percentage of adults who walked for leisure also increased with increasing education level, from 43.7% among adults with less than a high school diploma or GED to 50.1% among those with a high school diploma or GED, 58.0% among those with some college, and 71.2% among those with a bachelor’s degree or higher.
Figure 2. Percentage of adults who walked for leisure in the past 7 days, by family income and education: United States, 2022
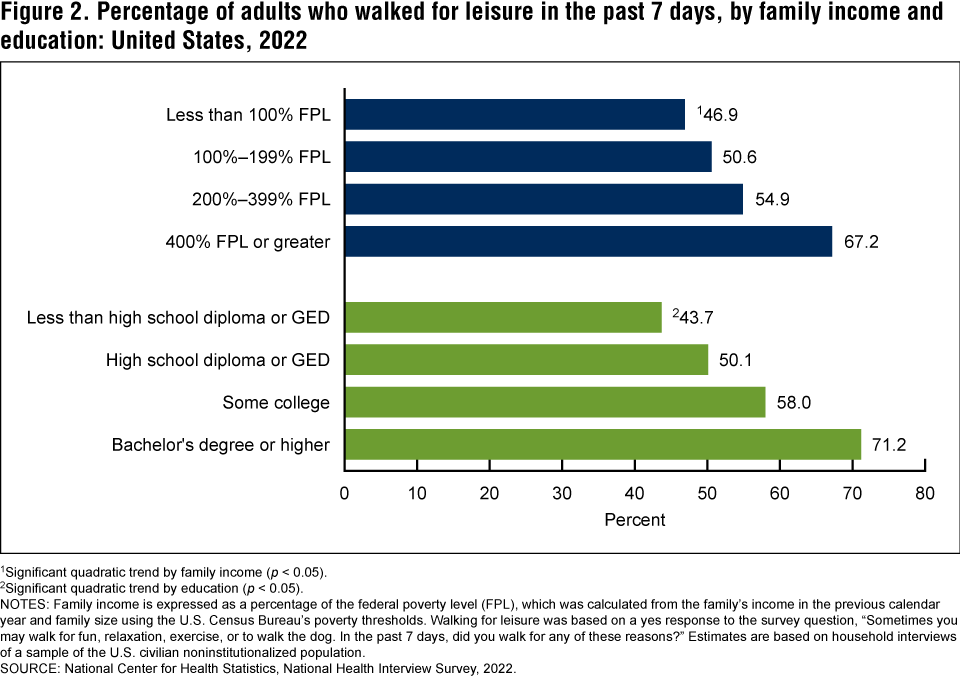
1Significant quadratic trend by family income (p < 0.05).
2Significant quadratic trend by education (p < 0.05).
NOTES: Family income is expressed as a percentage of the federal poverty level (FPL), which was calculated from the family’s income in the previous calendar year and family size using the U.S. Census Bureau’s poverty thresholds. Walking for leisure was based on a yes response to the survey question, “Sometimes you may walk for fun, relaxation, exercise, or to walk the dog. In the past 7 days, did you walk for any of these reasons?” Estimates are based on household interviews of a sample of the U.S. civilian noninstitutionalized population.
SOURCE: National Center for Health Statistics, National Health Interview Survey, 2022.
Did the percentage of adults who walked for transportation in the past 7 days vary by sex, age, and race and Hispanic origin?
In 2022, 16.2% of adults walked for transportation in the past 7 days (Figure 3, Table 3). The percentage of adults who walked for transportation decreased with increasing age, from 20.9% among adults ages 18–44 to 13.4% of those ages 45–64 and 10.3% of those age 65 and older. Men (17.3%) were more likely than women (15.0%) to walk for transportation. Additionally, Hispanic (16.3%) and White (14.9%) adults were less likely than other and multiple-race (23.3%), Asian (21.6%), and Black (18.6%) adults to walk for transportation. Observed differences between American Indian and Alaska Native adults (20.6%) and all other race and Hispanic-origin groups were not significant.
Figure 3. Percentage of adults who walked for transportation in the past 7 days, by age group, sex, and race and Hispanic origin: United States, 2022
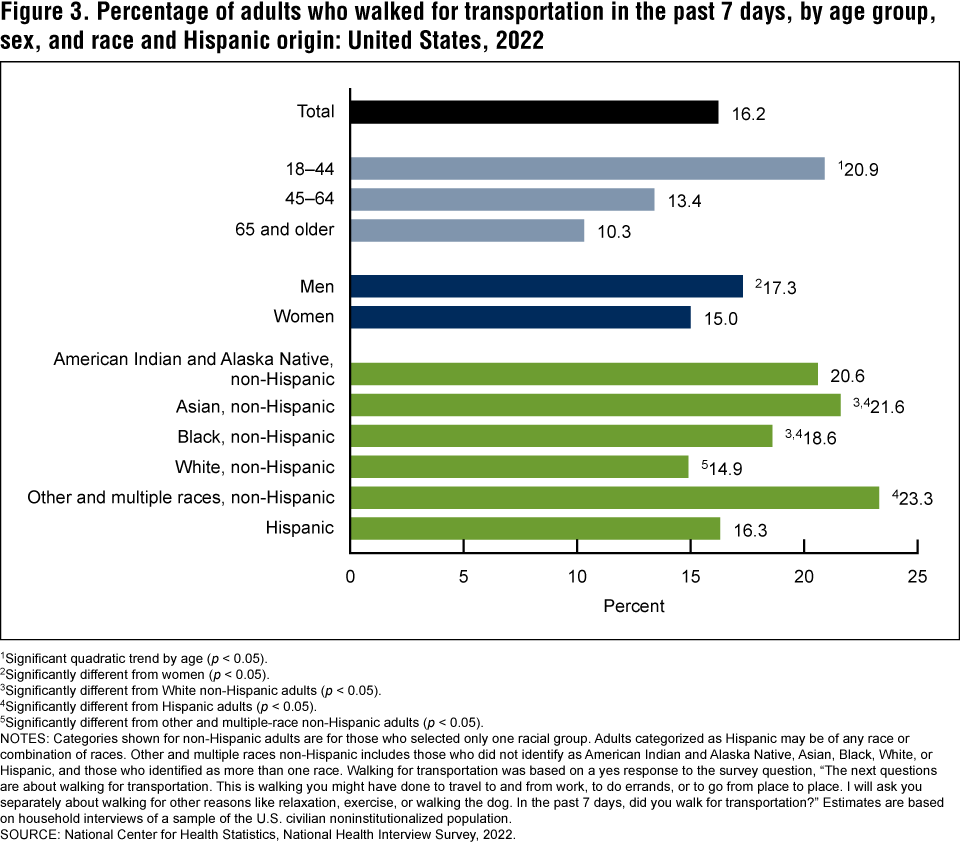
1Significant quadratic trend by age (p < 0.05).
2Significantly different from women (p < 0.05).
3Significantly different from White non-Hispanic adults (p < 0.05).
4Significantly different from Hispanic adults (p < 0.05).
5Significantly different from other and multiple-race non-Hispanic adults (p < 0.05).
NOTES: Categories shown for non-Hispanic adults are for those who selected only one racial group. Adults categorized as Hispanic may be of any race or combination of races. Other and multiple races non-Hispanic includes those who did not identify as American Indian and Alaska Native, Asian, Black, White, or Hispanic, and those who identified as more than one race. Walking for transportation was based on a yes response to the survey question, “The next questions are about walking for transportation. This is walking you might have done to travel to and from work, to do errands, or to go from place to place. I will ask you separately about walking for other reasons like relaxation, exercise, or walking the dog. In the past 7 days, did you walk for transportation?” Estimates are based on household interviews of a sample of the U.S. civilian noninstitutionalized population.
SOURCE: National Center for Health Statistics, National Health Interview Survey, 2022.
Were there differences in the percentage of adults who walked for transportation in the past 7 days by socioeconomic status?
In 2022, adults with family incomes below 100% FPL (24.1%) were most likely to walk for transportation, while adults with family incomes from 200% to 399% FPL were least likely to walk for transportation (12.6%), compared with all other family income categories (Figure 4, Table 4). Percentages of those who walked for transportation were similar for adults with family incomes of 100%–199% FPL (16.6%) and 400% FPL or greater (16.7%). The percentage of adults who walked for transportation was highest among those with a bachelor’s degree or higher (19.7%), and lowest among those with a high school diploma or GED (13.2%), compared with all other education levels. While the percentage of adults who walked for transportation who had less than a high school diploma or GED (16.6%) was higher than for those who had some college education (14.7%), this difference was not significant.
Figure 4. Percentage of adults who walked for transportation in the past 7 days, by family income and education: United States, 2022
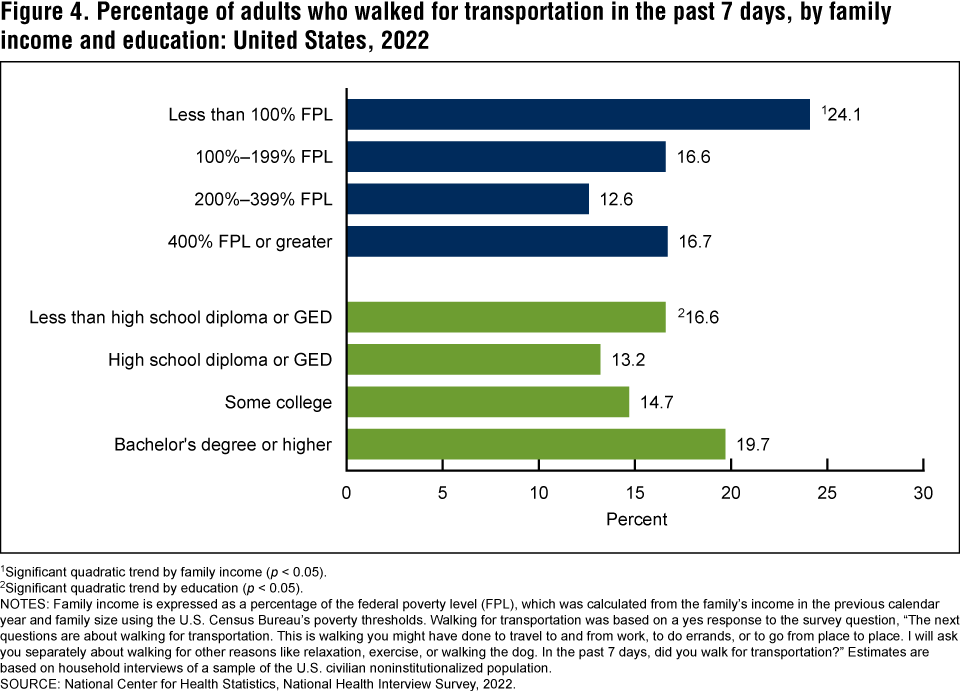
1Significant quadratic trend by family income (p < 0.05).
2Significant quadratic trend by education (p < 0.05).
5Significant linear trend by family income as a percentage of federal poverty level (p < 0.05).
NOTES: Family income is expressed as a percentage of the federal poverty level (FPL), which was calculated from the family’s income in the previous calendar year and family size using the U.S. Census Bureau’s poverty thresholds. Walking for transportation was based on a yes response to the survey question, “The next questions are about walking for transportation. This is walking you might have done to travel to and from work, to do errands, or to go from place to place. I will ask you separately about walking for other reasons like relaxation, exercise, or walking the dog. In the past 7 days, did you walk for transportation?” Estimates are based on household interviews of a sample of the U.S. civilian noninstitutionalized population.
SOURCE: National Center for Health Statistics, National Health Interview Survey, 2022.
Summary
In 2022, 58.7% of adults in the United States walked for leisure in the past 7 days, while 16.2% walked for transportation. Walking for leisure or transportation both decreased with increasing age. Compared with men, women were more likely to walk for leisure but less likely to walk for transportation. Racial and ethnic variations were also seen for walking behavior. Black adults had a lower likelihood of leisure walking than Asian, White, other and multiple-race, and Hispanic adults, while White and Hispanic adults were less likely to walk for transportation than other and multiple-race, Asian, and Black adults. Additionally, the percentage of adults who walked for leisure increased as levels of family income and education increased. Conversely, walking for transportation was highest for adults with the lowest family incomes and the highest levels of education, and lowest for adults with family incomes from 200% to 399% FPL and with a high school diploma or GED.
For many people, walking is considered a relatively easy and accessible physical activity for achieving health benefits (1). While wellness advantages do not discriminate between motivations for walking behavior (that is, for enjoyment or transportation), variations by sociodemographic characteristics illustrate that walking may serve specific purposes for different groups.
Definitions
Family income: Based on the federal poverty level, which was calculated from the family’s income in the previous calendar year and family size using the U.S. Census Bureau’s poverty thresholds (4). Family income was imputed when missing (5).
Race and Hispanic origin: Categories shown for non-Hispanic adults are for those who selected only one racial group. Adults categorized as Hispanic may be of any race or combination of races. The category other and multiple races non-Hispanic includes those who did not identify as American Indian and Alaska Native, Asian, Black, White, or Hispanic and those who identified as more than one race.
Walking for leisure: Based on a yes response to the survey question, “Sometimes you may walk for fun, relaxation, exercise, or to walk the dog. In the past 7 days, did you walk for any of these reasons?”
Walking for transportation: Based on a yes response to the survey question, “The next questions are about walking for transportation. This is walking you might have done to travel to and from work, to do errands, or to go from place to place. I will ask you separately about walking for other reasons like relaxation, exercise, or walking the dog. In the past 7 days, did you walk for transportation?”
Data source and methods
Data from the 2022 National Health Interview Survey were used for this analysis. The National Health Interview Survey is a nationally representative household survey of the U.S. civilian noninstitutionalized population. It is conducted continuously throughout the year by the National Center for Health Statistics. Interviews are typically conducted in respondents’ homes, but follow-ups to complete interviews may be conducted over the telephone. Because of the COVID-19 pandemic, interviewing procedures were disrupted, and during 2022, 55.7% of Sample Adult interviews were conducted at least partially by telephone (6). For more information about the survey, visit https://www.cdc.gov/nchs/nhis.htm.
Point estimates and corresponding confidence intervals for this analysis were calculated using SAS-callable SUDAAN software (7) to account for the complex sample design of the National Health Interview Survey. All estimates meet National Center for Health Statistics data presentation standards for proportions (8). Differences between percentages were evaluated using two-sided significance tests at the 0.05 level. Linear and quadratic trends by age group, family income, and education were evaluated using orthogonal polynomials.
About the authors
Dzifa Adjaye-Gbewonyo and Elizabeth M. Briones are with the National Center for Health Statistics, Division of Health Interview Statistics.
References
- Office of the Surgeon General. Step it up! The surgeon general’s call to action to promote walking and walkable communities. Washington, DC: U.S. Department of Health and Human Services. 2015
- Kruger J, Ham SA, Berrigan D, Ballard-Barbash R. Prevalence of transportation and leisure walking among U.S. adults. Prev Med 47(3):329–34. 2008.
- Ussery EN, Carlson SA, Whitfield GP, Watson KB, Berrigan D, Fulton JE. Transportation and leisure walking among U.S. adults: Trends in reported prevalence and volume, National Health Interview Survey 2005–2015. Am J Prev Med 55(4):533–40. 2018
- U.S. Census Bureau. Poverty thresholds. 2023.
- National Center for Health Statistics. Multiple imputation of family income in 2022 National Health Interview Survey: Methods. 2023.
- National Center for Health Statistics. National Health Interview Survey: 2022 survey description. 2023.
- RTI International. SUDAAN (Release 11.0.3) [computer software]. 2018.
- Parker JD, Talih M, Malec DJ, Beresovsky V, Carroll M, Gonzalez JF Jr, et al. National Center for Health Statistics data presentation standards for proportions. National Center for Health Statistics. Vital Health Stat 2(175). 2017.
Suggested citation
Adjaye-Gbewonyo D, Briones EM. Walking for leisure and transportation among adults: United States, 2022. NCHS Data Brief, no 504. Hyattsville, MD: National Center for Health Statistics. 2024. DOI: https://dx.doi.org/10.15620/cdc/158783.
Copyright information
All material appearing in this report is in the public domain and may be reproduced or copied without permission; citation as to source, however, is appreciated.
National Center for Health Statistics
Brian C. Moyer, Ph.D., Director
Amy M. Branum, Ph.D., Associate Director for Science
Division of Health Interview Statistics
Stephen J. Blumberg, Ph.D., Director
Anjel Vahratian, Ph.D., M.P.H., Associate Director for Science