Yoga Among Adults Age 18 and Older: United States, 2022
NCHS Data Brief No. 501, June 2024
PDF Version (536 KB)
Nazik Elgaddal, M.S., and Julie D. Weeks, Ph.D.
- Key findings
- The percentage of adults who practiced yoga varied by sex, age, race and Hispanic origin, and family income.
- Among adults who practiced yoga, the percentage who practiced it to restore overall health varied by age and race and Hispanic origin, but not by sex or family income.
- Of those who practiced yoga, incorporating meditation as part of yoga varied by sex, age, race and Hispanic origin, and family income.
- The use of yoga to treat or manage pain among adults who practiced yoga varied by sex, age, race and Hispanic origin, and family income.
- Summary
Data from the National Health Interview Survey
- In 2022, the age-adjusted percentage of adults age 18 and older who practiced yoga in the past 12 months was 16.9%, and percentages were highest among women, adults ages 18–44, Asian non-Hispanic (subsequently, Asian) adults, and those with family incomes at 400% of the federal poverty level or more.
- Among adults who practiced yoga, those ages 45–64 were more likely to practice yoga to restore overall health than age groups 18–44 and 65 and older.
- The percentage of adults who practiced meditation as part of yoga was lower among men (52.9%), adults age 45 and older, Asian (56.7%) and White non-Hispanic (54.0%) adults, and those with family incomes at 200% of the federal poverty level or more.
- The percentage of adults who practiced yoga to treat or manage pain decreased with increasing family income.
Yoga is a complementary health approach used to promote physical and mental well-being (1). The popularity of complementary health approaches has increased in the past 20 years, with the largest increases in the practice of yoga (2). Practicing yoga can enhance quality of life and help improve mental health outcomes (1). It is also an approach for pain management (2–4). This report uses data from the 2022 National Health Interview Survey (NHIS) to describe the percentage of adults age 18 and older who practiced yoga, and among those, the percentage who practiced yoga to restore overall health, for meditation, and to treat and manage pain, by selected sociodemographic characteristics.
Keywords: complementary health, integrative health, well-being, pain management, National Health Interview Survey
The percentage of adults who practiced yoga varied by sex, age, race and Hispanic origin, and family income.
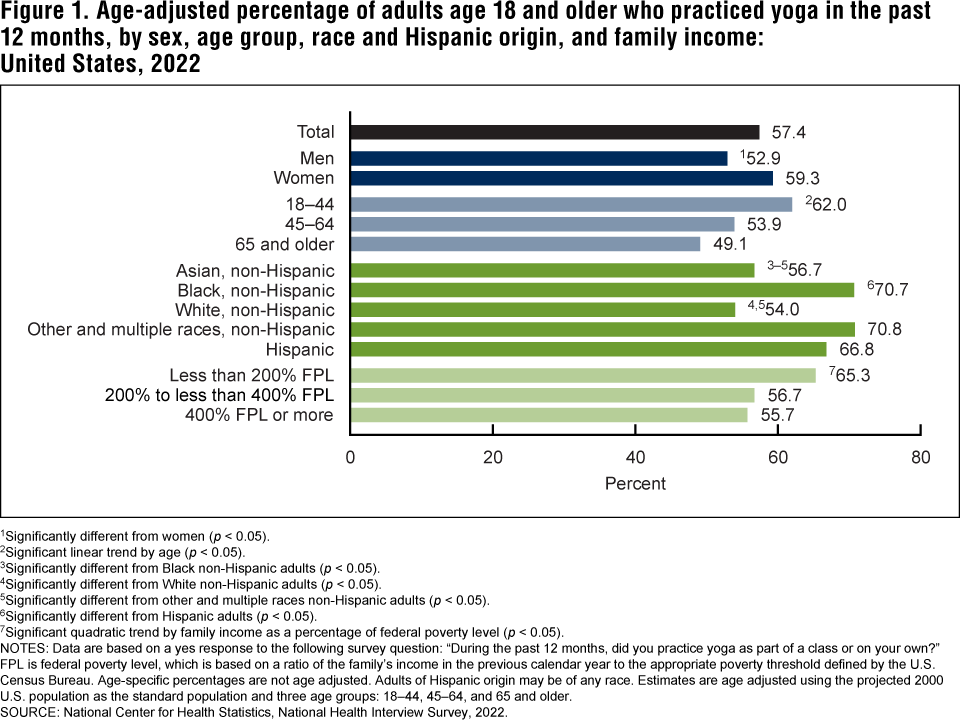
- In 2022, the age-adjusted percentage of adults who practiced yoga was 16.9%, with women (23.3%) more than twice as likely as men (10.3%) to practice yoga (Figure 1, Table 1).
- The percentage of adults who practiced yoga decreased with increasing age, from 21.3% of adults ages 18–44 to 8.0% of those age 65 and older.
- Asian non-Hispanic (subsequently, Asian) adults (22.5%) were more likely to practice yoga than White non-Hispanic (subsequently, White) (19.3%), other and multiple races non-Hispanic (subsequently, other and multiple races) (15.7%), Black non-Hispanic (subsequently, Black) (12.6%), and Hispanic (10.5%) adults.
- The percentage of adults who practiced yoga increased with increasing family income, from 10.4% among adults with family incomes less than 200% of the federal poverty level (FPL) to 23.0% among adults with family incomes at 400% FPL or more.
Figure 1. Age-adjusted percentage of adults age 18 and older who practiced yoga in the past 12 months, by sex, age group, race and Hispanic origin, and family income: United States, 2022
1Significantly different from women (p < 0.05).
2Significant linear trend by age (p < 0.05).
3Significantly different from Black non-Hispanic adults (p < 0.05).
4Significantly different from White non-Hispanic adults (p < 0.05).
5Significantly different from other and multiple races non-Hispanic adults (p < 0.05).
6Significantly different from Hispanic adults (p < 0.05).
7Significant quadratic trend by family income as a percentage of federal poverty level (p < 0.05).
NOTES: Data are based on a yes response to the following survey question: “During the past 12 months, did you practice yoga as part of a class or on your own?” FPL is federal poverty level, which is based on a ratio of the family’s income in the previous calendar year to the appropriate poverty threshold defined by the U.S. Census Bureau. Age-specific percentages are not age adjusted. Adults of Hispanic origin may be of any race. Estimates are age adjusted using the projected 2000 U.S. population as the standard population and three age groups: 18–44, 45–64, and 65 and older.
SOURCE: National Center for Health Statistics, National Health Interview Survey, 2022.
Among adults who practiced yoga, the percentage who practiced it to restore overall health varied by age and race and Hispanic origin, but not by sex or family income.
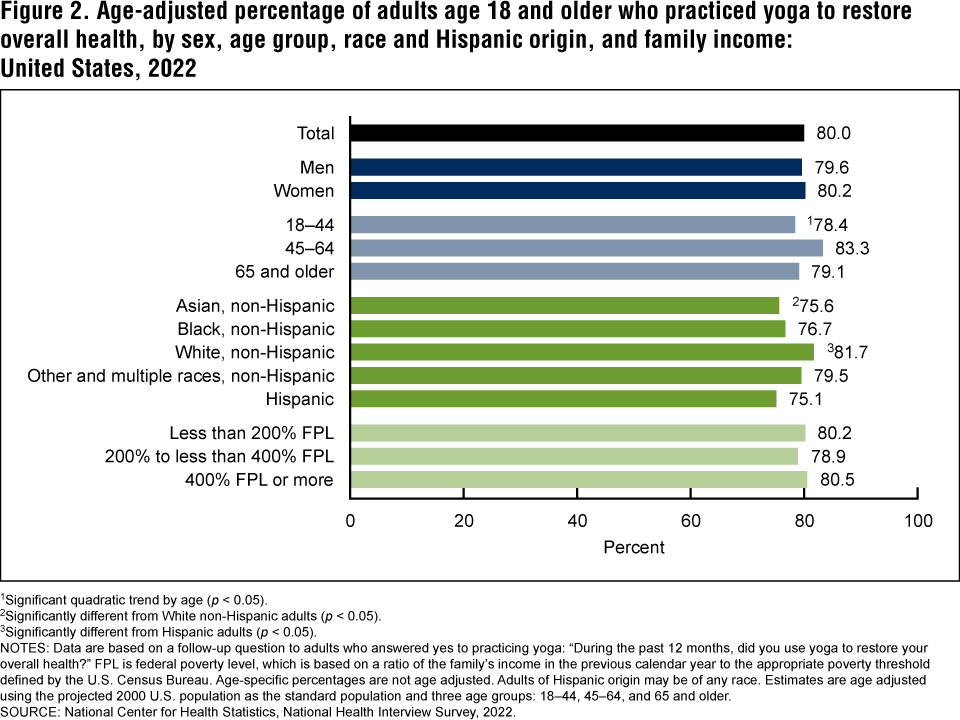
- In 2022, of those who practiced yoga, the age-adjusted percentage of adults who practiced yoga to restore overall health was 80.0%, with no significant difference observed between men and women (Figure 2, Table 2).
- Adults ages 45–64 (83.3%) were more likely than adults ages 18–44 (78.4%) or those age 65 and older (79.1%) to practice yoga for overall health.
- White adults (81.7%) were more likely than Asian (75.6%) or Hispanic (75.1%) adults to practice yoga to restore overall health, but no significant differences were seen compared with Black (76.7%) and other and multiple races (79.5%) adults.
Figure 2. Age-adjusted percentage of adults age 18 and older who practiced yoga to restore overall health, by sex, age group, race and Hispanic origin, and family income: United States, 2022
1Significant quadratic trend by age (p < 0.05).
2Significantly different from White non-Hispanic adults (p < 0.05).
3Significantly different from Hispanic adults (p < 0.05).
NOTES: Data are based on a follow-up question to adults who answered yes to practicing yoga: “During the past 12 months, did you use yoga to restore your overall health?” FPL is federal poverty level, which is based on a ratio of the family’s income in the previous calendar year to the appropriate poverty threshold defined by the U.S. Census Bureau. Age-specific percentages are not age adjusted. Adults of Hispanic origin may be of any race. Estimates are age adjusted using the projected 2000 U.S. population as the standard population and three age groups: 18–44, 45–64, and 65 and older.
SOURCE: National Center for Health Statistics, National Health Interview Survey, 2022.
Of those who practiced yoga, incorporating meditation as part of yoga varied by sex, age, race and Hispanic origin, and family income.
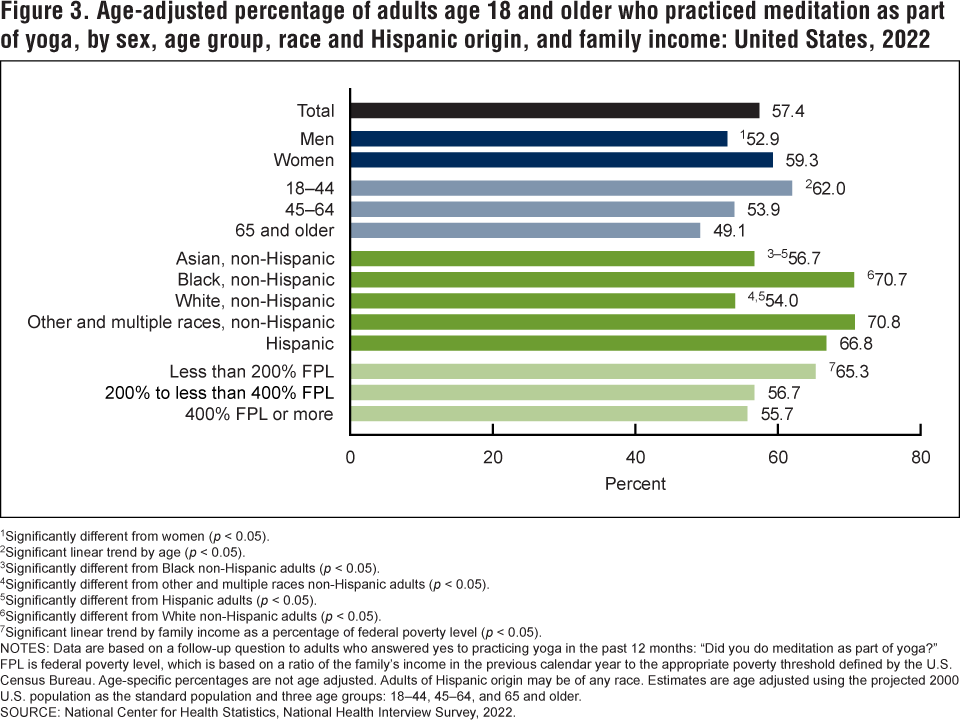
- In 2022, among those who practiced yoga, the age-adjusted percentage of adults who practiced meditation as part of yoga was 57.4% (Figure 3, Table 3).
- Women (59.3%) were more likely than men (52.9%) to practice meditation as part of yoga.
- The percentage of adults practicing meditation as part of yoga decreased with age, from 62.0% for adults ages 18–44 to 49.1% for adults age 65 and older.
- Asian (56.7%) and White (54.0%) adults were less likely than other and multiple races (70.8%), Black (70.7%), and Hispanic (66.8%) adults to practice meditation as part of yoga.
- The percentage of adults who practiced meditation as part of yoga was higher among those with family incomes less than 200% FPL (65.3%) compared with adults with family incomes 200% to less than 400% FPL (56.7%) and adults with family incomes at 400% FPL or more (55.7%).
Figure 3. Age-adjusted percentage of adults age 18 and older who practiced meditation as part of yoga, by sex, age group, race and Hispanic origin, and family income: United States, 2022
1Significantly different from women (p < 0.05).
2Significant linear trend by age (p < 0.05).
3Significantly different from Black non-Hispanic adults (p < 0.05).
4Significantly different from other and multiple races non-Hispanic adults (p < 0.05).
5Significantly different from Hispanic adults (p < 0.05).
6Significantly different from White non-Hispanic adults (p < 0.05).
7Significant linear trend by family income as a percentage of federal poverty level (p < 0.05).
NOTES: Data are based on a follow-up question to adults who answered yes to practicing yoga in the past 12 months: “Did you do meditation as part of yoga?” FPL is federal poverty level, which is based on a ratio of the family’s income in the previous calendar year to the appropriate poverty threshold defined by the U.S. Census Bureau. Age-specific percentages are not age adjusted. Adults of Hispanic origin may be of any race. Estimates are age adjusted using the projected 2000 U.S. population as the standard population and three age groups: 18–44, 45–64, and 65 and older.
SOURCE: National Center for Health Statistics, National Health Interview Survey, 2022.
The use of yoga to treat or manage pain among adults who practiced yoga varied by sex, age, race and Hispanic origin, and family income.
- Among those who practiced yoga in 2022, the age-adjusted percentage of adults who practiced yoga to treat or manage pain was 28.8% (Figure 4, Table 4).
- Men (31.8%) were more likely than women (27.5%) to practice yoga to treat or manage pain.
- Adults ages 45–64 (31.5%) were more likely than adults ages 18–44 (27.9%) or those age 65 and older (27.2%) to practice yoga to treat or manage pain.
- Asian adults (21.1%) were less likely than White (30.0%) or Hispanic (31.9%) adults to practice yoga to treat or manage pain, but observed differences compared with Black (26.0%) and other and multiple races (25.0%) adults were not significant.
- The percentage of adults who practiced yoga to treat or manage pain decreased with increasing family income, from 37.8% among adults with family incomes less than 200% FPL to 25.4% among those with family incomes at 400% FPL or more.
Figure 4. Age-adjusted percentage of adults age 18 and older who practiced yoga to treat or manage pain, by sex, age group, race and Hispanic origin, and family income: United States, 2022

1Significantly different from women (p < 0.05).
2Significant quadratic trend by age (p < 0.05).
3Significantly different from White non-Hispanic adults (p < 0.05).
4Significantly different from Hispanic adults (p < 0.05).
5Significant linear trend by family income as a percentage of federal poverty level (p < 0.05).
NOTES: Data are based on a follow-up question to adults who answered yes to practicing yoga: “During the past 12 months, did you use yoga to treat or manage physical pain?” FPL is federal poverty level, which is based on a ratio of the family’s income in the previous calendar year to the appropriate poverty threshold defined by the U.S. Census Bureau. Age-specific percentages are not age adjusted. Adults of Hispanic origin may be of any race. Estimates are age adjusted using the projected 2000 U.S. population as the standard population and three age groups: 18–44, 45–64, and 65 and older.
SOURCE: National Center for Health Statistics, National Health Interview Survey, 2022.
Summary
This report describes national estimates for adults age 18 and older who practiced yoga, and among those, adults who practiced yoga to restore overall health, for meditation as part of yoga, or to treat or manage pain. The estimates are reported by sex, age, race and Hispanic origin, and family income using data from NHIS. In 2022, the age-adjusted percentage of adults who practiced yoga was 16.9%. Of these adults, 80.0% practiced yoga to restore overall health, 57.4% practiced meditation as part of yoga, and 28.8% practiced yoga to treat or manage pain. Adults ages 18–44, women, and adults with family incomes at 400% FPL or more were most likely to practice yoga. Asian and White adults were more likely than adults of other racial and ethnic groups to practice yoga. Research suggests that yoga may lead to improved physical fitness and mental well-being (1).
Definitions
Family income as a percentage of federal poverty level: Estimates are based on the federal poverty level, which is calculated from family income and family size using the U.S. Census Bureau’s poverty thresholds for the previous calendar year (5). The 2022 NHIS imputed income files were used to create the poverty levels (6).
Race and Hispanic origin: Adults categorized as Hispanic may be of any race or combination of races. Adults categorized as Asian, Black, or White indicated one race only. Other and multiple races include those who did not identify as White, Black, Asian, or Hispanic, or who identified as more than one race.
Yoga: Based on a yes response to the question, “During the past 12 months, did you practice yoga as part of a class or on your own?” Respondents who answered yes were asked follow-up questions on whether they had practiced yoga to restore their overall health (“During the past 12 months, did you use yoga to restore your overall health?”); if their yoga practice included meditation (“Did you do meditation as part of yoga?”), or if they practiced yoga to treat or manage physical pain (“During the past 12 months, did you use yoga to treat or manage physical pain?”).
Data source and methods
Data from the 2022 NHIS were used for this analysis. NHIS is a nationally representative household survey of the civilian noninstitutionalized U.S. population. It is conducted continuously throughout the year by the National Center for Health Statistics. Interviews are conducted in respondents’ homes, but follow-ups to complete interviews may be conducted over the telephone. In 2022, 55.7% of the Sample Adult interviews were conducted at least partially by telephone (7). For more information about NHIS, visit: https://www.cdc.gov/nchs/nhis.htm.
Point estimates and corresponding variances for this analysis were calculated using SAS-callable SUDAAN software version 11.0 (8) to account for the complex sample design of NHIS. All estimates are based on self-reporting and meet NCHS data presentation standards for proportions (9). Differences between percentages were evaluated using two-sided significance tests at the 0.05 level. Linear and quadratic trends by age group and family income were evaluated using orthogonal polynomials in logistic regression. Estimates were age adjusted to the 2000 U.S. census population using the direct method for age groups 18–44, 45–64, and 65 and older (10).
About the authors
Nazik Elgaddal and Julie D. Weeks are with the National Center for Health Statistics, Division of Analysis and Epidemiology.
References
- National Center for Complementary and Integrative Health. Yoga: What you need to know. 2023.
- Nahin RL, Rhee A, Stussman B. Use of complementary health approaches overall and for pain management by US adults. JAMA 331(7):613–5. 2024. DOI: https://dx.doi.org/10.1001/jama.2023.26775.
- U.S. Department of Health and Human Services. Pain management best practices inter-agency task force report: Updates, gaps, inconsistencies, and recommendations. 2019.
- National Center for Complementary and Integrative Health. Use of complementary health approaches for pain by U.S. adults increased from 2002 to 2022. 2024.
- U.S. Census Bureau. Poverty thresholds. 2023.
- National Center for Health Statistics. Multiple imputation of family income in 2021 National Health Interview Survey: Methods. 2022.
- National Center for Health Statistics. National Health Interview Survey: 2022 survey description. 2023.
- RTI International. SUDAAN (Release 11.0.3) [computer software]. 2018.
- Parker JD, Talih M, Malec DJ, Beresovsky V, Carroll M, Gonzalez JF Jr, et al. National Center for Health Statistics data presentation standards for proportions. National Center for Health Statistics. Vital Health Stat 2(175). 2017.
- Klein RJ, Schoenborn CA. Age adjustment using the 2000 projected U.S. population. Healthy People 2010 Statistical Notes, no 20. Hyattsville, MD: National Center for Health Statistics. 2001.
Suggested citation
Elgaddal N, Weeks JD. Yoga among adults age 18 and older: United States, 2022. NCHS Data Brief, no 501. Hyattsville, MD: National Center for Health Statistics. 2024. DOI: https://dx.doi.org/10.15620/cdc/156474.
Copyright information
All material appearing in this report is in the public domain and may be reproduced or copied without permission; citation as to source, however, is appreciated.
National Center for Health Statistics
Brian C. Moyer, Ph.D., Director
Amy M. Branum, Ph.D., Associate Director for Science
Division of Analysis and Epidemiology
Irma E. Arispe, Ph.D., Director
Kimberly A. Lochner, Sc.D., Associate Director for Science