Dental Care Among Adults Age 65 and Older: United States, 2022
NCHS Data Brief No. 500, April 2024
PDF Version (486 KB)
Robin A. Cohen, Ph.D., and Lauren Bottoms-McClain, M.P.H.
- Key findings
- Among adults age 65 and older, dental visits in the past 12 months varied by sex, age group, and race and Hispanic origin.
- Among adults age 65 and older, dental visits increased with increasing family income and increasing education level.
- Dental visits among adults age 65 and older were higher among those with dental coverage.
- The percentage of adults age 65 and older who had a dental visit was lower among those in fair or poor health and those with diabetes or heart disease.
- Summary
Data from the National Health Interview Survey
- In 2022, 63.7% of adults age 65 and older had a dental visit in the past 12 months, and women (64.9%) were more likely than men (62.3%) to have had a dental visit.
- Among older adults, dental visits generally increased with increasing family income.
- Dental visits were higher among older adults with dental coverage (69.6%) compared with those without dental coverage (56.4%).
- Adults in fair or poor health and those with diabetes or heart disease were less likely to have had a dental visit compared with those without these conditions.
Oral health is associated with overall health, especially in older adults (age 65 and older). Chronic conditions in older adults may affect oral health, and poor oral health may increase the risk of certain chronic conditions (1–3). Poor oral health has also been associated with increased cardiovascular disease risk (4). Several factors, including chronic conditions, health status, race, and income have been associated with reduced dental care use among older adults (5–9). This report describes the percentage of older adults who had a dental visit in the past 12 months by selected sociodemographic characteristics and chronic conditions using the 2022 National Health Interview Survey (NHIS).
Keywords: oral health, chronic conditions, National Health Interview Survey
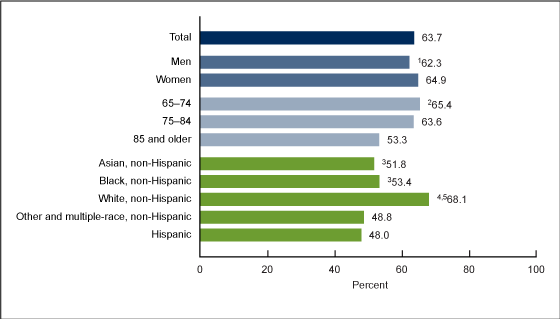
Among adults age 65 and older, dental visits in the past 12 months varied by sex, age group, and race and Hispanic origin.
- In 2022, 63.7% of adults age 65 and older had a dental visit in the past 12 months (Figure 1, Table 1).
- Men (62.3%) were less likely than women (64.9%) to have had a dental visit.
- The percentage of older adults who had a dental visit decreased from 65.4% among those ages 65–74 and 63.6% among those ages 75–84 to 53.3% among those age 85 and older.
- The percentage of older adults who had a dental visit was highest among White non-Hispanic (subsequently, White) adults (68.1%) compared with Asian non-Hispanic (subsequently, Asian) adults (51.8%), Black non-Hispanic (subsequently, Black) adults (53.4%), other and multiple-race non-Hispanic (subsequently, other and multiple race) adults (48.8%), and Hispanic adults (48.0%). No other significant differences by race and ethnicity.
Figure 1. Percentage of adults age 65 and older who had a dental visit in the past 12 months, by sex, age group, and race and Hispanic origin: United States, 2022

1Significantly different from women (p < 0.05).
2Significant quadratic trend with age (p < 0.05).
3Significantly different from White non-Hispanic adults (p < 0.05).
4Significantly different from Other and multiple-race non-Hispanic adults (p < 0.05).
5Significantly different from Hispanic adults (p < 0.05).
NOTES: People of Hispanic origin may be of any race. Adults categorized as Asian non-Hispanic, Black non-Hispanic, or White non-Hispanic indicated one race only. Estimates are based on responses to the question, “About how long has it been since you last had a dental examination or cleaning?” A response of “within the past year (anytime less than 12 months ago)” was considered as having a dental visit in the past 12 months. Estimates are based on household interviews of a sample of the U.S. civilian noninstitutionalized population.
SOURCE: National Center for Health Statistics, National Health Interview Survey, 2022.
Data table for Figure 1. Percentage of adults age 65 and older who had a dental visit in the past 12 months, by sex, age group, and race and Hispanic origin: United States, 2022
| Characteristic | Percent (95% confidence interval) | Standard error |
|---|---|---|
| Total | 63.7 (62.4–65.1) | 0.68 |
| Sex | ||
| Men | 62.3 (60.5–64.2) | 0.94 |
| Women | 64.9 (63.1–66.6) | 0.88 |
| Age | ||
| 65–74 | 65.4 (63.7–67.1) | 0.86 |
| 75–84 | 63.6 (61.4–65.7) | 1.08 |
| 85 and older | 53.3 (49.2–57.3) | 2.02 |
| Race and Hispanic origin | ||
| Asian, non-Hispanic | 51.8 (44.9–58.7) | 3.43 |
| Black, non-Hispanic | 53.4 (49.2–57.5) | 2.06 |
| White, non-Hispanic | 68.1 (66.7–69.4) | 0.70 |
| Other and multiple races, non-Hispanic | 48.8 (37.8–59.8) | 5.39 |
| Hispanic1 | 48.0 (43.3–52.8) | 2.38 |
1People of Hispanic origin may be of any race.
NOTES: Estimates are based on responses to the question, “About how long has it been since you last had a dental examination or cleaning?” A response of “within the past year (anytime less than 12 months ago)” was considered as having a dental visit in the past 12 months. Estimates are based on household interviews of a sample of the U.S. civilian noninstitutionalized population. Adults categorized as Asian non-Hispanic, Black non-Hispanic, or White non-Hispanic indicated one race only.
SOURCE: National Center for Health Statistics, National Health Interview Survey, 2022.
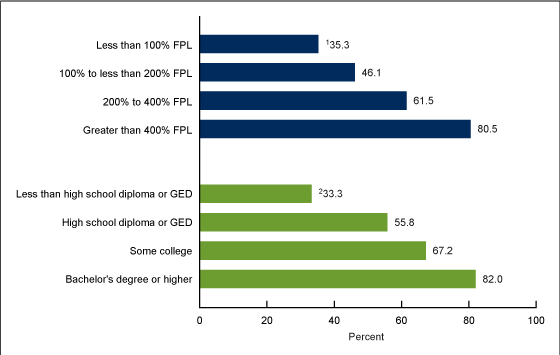
Among adults age 65 and older, dental visits increased with increasing family income and increasing education level.
- In 2022, the percentage of adults age 65 and older who had a dental visit in the past 12 months generally increased with increasing income as a percentage of the federal poverty level (FPL), ranging from 35.3% among those with incomes less than 100% FPL to 80.5% among those with incomes greater than 400% FPL (Figure 2, Table 2).
- The percentage of older adults who had a dental visit increased with increasing education level, from 33.3% among those with less than a high school diploma to 82.0% among those with a bachelor’s degree or higher.
Figure 2. Percentage of adults age 65 and older who had a dental visit in the past 12 months, by family income level and education level: United States, 2022

1Significant quadratic trend with family income (p < 0.05).
2Significant linear increase with increasing education level (p < 0.05).
NOTES: Family income is based on a percentage of the federal poverty level (FPL). Estimates are based on responses to the question, “About how long has it been since you last had a dental examination or cleaning?” A response of “within the past year (anytime less than 12 months ago)” was considered as having a dental visit in the past 12 months. Estimates are based on household interviews of a sample of the U.S. civilian noninstitutionalized population.
SOURCE: National Center for Health Statistics, National Health Interview Survey, 2022.
Data table for Figure 2. Percentage of adults age 65 and older who had a dental visit in the past 12 months, by family income level and education level: United States, 2022
| Characteristic | Percent (95% confidence interval) | Standard error |
|---|---|---|
| Family income | ||
| Less than 100% FPL | 35.3 (31.0–39.8) | 2.20 |
| 100% to less than 200% FPL | 46.1 (43.1–49.0) | 1.49 |
| 200% to 400% FPL | 61.5 (59.1–63.8) | 1.17 |
| Greater than 400% FPL | 80.5 (78.8–82.1) | 0.88 |
| Education level | ||
| Less than high school diploma or GED | 33.3 (29.7–37.0) | 1.83 |
| High school diploma or GED | 55.8 (53.4–58.1) | 1.21 |
| Some college | 67.2 (65.0–69.4) | 1.10 |
| Bachelor’s degree or higher | 82.0 (80.3–83.5) | 0.81 |
NOTES: Family income is based on a percentage of the federal poverty level (FPL). Estimates are based on responses to the question, “About how long has it
been since you last had a dental examination or cleaning?” A response of “within the past year (anytime less than 12 months ago)” was considered as having a
dental visit in the past 12 months. Estimates are based on household interviews of a sample of the U.S. civilian noninstitutionalized population.
SOURCE: National Center for Health Statistics, National Health Interview Survey, 2022.
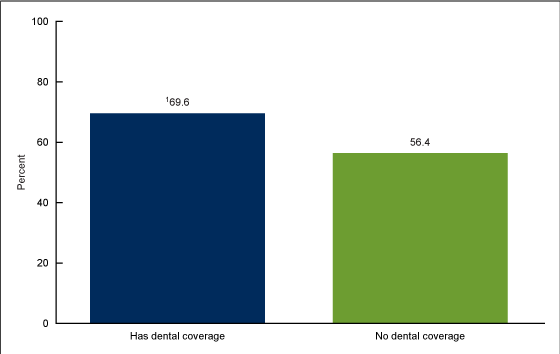
Dental visits among adults age 65 and older were higher among those with dental coverage.
- In 2022, among adults age 65 and older, those with dental coverage were more likely to have had a dental visit in the past 12 months (69.6%) compared with those without dental coverage (56.4%) (Figure 3, Table 3).
Figure 3. Percentage of adults age 65 and older who had a dental visit in the past 12 months, by dental coverage status: United States, 2022

1Significantly different from adults who have no dental coverage (p < 0.05).
NOTES: Estimates are based on responses to the question, “About how long has it been since you last had a dental examination or cleaning?” A response of ”within the past year (anytime less than 12 months ago)” was considered as having a dental visit in the past 12 months. Estimates are based on household interviews of a sample of the U.S. civilian noninstitutionalized population.
SOURCE: National Center for Health Statistics, National Health Interview Survey, 2022.
Data table for Figure 3. Percentage of adults age 65 and older who had a dental visit in the past 12 months, by dental coverage status: United States, 2022
| Dental coverage status | Percent (95% confidence interval) | Standard error |
|---|---|---|
| Has dental coverage | 69.6 (67.9–71.3) | 0.85 |
| No dental coverage | 56.4 (54.5–58.3) | 0.97 |
NOTES: Estimates are based on responses to the question, “About how long has it been since you last had a dental examination or cleaning?” A response of “within the past year (anytime less than 12 months ago)” was considered as having a dental visit in the past 12 months. Estimates are based on household interviews of a sample of the U.S. civilian noninstitutionalized population.
SOURCE: National Center for Health Statistics, National Health Interview Survey, 2022.
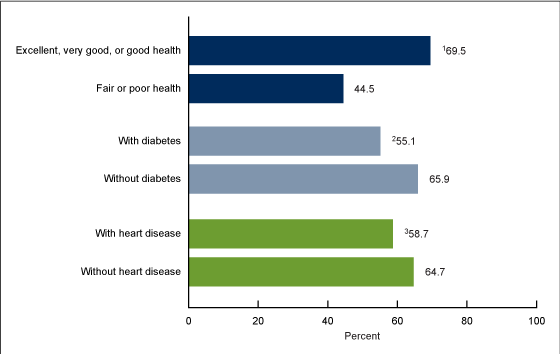
The percentage of adults age 65 and older who had a dental visit was lower among those in fair or poor health and those with diabetes or heart disease.
- In 2022, adults age 65 and older with fair or poor health (44.5%) were less likely than those in excellent, very good, or good health (69.5%) to have had a dental visit in the past 12 months (Figure 4, Table 4).
- Older adults with diabetes (55.1%) were less likely than those without diabetes (65.9%) to have had a dental visit.
- Older adults with heart disease (58.7%) were less likely than those without heart disease (64.7%) to have had a dental visit.
Figure 4. Percentage of adults age 65 and older who had a dental visit in the past 12 months, by selected health factors: United States, 2022

1Significantly different from adults in fair or poor health (p < 0.05).
2Significantly different from adults without diabetes (p < 0.05).
3Significantly different from adults without heart disease (p < 0.05).
NOTES: Estimates are based on responses to the question, “About how long has it been since you last had a dental examination or cleaning?” A response of “within the past year (anytime less than 12 months ago)” was considered as having a dental visit in the past 12 months. Estimates are based on household interviews of a sample of the U.S. civilian noninstitutionalized population.
SOURCE: National Center for Health Statistics, National Health Interview Survey, 2022.
Data table for Figure 4. Percentage of adults age 65 and older who had a dental visit in the past 12 months, by selected health factors: United States, 2022
| Characteristic | Percent (95% confidence interval) | Standard error |
|---|---|---|
| Health status | ||
| Excellent, very good, or good health | 69.5 (68.2–70.8) | 0.67 |
| Fair or poor health | 44.5 (41.8–47.3) | 1.39 |
| Diabetes status | ||
| With diabetes | 55.1 (52.1–58.1) | 1.50 |
| Without diabetes | 65.9 (64.4–67.3) | 0.73 |
| Heart disease status | ||
| With heart disease | 58.7 (55.4–61.9) | 1.61 |
| Without heart disease | 64.7 (63.3–66.1) | 0.72 |
NOTES: Estimates are based on responses to the question, “About how long has it been since you last had a dental examination or cleaning?” A response of “within the past year (anytime less than 12 months ago)” was considered as having had a dental visit in the past 12 months. Estimates are based on household interviews of a sample of the U.S. civilian noninstitutionalized population.
SOURCE: National Center for Health Statistics, National Health Interview Survey, 2022.
Summary
In 2022, 63.7% of U.S. adults age 65 and older had a dental visit in the past 12 months. Women, White adults, and adults ages 65–74 and 75–84 were more likely to have had a dental visit than their counterparts. Dental visits increased with increasing family income and education level. Also, older adults with dental coverage were more likely to have had a dental visit than those without dental coverage. Older adults with diabetes, heart disease, or those in fair or poor health were less likely to have had a dental visit than their counterparts. A previous report on dental care among older adults using the 2017 NHIS showed similar percentages of dental care use between men and women and decreasing visits with increasing age (10). However, it is important to note that NHIS was resigned in 2019 and the question wording for dental care was slightly changed, so estimates from NHIS data before 2019 may not be consistent with those from 2019 and later (10,11).
Definitions
Dental visit in the past 12 months: Estimates are based on responses to the question, “About how long has it been since you last had a dental examination or cleaning?” A response of “within the past year (anytime less than 12 months ago)” was considered as having had a dental visit in the past 12 months. NHIS did not collect data on edentulism (toothlessness) in 2022, so older adults who do not have teeth are included in this measure.
Dental coverage: Adults were considered to have dental coverage if, at the time of interview, they had coverage through either a single-service plan, a private health insurance plan, or a Medicare Advantage plan. Adults covered by Medicaid living in a state where Medicaid provides comprehensive dental coverage were also considered to have dental coverage.
Family income as a percentage of the federal poverty level: Calculated from the family’s income in the previous calendar year and family size using the U.S. Census Bureau’s poverty thresholds (12). The 2022 NHIS imputed income file was used to create the poverty levels (13).
Race and Hispanic origin: Adults categorized as Hispanic may be any race or combination of races. Adults categorized as non-Hispanic Asian, non-Hispanic Black, or non-Hispanic White indicated one race only. Other and multiple races includes those who did not identify as Asian, Black, Hispanic, or White or who identified as more than one race. Analyses were limited to the race and Hispanic-origin groups for which data were reliable and had a large enough sample to make group comparisons.
Data source and methods
This analysis was based on the 2022 NHIS. Estimates were based on a sample of 14,020 adults age 65 and older. NHIS is a nationally representative household survey of the U.S. civilian noninstitutionalized population. It is conducted continuously throughout the year by the National Center for Health Statistics. Interviews are typically conducted in respondents’ homes, but follow-ups to complete interviews may be conducted over the telephone. Because of the COVID-19 pandemic, interviewing procedures were disrupted, and 55.7% of the 2022 Sample Adult interviews were conducted at least partially by telephone (14). For more information about the NHIS, visit: https://www.cdc.gov/nchs/nhis.htm.
Point estimates and their corresponding variances were calculated using SAS-callable SUDAAN software (15) to account for the complex sample design of NHIS. Differences between percentages were evaluated using two-sided significance t tests at the 0.05 level. Test for trends were evaluated using logistic regression. All estimates in this report met National Center for Health Statistics standards of reliability (16).
About the authors
Robin A. Cohen and Lauren Bottoms-McClain are with the National Center for Health Statistics, Division of Health Interview Statistics.
References
- Leung KC, Chu CH. Dental care for older adults. Int J Environ Res Public Health 20(1):214. 2022.
- Singhal A, Alofi A, Garcia RI, Sabik LM. Medicaid adult dental benefits and oral health of low-income older adults. J Am Dent Assoc 152(7):551–9.
- Coll PP, Lindsay A, Meng J, Gopalakrishna A, Raghavendra S, Bysani P, O’Brien D. The prevention of infections in older adults: Oral health. J Am Geriatr Soc 68(2):411–6. 2020.
- Van Dyke TE, Kholy KE, Ishai A, Takx RAP, Mezue K, Abohashem SM, et al. Inflammation of the periodontium associates with risk of future cardiovascular events. J Periodontol 92(3):348–58.
- Badr F, Sabbah W. Inequalities in untreated root caries and affordability of dental services among older American adults. Int J Environ Res Public Health 17(22):8523. 2020.
- Deraz O, Rangé H, Boutouyrie P, Chatzopoulou E, Asselin A, Guibout C, et al. Oral condition and incident coronary heart disease: A clustering analysis. J Dent Res 101(5):526–33. 2022.
- Borrell LN, Reynolds JC, Fleming E, Shah PD. Access to dental insurance and oral health inequities in the United States. Community Dent Oral Epidemiol 51(4):615–20. 2023.
- Sahab L, Sabbah W. Is the inability to afford dental care associated with untreated dental caries in adults? Community Dent Health 39(2):113–7. 2022.
- Vu GT, Little BB, Esterhay RJ, Jennings JA, Creel L, Gettleman L. Oral health-related quality of life in US adults with type 2 diabetes. J Public Health Dent 82(1):79–87. 2022.
- Kramarow EA. Dental care among adults aged 65 and over, 2017. NCHS Data Brief, no 337. Hyattsville, MD: National Center for Health Statistics. 2019.
- National Center for Health Statistics. National Health Interview Survey: 2019 survey description. 2020.
- U.S. Census Bureau. Poverty thresholds.
- National Center for Health Statistics. Multiple imputation of family income in 2022 National Health Interview Survey: Methods. 2023.
- National Center for Health Statistics. National Health Interview Survey: 2022 survey description. 2023.
- RTI International. SUDAAN (Release 11.0.3) [computer software]. 2018.
- Parker JD, Talih M, Malec DJ, Beresovsky B, Carroll M, Gonzalez JF Jr., et al. National Center for Health Statistics data presentation standards for proportions. National Center for Health Statistics. Vital Health Stat 2(175). 2017.
Suggested citation
Cohen RA, Bottoms-McClain L. Dental care among adults age 65 and older: United States, 2022. NCHS Data Brief, no 500. Hyattsville, MD: National Center for Health Statistics. 2024. DOI: https://dx.doi.org/10.15620/cdc/151928.
Copyright information
All material appearing in this report is in the public domain and may be reproduced or copied without permission; citation as to source, however, is appreciated.
National Center for Health Statistics
Brian C. Moyer, Ph.D., Director
Amy M. Branum, Ph.D., Associate Director for Science
Division of Health Interview Statistics
Stephen J. Blumberg, Ph.D., Director
Anjel Vahratian, Ph.D., M.P.H., Associate Director for Science