Adults Living in Families Experiencing Food Insecurity in the Past 30 Days: United States, 2021
NCHS Data Brief No. 465, April 2023 |PDF (487 KB)
- Key findings
- What percentage of adults lived in families experiencing food insecurity in the previous 30 days, and did it differ by sex and age?
- Did the percentage of adults living in families experiencing food insecurity in the past 30 days vary by race and Hispanic origin and disability status?
- How did family food insecurity in the past 30 days vary among adults by urbanization?
- Were differences observed in family food insecurity in the past 30 days by family composition?
- Summary
Data from the National Health Interview Survey
- In 2021, 5.9% of adults aged 18 and over lived in families experiencing food insecurity in the past 30 days, and family food insecurity was higher among women (6.5%) than men (5.2%).
- Adults with disabilities (15%) were three times more likely to live in families experiencing food insecurity than adults without disabilities (5%).
- The percentage of adults experiencing family food insecurity varied by urbanization level.
- Family food insecurity was highest among unmarried adults living with children under age 18 (9.8%), and lowest among married adults not living with children under age 18 (3.4%).
In 2021, 33.8 million people in the United States were food insecure, that is, they did not have consistent, dependable access to sufficient quality or quantity of food (1,2). Food insecurity affects health outcomes (3), increasing the risk of high cholesterol, hypertension, chronic health conditions, and changes in functional limitations (4–6), and is a social determinant of health. This report explores selected sociodemographic characteristics of adults aged 18 and over living in families experiencing food insecurity.
Keywords: family food security, nutrition, health disparities, food insecure conditions, National Health Interview Survey (NHIS)
What percentage of adults lived in families experiencing food insecurity in the previous 30 days, and did it differ by sex and age?
- In 2021, 5.9% of adults lived in families experiencing food insecurity in the past 30 days (Figure 1).
- Women were more likely to live in families experiencing food insecurity (6.5%) than men (5.2%).
- Adults aged 65 and over were less likely to live in families experiencing food insecurity in the previous 30 days (3.5%) than adults aged 18–34 (6.7%), 35–44 (6.1%), 45–54 (6.9%), and 55–64 (6.4%).
Figure 1. Percentage of adults who lived in families experiencing food insecurity in the past 30 days, by sex and age: United States, 2021
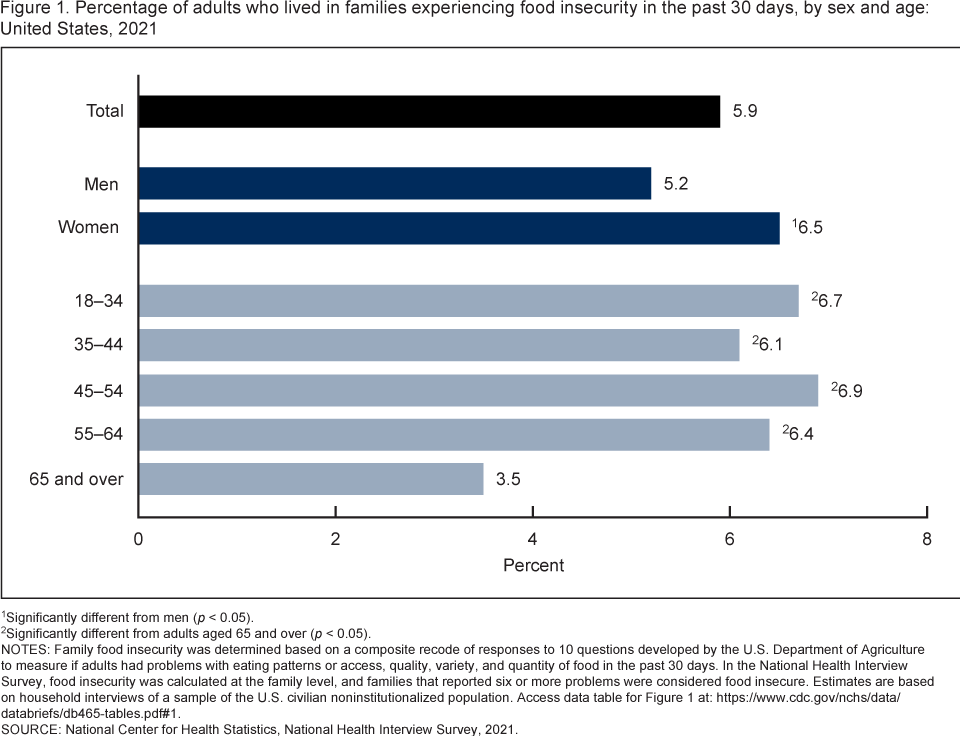
1Significantly different from men (p < 0.05).
2Significantly different from adults aged 65 and over (p < 0.05).
NOTES: Family food insecurity was determined based on a composite recode of responses to 10 questions developed by the U.S. Department of Agriculture to measure if adults had problems with eating patterns or access, quality, variety, and quantity of food in the past 30 days. In the National Health Interview Survey, food insecurity was calculated at the family level, and families that reported six or more problems were considered food insecure. Estimates are based on household interviews of a sample of the U.S. civilian noninstitutionalized population. Access data table for Figure 1.
SOURCE: National Center for Health Statistics, National Health Interview Survey, 2021.
Did the percentage of adults living in families experiencing food insecurity in the past 30 days vary by race and Hispanic origin and disability status?
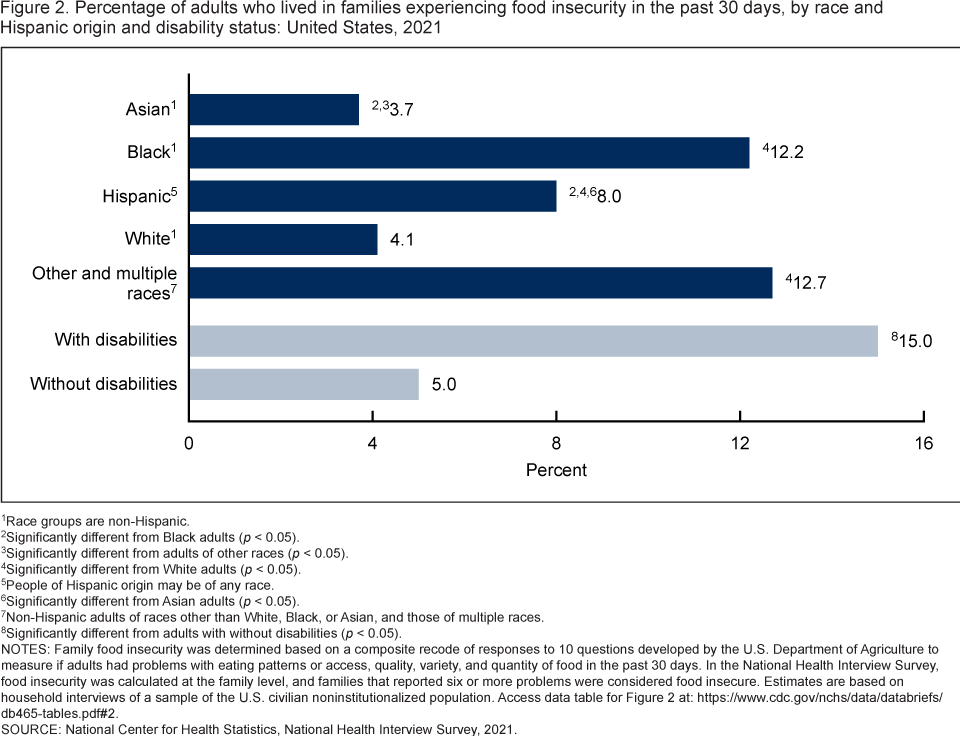
- Family food insecurity was higher among adults who self-reported as non-Hispanic other and multiple races (12.7%) and non-Hispanic Black (subsequently, Black; 12.2%) compared with non-Hispanic White (subsequently, White; 4.1%), and non-Hispanic Asian (subsequently, Asian; 3.7%) adults (Figure 2).
- Hispanic adults were more likely to live in families experiencing food insecurity (8.0%) than White (4.1%) or Asian (3.7%) adults, and less likely to live in families experiencing food insecurity than Black adults (12.2%).
- The percentage of adults with disabilities living in families experiencing food insecurity (15.0%) was three times higher than those without disabilities (5.0%).
Figure 2. Percentage of adults who lived in families experiencing food insecurity in the past 30 days, by race and Hispanic origin and disability status: United States, 2021
1Race groups are non-Hispanic.
2Significantly different from Black adults (p < 0.05).
3Significantly different from adults of other races (p < 0.05).
4Significantly different from White adults (p < 0.05).
5People of Hispanic origin may be of any race.
6Significantly different from Asian adults (p < 0.05).
7Non-Hispanic adults of races other than White, Black, or Asian, and those of multiple races.
8Significantly different from adults with without disabilities (p < 0.05).
NOTES: Family food insecurity was determined based on a composite recode of responses to 10 questions developed by the U.S. Department of Agriculture to measure if adults had problems with eating patterns or access, quality, variety, and quantity of food in the past 30 days. In the National Health Interview Survey, food insecurity was calculated at the family level, and families that reported six or more problems were considered food insecure. Estimates are based on household interviews of a sample of the U.S. civilian noninstitutionalized population. Access data table for Figure 2.
SOURCE: National Center for Health Statistics, National Health Interview Survey, 2021.
How did family food insecurity in the past 30 days vary among adults by urbanization?
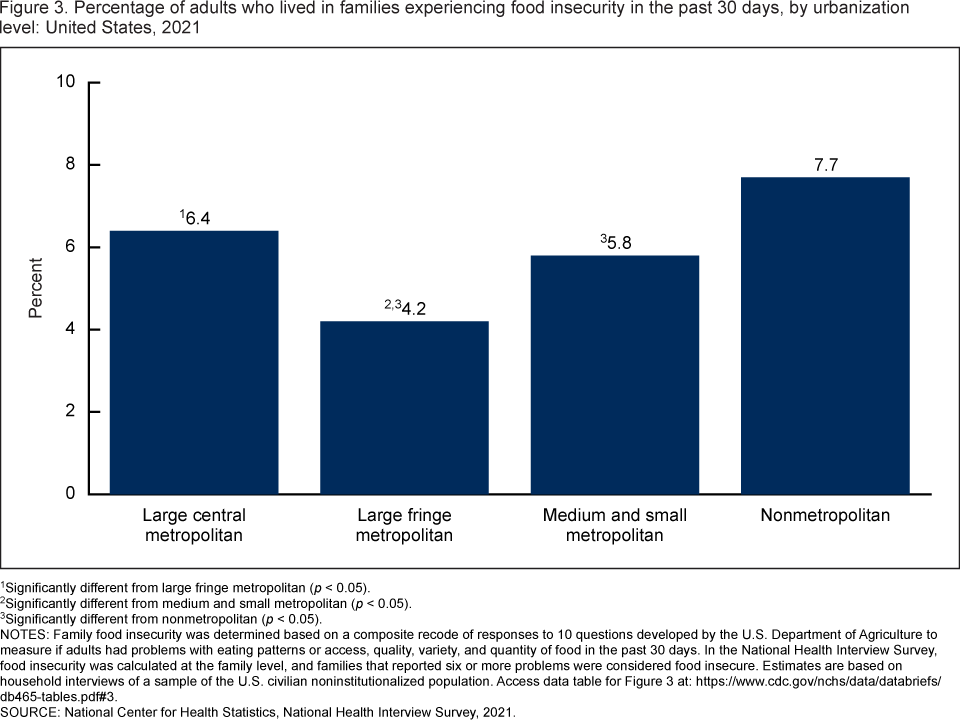
- Adults living in large fringe metropolitan areas experienced the lowest rates of family food insecurity (4.2%), and family food insecurity increased with decreasing urbanization to 5.8% for those living in small and medium metropolitan areas and 7.7% for those living in nonmetropolitan areas (Figure 3).
- The percentage of adults living in large central metropolitan areas that lived in families experiencing food insecurity (6.4%) was higher than those living in large fringe metropolitan areas (4.2%) but was not significantly different from those living in medium and small (5.8%) or nonmetropolitan (7.7%) areas.
Figure 3. Percentage of adults who lived in families experiencing food insecurity in the past 30 days, by urbanization level: United States, 2021
1Significantly different from large fringe metropolitan (p < 0.05).
2Significantly different from medium and small metropolitan (p < 0.05).
3Significantly different from nonmetropolitan (p < 0.05).
NOTES: Family food insecurity was determined based on a composite recode of responses to 10 questions developed by the U.S. Department of Agriculture tomeasure if adults had problems with eating patterns or access, quality, variety, and quantity of food in the past 30 days. In the National Health Interview Survey, food insecurity was calculated at the family level, and families that reported six or more problems were considered food insecure. Estimates are based on household interviews of a sample of the U.S. civilian noninstitutionalized population. Access data table for Figure 3.
SOURCE: National Center for Health Statistics, National Health Interview Survey, 2021.
Were differences observed in family food insecurity in the past 30 days by family composition?
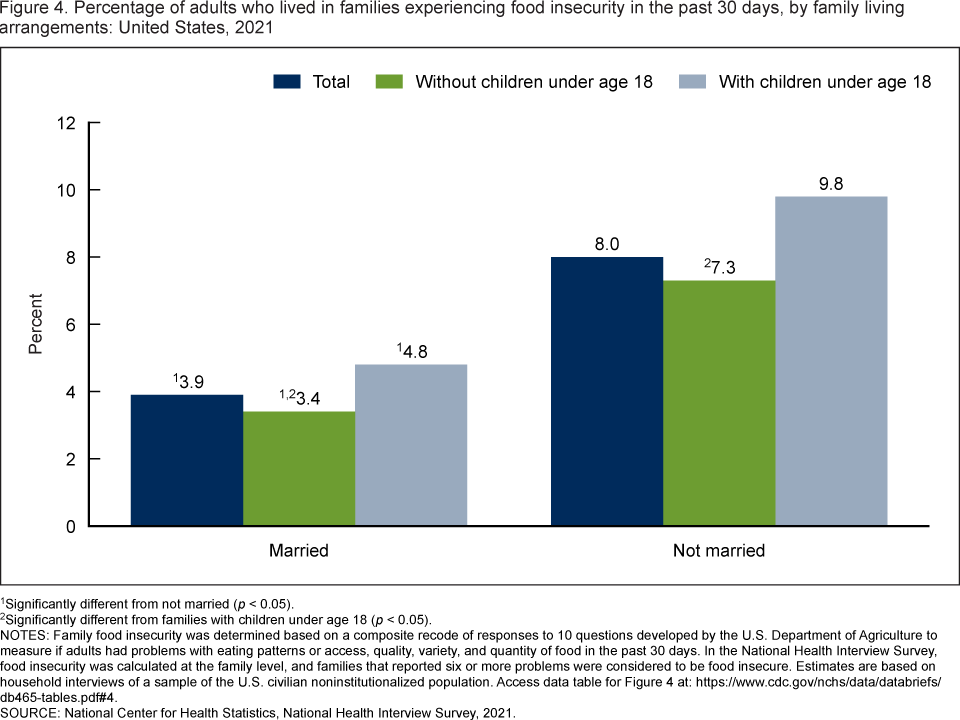
- In 2021, unmarried adults were more likely to live in families experiencing food insecurity (8.0%) than adults who were married (3.9%) (Figure 4).
- Married and unmarried adults were more likely to live in families experiencing food insecurity when living with children than with no children.
- Family food insecurity was highest among unmarried adults living with children under age 18 (9.8%), and lowest among married adults living with no children under age 18 (3.4%).
Figure 4. Percentage of adults who lived in families experiencing food insecurity in the past 30 days, by family living arrangements: United States, 2021
1Significantly different from not married (p < 0.05).
2Significantly different from families with children under age 18 (p < 0.05).
NOTES: Family food insecurity was determined based on a composite recode of responses to 10 questions developed by the U.S. Department of Agriculture to measure if adults had problems with eating patterns or access, quality, variety, and quantity of food in the past 30 days. In the National Health Interview Survey, food insecurity was calculated at the family level, and families that reported six or more problems were considered to be food insecure. Estimates are based on household interviews of a sample of the U.S. civilian noninstitutionalized population. Access data table for Figure 4.
SOURCE: National Center for Health Statistics, National Health Interview Survey, 2021.
Summary
In 2021, 5.9% of adults lived in families experiencing food insecurity. Differences in family food insecurity by demographic and family characteristics of adults were noted. Adults over age 65 were less likely to live in families experiencing food insecurity than those in other age groups, while adults living in families with children under age 18 were more likely to experience food insecurity compared with adults living in families with no children under age 18. Women were also more likely to live in families experiencing food insecurity than men. The percentage of adults with disabilities (15.0%) living in families experiencing food insecurity was three times higher than those without disabilities (5.0%).
Food security, having consistent, dependable access to sufficient quality or quantity of food, is an important social determinant of health. Prior research shows that having enough of the right kinds of food favorably impacts health outcomes such as hypertension, cholesterol, diabetes, and other chronic conditions (3–6). This report highlights the characteristics of adults who may be vulnerable to food insecurity.
Definitions
Disability status: Categorized by the level of difficulty reported in the Washington Group Short Set on Functioning. The six domains of functioning include: seeing (even if wearing glasses), hearing (even if wearing hearing aids), mobility (walking or climbing stairs), communication (understanding or being understood by others), cognition (remembering or concentrating), and self-care (such as washing all over or dressing). Adults who responded “a lot of difficulty” or “cannot do at all” to at least one of the six questions are considered to have disabilities.
Family composition: Categorized by combining marital status at the time of interview (yes or no) and the number of children under age 18 in the sample adult’s family at the time of interview. Family composition is coded as: 1) Married, no children under age 18; 2) Married, with children under 18; 3) Not married, no children under 18; or 4) Not married, with children under 18.
Food insecurity: Based on responses to a set of 10 questions: whether the respondent 1) worried that food would run out before there was money to buy more; 2) found food that was purchased didn’t last and did not have money to get more; 3) couldn’t afford to eat balanced meals; 4) had to cut the size of meals or skip meals because there was not enough money for food, and 5) the number of days this happened; 6) ate less than they should because there was not enough money for food; 7) was hungry but didn’t eat because there was not enough money for food; 8) lost weight because there was not enough money for food; 9) did not eat for a whole day because there was not enough money for food, and 10) the number of days this happened. The questions measure the family’s food situation based on the past 30 days. Based on the responses, families are categorized as food secure, low food secure, or very low food secure. For this analysis, families categorized as low food secure or very low food secure are considered food insecure (2).
Race and Hispanic origin: Adults categorized as Hispanic may be of any race or combination of races. Categories shown for non-Hispanic adults are for those who selected only one racial group; respondents had the option to select more than one racial group. Estimates for non-Hispanic adults of races other than White, Black, or Asian, and those of multiple races, are not shown but are included in total estimates. Analyses were limited to the race and Hispanic-origin groups for which data were reliable and sufficiently powered for group comparisons.
Urbanization: Metropolitan size and status was determined using the 2013 National Center for Health Statistics urban–rural classification scheme for counties (7) by merging the geographic federal information processing standard codes for the county of household residence with the county-level federal information processing standard codes from the classification scheme’s data set. Large metropolitan includes large central and large fringe metropolitan counties. Medium or small metropolitan includes medium and small metropolitan counties. Nonmetropolitan includes micropolitan and noncore counties.
Data source and methods
Data from the 2021 National Health Interview Survey were used for this analysis. The National Health Interview Survey is a nationally representative household survey of the U.S. civilian noninstitutionalized population. It is conducted continuously throughout the year by the National Center for Health Statistics. Interviews are typically conducted in respondents’ homes, but follow-ups to complete interviews may be conducted over the telephone. Because of the COVID-19 pandemic, interviewing procedures were disrupted and 62.8% of Sample Adult interviews were conducted at least partially by telephone during 2021 (8). For more information about the National Health Interview Survey, visit: https://www.cdc.gov/nchs/nhis.htm.
Point estimates and corresponding confidence intervals for this analysis were calculated using Stata software version 16 (9) to account for the complex sample design of the National Health Interview Survey. Differences between percentages were evaluated using two-sided significance tests at the 0.05 level. All estimates meet National Center for Health Statistics standards of reliability as specified in “National Center for Health Statistics Data Presentation Standards for Proportions” (10).
About the authors
The authors are with the National Center for Health Statistics: Julie D. Weeks and Laryssa Mykyta are with the Division of Analysis and Epidemiology, and Jennifer H. Madans is a guest researcher with the Office of the Director.
References
- Coleman-Jensen A, Rabbitt MP, Gregory CA, Singh A. Household food security in the United States in 2021. Economic Research Service. 2022.
- Economic Research Service. Definitions of food security. 2022.
- U.S. Department of Health and Human Services, Office of Disease Prevention and Health Promotion. Healthy People 2030: Social determinants of health.
- Gundersen C, Ziliak JP. Food insecurity and health outcomes. Health Aff (Millwood) 34(11):1830–9. 2015.
- Brucker DL. The association of food insecurity with health outcomes for adults with disabilities. Disabil Health J 10(2);286–93. 2017.
- Bishop NJ, Wang K. Food insecurity, comorbidity, and mobility limitations among older U.S. adults: Findings from the Health and Retirement Study and Health Care and Nutrition Study. Prev Med 114:180–7. 2018.
- Ingram DD, Franco SJ. 2013 NCHS urban–rural classification scheme for counties. National Center for Health Statistics. Vital Health Stat 2(166). 2014.
- National Center for Health Statistics. National Health Interview Survey: 2021 survey description. 2022.
- StataCorp. Stata (Release 16) [computer software]. 2019.
- Parker JD, Talih M, Malec DJ, Beresovsky V, Carroll M, Gonzalez JF Jr, et al. National Center for Health Statistics data presentation standards for proportions. National Center for Health Statistics. Vital Health Stat 2(175). 2017.
Suggested citation
Weeks JD, Mykyta L, Madans JH. Adults living in families experiencing food insecurity in the past 30 days: United States, 2021. NCHS Data Brief, no 465. Hyattsville, MD: National Center for Health Statistics. 2023. DOI: https://dx.doi.org/10.15620/cdc:125707.
Copyright information
All material appearing in this report is in the public domain and may be reproduced or copied without permission; citation as to source, however, is appreciated.
National Center for Health Statistics
Brian C. Moyer, Ph.D., Director
Amy M. Branum, Ph.D., Associate Director for Science
Division of Analysis and Epidemiology
Irma E. Arispe, Ph.D., Director
Julie D. Weeks, Ph.D., Acting Associate Director for Science