Emergency Department Visits With Suicidal Ideation: United States, 2016–2020
NCHS Data Brief No. 463, April 2023 |PDF (424 KB)
- Key findings
- The ED visit rate for patients with suicidal ideation was highest for those aged 14–18.
- The ED visit rates for patients with suicidal ideation differed by sex.
- The ED visit rate for patients with suicidal ideation was highest for non-Hispanic Black people.
- The ED visit rate for patients with suicidal ideation was lowest in the Northeast.
- Summary
Data from the National Hospital Ambulatory Medical Care Survey
- In 2016–2020, the annual average emergency department (ED) visit rate for patients with suicidal ideation was 40 visits per 10,000 people.
- The ED visit rate for suicidal ideation was higher among males (46 per 10,000 males) than females (34 per 10,000 females).
- Among males, the visit rate for suicidal ideation was highest for the 35–44 age group (97 per 10,000 people), and among females, it was highest for the 14–18 age group (128 per 10,000).
- Of the race and ethnicity groups analyzed, the visit rate for suicidal ideation was highest for non-Hispanic Black people (68 per 10,000).
- The ED visit rate for suicidal ideation was lowest in the Northeast.
Before the COVID-19 pandemic in the United States, suicide was the 10th highest cause of death overall and the 2nd highest cause for the 10–34 age group (1,2). Suicidal ideation is defined as thinking about, considering, or planning suicide; is predictive of suicide deaths; and may result in injury and hospitalization (3). An estimated 4.0% to 4.8% of adults aged 18 and over have suicidal ideation each year (4,5). The lifetime prevalence of suicidal ideation in the United States is 15.6% (6). This report uses data from the 2016–2020 National Hospital Ambulatory Medical Care Survey to present the annual average emergency department (ED) visit rate per 10,000 people for patients with suicidal ideation.
Keywords: suicide, self-directed violence, mental health, National Hospital Ambulatory Medical Care Survey
The ED visit rate for patients with suicidal ideation was highest for those aged 14–18.
- In 2016–2020, the annual average ED visit rate for patients with suicidal ideation was 40 visits per 10,000 people (Figure 1).
- The ED visit rate for suicidal ideation was highest among those aged 14–18, at 91 visits, then decreased with age to 16 for those aged 55 and over.
- The ED visit rate for children aged 0–13 years (15) was similar to the visit rate for people aged 55 and over (16).
Figure 1. Rate of emergency department visits with suicidal ideation, by age group: United States, 2016–2020
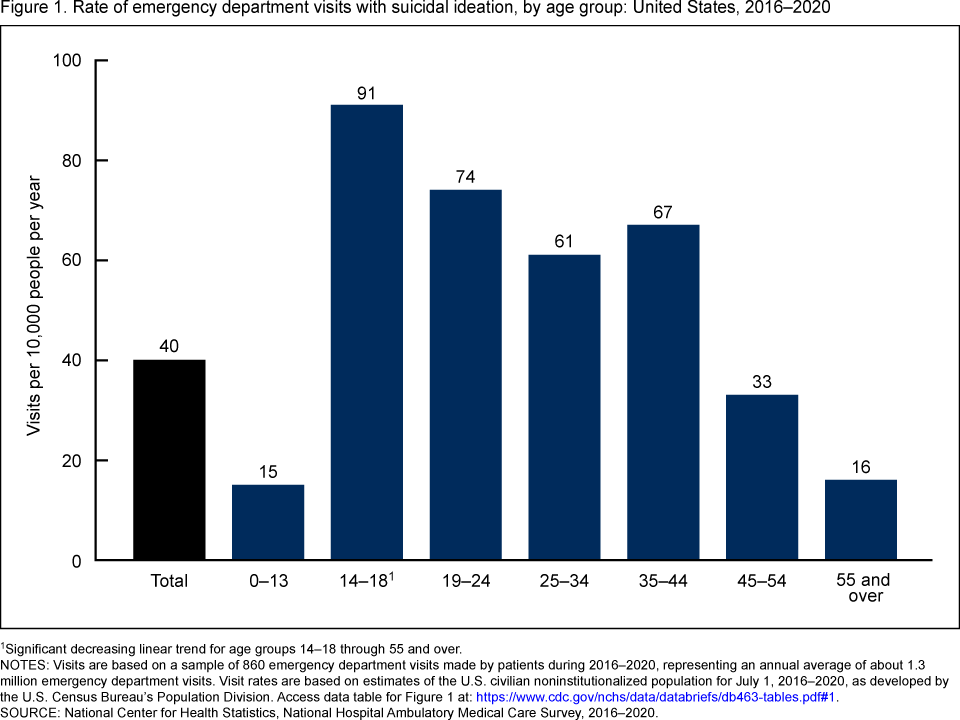
1Significant decreasing linear trend for age groups 14–18 through 55 and over.
NOTES: Visits are based on a sample of 860 emergency department visits made by patients during 2016–2020, representing an annual average of about 1.3 million emergency department visits. Visit rates are based on estimates of the U.S. civilian noninstitutionalized population for July 1, 2016–2020, as developed by the U.S. Census Bureau’s Population Division. Access data table for Figure 1.
SOURCE: National Center for Health Statistics, National Hospital Ambulatory Medical Care Survey, 2016–2020.
The ED visit rates for patients with suicidal ideation differed by sex.
- The annual average ED visit rate for patients with suicidal ideation was higher for males (46 visits per 10,000 people) compared with females (34) (Figure 2).
- Visit rates for men were higher compared with women for those aged 25–34 (77 and 45, respectively), 35–44 (97 and 38), and 55 and over (21 and 11), while the visit rate for females was higher for teenagers aged 14–18 (128 and 55, respectively). The visit rate was similar for men (71) and women (78) among those aged 19–24.
- Among males, the visit rate increased with age between age groups 14–18 at 55 visits and 35–44 at 97 visits, then declined to 21 visits for the 55 and over age group.
- Among females, the ED visit rate for patients with suicidal ideation was highest for teenagers aged 14–18, at 128 visits, then decreased with age to 11 visits for adults aged 55 and over.
Figure 2. Rate of emergency department visits with suicidal ideation, by sex and age group: United States, 2016–2020

*Estimate does not meet National Center for Health Statistics standards of reliability. Estimates are not presented if they are based on fewer than 30 cases in the sample data.
1Rates for female and male are significantly different.
2Significant decreasing linear trend among females from age groups 14–18 through 55 and over.
3Significant increasing linear trend among males from age groups 14–18 through 35–44.
4Significant decreasing linear trend among males from age groups 35–44 through 55 and over.
NOTES: Visits are based on a sample of 860 emergency department visits made by patients during 2016–2020, representing an annual average of about 1.3 million emergency department visits. Visit rates are based on estimates of the U.S. civilian noninstitutionalized population for July 1, 2016–2020, as developed by the U.S. Census Bureau’s Population Division. Access data table for Figure 2.
SOURCE: National Center for Health Statistics, National Hospital Ambulatory Medical Care Survey, 2016–2020.
The ED visit rate for patients with suicidal ideation was highest for non-Hispanic Black people.
- The annual average ED visit rate for non-Hispanic Black (subsequently, Black) people with suicidal ideation was 68 visits per 10,000 people, which was higher than the rates for non-Hispanic White (subsequently, White) (42), Hispanic or Latino (25), and non-Hispanic people of other races (subsequently, people of other races) (19) (Figure 3).
- The ED visit rate for White people was higher than the rate for Hispanic or Latino people and people of other races.
- The observed difference in the rates for Hispanic or Latino people and people of other races was not statistically significant.
Figure 3. Rate of emergency department visits with suicidal ideation, by race and ethnicity: United States, 2016–2020

1Significantly different from non-Hispanic Black or African American.
2Significantly different from non-Hispanic White.
NOTES: Visits are based on a sample of 860 emergency department visits made by patients during 2016–2020, representing an annual average of about 1.3 million emergency department visits. Visit rates are based on estimates of the U.S. civilian noninstitutionalized population for July 1, 2016–2020, as developed by the U.S. Census Bureau’s Population Division. Non-Hispanic other races includes Asian, Native Hawaiian or Other Pacific Islander, and American Indian or Alaska Native people, and people of two or more races. Access data table for Figure 3.
SOURCE: National Center for Health Statistics, National Hospital Ambulatory Medical Care Survey, 2016–2020.
The ED visit rate for patients with suicidal ideation was lowest in the Northeast.
- The annual average ED visit rate for patients with suicidal ideation living in the Northeast was 26 visits per 10,000 people, which was lower than the rates for people living in all other regions of the country, including the South (38), Midwest (46), and West (47) (Figure 4).
- The observed difference in ED visit rates for suicidal ideation in the South and the Midwest and West was not statistically significant.
Figure 4. Rate of emergency department visits with suicidal ideation, by region: United States, 2016–2020
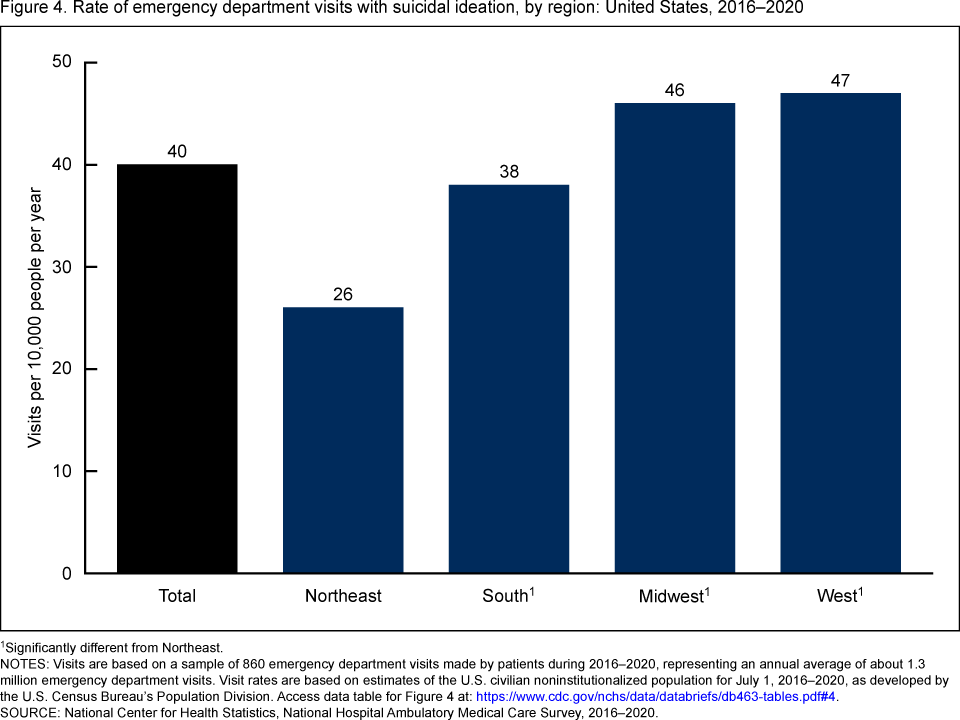
1Significantly different from Northeast.
NOTES: Visits are based on a sample of 860 emergency department visits made by patients during 2016–2020, representing an annual average of about 1.3 million emergency department visits. Visit rates are based on estimates of the U.S. civilian noninstitutionalized population for July 1, 2016–2020, as developed by the U.S. Census Bureau’s Population Division. Access data table for Figure 4.
SOURCE: National Center for Health Statistics, National Hospital Ambulatory Medical Care Survey, 2016–2020.
Summary
During 2016–2020, the average annual rate of ED visits for suicidal ideation was 40 visits per 10,000 people. Suicidal ideation was highest in teenagers (ages 14–18) and higher in females than males within this age group. However, across the lifespan, suicidal ideation was higher in males than females. For males, suicidal ideation increased with age, peaked in midlife (ages 35–44), then decreased. For females, suicidal ideation peaked for teenagers, then declined with age. Among the race and Hispanic-origin groups analyzed, suicidal ideation was highest for Black people, followed by White people. ED visit rates for suicidal ideation were lowest for people living in the Northeast. The findings of this report are consistent with those from previous research (7,8).
This report presents statistics on suicidal ideation, not on suicide attempts or deaths. Scientific research shows that suicidal ideation is strongly predictive of suicide (3,9,10), which is a major public health issue in the United States. The information in this report may provide insights into prevention efforts.
Definitions
ED visits with suicidal ideation: ED visits for which any of the International Classification of Diseases, 10th Revision, Clinical Modification diagnosis codes was R45.851 (suicidal ideation).
Race and ethnicity: Race and Hispanic ethnicity were collected separately, imputed, and converted into a single combined variable that includes non-Hispanic White, non-Hispanic Black, Hispanic or Latino, and non-Hispanic people of other races. Non-Hispanic people of other races includes Asian, Native Hawaiian or Other Pacific Islander, and American Indian or Alaska Native people, and people of two or more races. Race and ethnicity were imputed for missing records using a model-based, single, sequential regression-imputation method (11). Missing race values were imputed to be White, Black, or other. Hispanic or Latino ethnicity was imputed to be Hispanic or Latino or non-Hispanic. Analyses by other race and Hispanic-origin groups, including American Indian or Alaska Native people, could not be performed due to limited sample size.
Visit rate: Calculated by dividing the average annual number of ED visits by estimates of the U.S. civilian noninstitutionalized population (obtained from the U.S. Census Bureau’s Population Division) for selected characteristics including age group, sex, race and ethnicity, and region (11).
Data source and methods
Data for this report are from the 2016–2020 National Hospital Ambulatory Medical Care Survey, an annual nationally representative survey of nonfederal, general, and short-stay hospitals. The survey provides data on the use and provision of ambulatory care services in hospital EDs. Data analyses were performed using the statistical packages SAS version 9.4 (SAS Institute, Cary, N.C.) and SAS-callable SUDAAN version 11.0 (RTI International, Research Triangle Park, N.C.). Two-tailed t tests with a significance level of p < 0.05 were used to determine statistically significant differences between ED visit rates, and linear regression with a significance level of p < 0.05 was performed to test linear trends.
About the authors
Alexander Strashny, Christopher Cairns, and Jill J. Ashman are with the National Center for Health Statistics, Division of Health Care Statistics.
References
- Heron M. Deaths: Leading causes for 2017. National Vital Statistics Reports; vol 68 no 6. Hyattsville, MD: National Center for Health Statistics. 2019.
- Heron M. Deaths: Leading causes for 2019. National Vital Statistics Reports; vol 70 no 9. Hyattsville, MD: National Center for Health Statistics. 2021.
- Klonsky ED, May AM, Saffer BY. Suicide, suicide attempts, and suicidal ideation. Annu Rev Clin Psychol 12:307–30. 2016.
- Substance Abuse and Mental Health Services Administration. Key substance use and mental health indicators in the United States: Results from the 2019 National Survey on Drug Use and Health. 2020.
- Ivey-Stephenson AZ, Crosby AE, Hoenig JM, Gyawali S, Park-Lee E, Hedden SL. Suicidal thoughts and behaviors among adults aged ≥ 18 years–United States, 2015–2019. MMWR Surveill Summ 71(1):1–19. 2022.
- Nock MK, Borges G, Bromet EJ, Alonso J, Angermeyer M, Beautrais A, et al. Cross-national prevalence and risk factors for suicidal ideation, plans and attempts. Br J Psychiatry 192(2):98–105. 2008.
- Ivey-Stephenson AZ, Demissie Z, Crosby AE, Stone DM, Gaylor E, Wilkins N, et al. Suicidal ideation and behaviors among high school students—Youth Risk Behavior Survey, United States, 2019. MMWR Suppl 69(1):47–55. 2020.
- Zwald ML, Holland KM, Annor FB, Kite-Powell A, Sumner SA, Bowen DA, et al. Syndromic surveillance of suicidal ideation and self-directed violence—United States, January 2017–December 2018. MMWR Morb Mortal Wkly Rep 69(4):103–8. 2020.
- Hubers AAM, Moaddine S, Peersmann SHM, Stijnen T, van Duijn E, van der Mast RC, et al. Suicidal ideation and subsequent completed suicide in both psychiatric and non-psychiatric populations: A meta-analysis. Epidemiol Psychiatr Sci 27(2):186–98. 2018.
- Goldman-Mellor S, Olfson M, Lidon-Moyano C, Schoenbaum M. Association of suicide and other mortality with emergency department presentation. JAMA Netw Open 2(12):e1917571. 2019.
- National Center for Health Statistics. 2016–2020 NHAMCS micro-data file documentation.
Suggested citation
Strashny A, Cairns C, Ashman JJ. Emergency department visits with suicidal ideation: United States, 2016–2020. NCHS Data Brief, no 463. Hyattsville, MD: National Center for Health Statistics. 2023. DOI: https://dx.doi.org/10.15620/cdc:125704.
Copyright information
All material appearing in this report is in the public domain and may be reproduced or copied without permission; citation as to source, however, is appreciated.
National Center for Health Statistics
Brian C. Moyer, Ph.D., Director
Amy M. Branum, Ph.D., Associate Director for Science
Division of Health Care Statistics
Carol J. DeFrances, Ph.D., Director
Alexander Strashny, Ph.D., Associate Director for Science