Dental Care Utilization Among Children Aged 1–17 Years: United States, 2019 and 2020
NCHS Data Brief No. 424, December 2021
PDF Version (554 KB) | Visual Abstract
Dzifa Adjaye-Gbewonyo, Ph.D., and Lindsey I. Black, M.P.H.
- Key findings
- Between 2019 and 2020, the percentage of children who had a dental examination or cleaning in the past 12 months decreased.
- Between 2019 and 2020, the percentage of children who had a dental examination or cleaning in the past 12 months decreased among those living in families with lower incomes.
- Between 2019 and 2020, the percentage of children who had a dental examination or cleaning in the past 12 months decreased in all regions.
- Summary
Data from the National Health Interview Survey
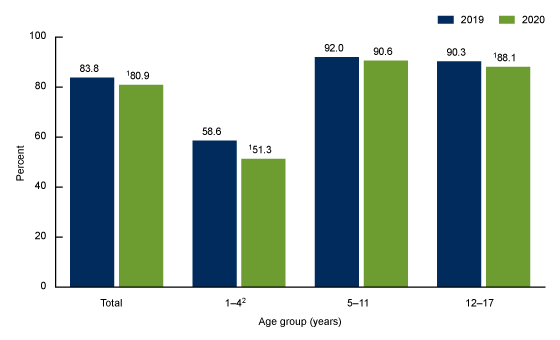
- From 2019 to 2020, the percentage of children aged 1–17 years who had a dental examination or cleaning in the past 12 months decreased from 83.8% to 80.9%.
- Annual dental examinations and cleanings decreased for children aged 1–4 years and 12–17 years.
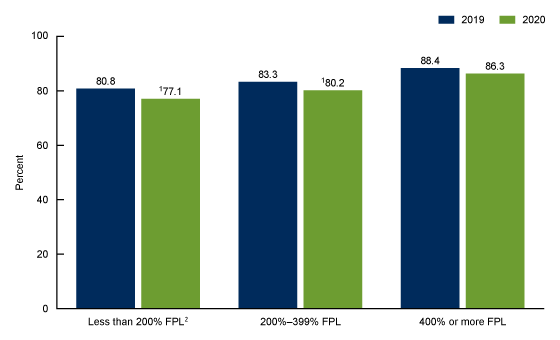
- Children aged 1–17 years living in families with incomes below 400% of the federal poverty level were less likely to have had an annual dental examination or cleaning in 2020 than in 2019.
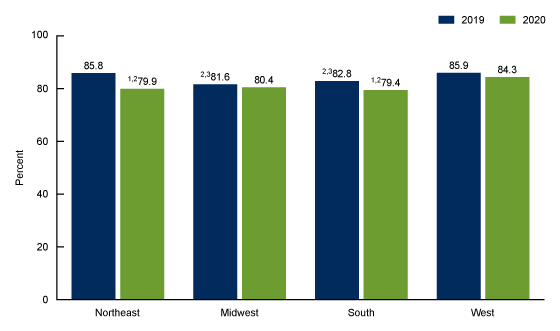
- Annual dental examinations and cleanings among children aged 1–17 years declined during this 2-year period in the Northeast (85.8% to 79.9%) and the South (82.8% to 79.4%).
The American Academy of Pediatric Dentistry recommends regular preventive dental examinations and cleanings for children starting from the time their first tooth appears or by age 1 year (1). In 2020, dental practices adjusted their services in response to the COVID-19 pandemic, and access to dental care was disrupted for many Americans (2,3). This report uses data from the 2019 and 2020 National Health Interview Survey (NHIS) to describe recent changes in the prevalence of dental examinations or cleanings in the past 12 months among children aged 1–17 years by selected sociodemographic characteristics.
Keywords: oral health, preventive care, pediatric, National Health Interview Survey
Between 2019 and 2020, the percentage of children who had a dental examination or cleaning in the past 12 months decreased.
The percentage of children aged 1–17 years who had a dental examination or cleaning in the past 12 months decreased from 83.8% in 2019 to 80.9% in 2020 (Figure 1). Children aged 1–4 years were the least likely to have had a dental examination or cleaning in both years (58.6% in 2019 and 51.3% in 2020) and experienced the greatest decrease. Children aged 12–17 years had a smaller but significant drop in the percentage with a dental examination or cleaning, from 90.3% in 2019 to 88.1% in 2020. The observed difference between 2019 (92.0%) and 2020 (90.6%) in the percentage of children aged 5–11 years with a dental examination or cleaning in the past 12 months was not significant.
Figure 1. Percentage of children aged 1–17 years who had a dental examination or cleaning in the past 12 months, by survey year and age group: United States, 2019 and 2020

1Significantly different from 2019 (p < 0.05).
2Significant linear and quadratic trend by age for both 2019 and 2020 (p < 0.05).
NOTES: Estimates are based on household interviews of a sample of the civilian noninstitutionalized population. Access data table for Figure 1.
SOURCE: National Center for Health Statistics, National Health Interview Survey, 2019 and 2020.
Between 2019 and 2020, the percentage of children who had a dental examination or cleaning in the past 12 months decreased among those living in families with lower incomes.
Among children aged 1–17 years living in families with incomes less than 200% of the federal poverty level (FPL), the percentage with a dental examination or cleaning in the past 12 months decreased from 80.8% in 2019 to 77.1% in 2020 (Figure 2). Similarly, among children living in families with incomes 200%–399% of FPL, the percentage with a dental examination or cleaning decreased from 83.3% in 2019 to 80.2% in 2020. The observed difference between years for children living in families with incomes 400% or more of FPL (88.4% to 86.3%) was not significant. In both years, the percentage of children who had a dental examination or cleaning increased as their family income increased.
Figure 2. Percentage of children aged 1–17 years who had a dental examination or cleaning in the past 12 months, by survey year and family income as a percentage of the federal poverty level: United States, 2019 and 2020

1Significantly different from 2019 (p < 0.05).
2Significant linear trend by family income as a percentage of the federal poverty level for both 2019 and 2020 (p < 0.05).
NOTES: FPL is federal poverty level. Estimates are based on household interviews of a sample of the civilian noninstitutionalized population. Access data table for Figure 2.
SOURCE: National Center for Health Statistics, National Health Interview Survey, 2019 and 2020.
Between 2019 and 2020, the percentage of children who had a dental examination or cleaning in the past 12 months decreased in all regions.
Dental examinations or cleanings in the past 12 months among children aged 1–17 years living in the Northeast and South decreased from 2019 (85.8% and 82.8%, respectively) to 2020 (79.9% and 79.4%, respectively) (Figure 3). The observed differences between 2019 and 2020 among children living in the Midwest (81.6% and 80.4%, respectively) and the West (85.9% and 84.3%, respectively) were not significant. In 2019, the percentage of children receiving a dental examination or cleaning was highest in the Northeast and West and remained highest in the West in 2020.
Figure 3. Percentage of children aged 1–17 years who had a dental examination or cleaning in the past 12 months, by survey year and region: United States, 2019 and 2020

1Significantly different from 2019 (p < 0.05).
2Significantly different from West in the same year (p < 0.05).
3Significantly different from Northeast in the same year (p < 0.05).
NOTES: Estimates are based on household interviews of a sample of the civilian noninstitutionalized population. Access data table for Figure 3.
SOURCE: National Center for Health Statistics, National Health Interview Survey, 2019 and 2020.
Summary
Between 2019 and 2020, the percentage of children aged 1–17 years who had a dental examination or cleaning in the past 12 months decreased by nearly 3 percentage points, from 83.8% to 80.9%. This pattern was especially apparent among children aged 1–4 years, who had a 7.3 percentage point decrease during this period and were already less likely than older children to have had a dental visit. The percentage of children who had an annual dental examination or cleaning decreased from 2019 to 2020 for children living in families with incomes below 400% of FPL. Regional differences in dental care over time were also observed. Annual preventive dental visits were highest in the West and Northeast in 2019 and remained relatively high in the West in 2020, while visits decreased nearly 6 percentage points in the Northeast and 3.4 percentage points in the South.
These data refer to preventive dental care in the past 12 months. Therefore, changes from 2019 to 2020 cannot be clearly attributed to the COVID-19 pandemic because some of the reference period occurred before the start of the pandemic. Previous studies have shown that parents have reported difficulty accessing preventive dental care for their children due to the pandemic or have not attempted to seek dental care for them because of reasons related to the pandemic (4).
Definitions
Dental examination or cleaning in the past 12 months: Based on responses to the survey question, “About how long has it been since [sample child] last had a dental examination or cleaning?” Responses of “within the past year (anytime less than 12 months ago)” were considered as having had a dental examination or cleaning in the past 12 months.
Family income as a percentage of FPL: Based on the federal poverty level, which was derived from the family’s income in the previous calendar year and family size using the U.S. Census Bureau’s poverty thresholds (5). Family income was imputed when missing (6).
Region: In the geographic classification of the U.S. population, states are grouped into four regions used by the U.S. Census Bureau:
- Northeast: Maine, New Hampshire, Vermont, Massachusetts, Rhode Island, Connecticut, New York, New Jersey, and Pennsylvania.
- Midwest: Ohio, Indiana, Illinois, Michigan, Wisconsin, Minnesota, Iowa, Missouri, North Dakota, South Dakota, Nebraska, and Kansas.
- South: Delaware, Maryland, District of Columbia, Virginia, West Virginia, North Carolina, South Carolina, Georgia, Florida, Kentucky, Tennessee, Alabama, Mississippi, Arkansas, Louisiana, Oklahoma, and Texas.
- West: Montana, Idaho, Wyoming, Colorado, New Mexico, Arizona, Utah, Nevada, Washington, Oregon, California, Alaska, and Hawaii.
Data source and methods
Data from the 2019 and 2020 NHIS were used for this analysis. NHIS is a nationally representative household survey of the U.S. civilian noninstitutionalized population. It is conducted continuously throughout the year by the National Center for Health Statistics (NCHS). Interviews are typically conducted in person in respondents’ homes with follow-up by telephone, if needed. Due to the COVID-19 pandemic, data collection procedures in 2020 were disrupted, and from April through June all interviews were conducted by telephone only, and from July through December interviews were attempted by telephone first, with follow-ups to complete interviews by personal visit. For more information about NHIS, visit: https://www.cdc.gov/nchs/nhis/2020nhisdata.htm.
Point estimates and their corresponding confidence intervals were calculated using SUDAAN software (7) to account for the complex sample design of NHIS. Differences between percentages were evaluated using two-sided significance tests at the 0.05 level. Linear and quadratic trends by age group and family income were evaluated using Proc Descript, poly option. All estimates meet NCHS standards of reliability as specified in “National Center for Health Statistics data presentation standards for proportions” (8).
About the authors
Dzifa Adjaye-Gbewonyo and Lindsey I. Black are with NCHS’ Division of Health Interview Statistics.
References
- American Academy of Pediatric Dentistry. Periodicity of examination, preventive dental services, anticipatory guidance/counseling, and oral treatment for infants, children, and adolescents. In: The reference manual of pediatric dentistry. Chicago, IL: American Academy of Pediatric Dentistry, 232–42. 2020.
- American Dental Association. COVID-19 and dentistry timeline. ADA News. 2021.
- Brian Z, Weintraub JA. Oral health and COVID-19: Increasing the need for prevention and access. Prev Chronic Dis 17:E82. 2020.
- C.S. Mott Children’s Hospital. Pandemic-posed challenges to children’s oral health. Mott Poll Report 38(1). 2021.
- United States Census Bureau. Poverty thresholds. 2021.
- National Center for Health Statistics. Multiple imputation of family income in 2019 National Health Interview Survey: Methods. 2020.
- RTI International. SUDAAN (Release 11.0.3) [computer software]. 2018.
- Parker JD, Talih M, Malec DJ, Beresovsky V, Carroll M, Gonzalez JF Jr, et al. National Center for Health Statistics data presentation standards for proportions. National Center for Health Statistics. Vital Health Stat 2(175). 2017.
Suggested citation
Adjaye-Gbewonyo D, Black LI. Dental care utilization among children aged 1–17 years: United States, 2019 and 2020. NCHS Data Brief, no 424. Hyattsville, MD: National Center for Health Statistics. 2021. DOI: https://dx.doi.org/10.15620/cdc:111175.
Copyright information
All material appearing in this report is in the public domain and may be reproduced or copied without permission; citation as to source, however, is appreciated.
National Center for Health Statistics
Brian C. Moyer, Ph.D., Director
Amy M. Branum, Ph.D., Associate Director for Science
Division of Health Interview Statistics
Stephen J. Blumberg, Ph.D., Director
Anjel Vahratian, Ph.D., M.P.H., Associate Director for Science