Urban-rural Differences in Unintentional Injury Death Rates Among Children Aged 0–17 Years: United States, 2018–2019
NCHS Data Brief No. 421, October 2021
PDF Version (430KB)
Matthew F. Garnett, M.P.H., Merianne Rose Spencer, M.P.H., and Holly Hedegaard, M.D.
- Key findings
- In 2018–2019, rates of unintentional injury death were higher among children in rural areas than in urban areas in every age group.
- In 2018–2019, among children aged under 1 year, suffocation was the leading mechanism of unintentional injury death in both urban and rural areas, followed by motor vehicle traffic.
- Among children aged 1–4 years, rates in rural areas were higher than urban areas for all mechanisms of unintentional injury death, in 2018–2019.
- Among children aged 5–13 years, motor vehicle traffic was the leading mechanism of unintentional injury death in both urban and rural areas, in 2018–2019.
- In 2018–2019, among children aged 14–17 years, motor vehicle traffic was the leading mechanism of unintentional injury death in both urban and rural areas.
Data from the National Vital Statistics System
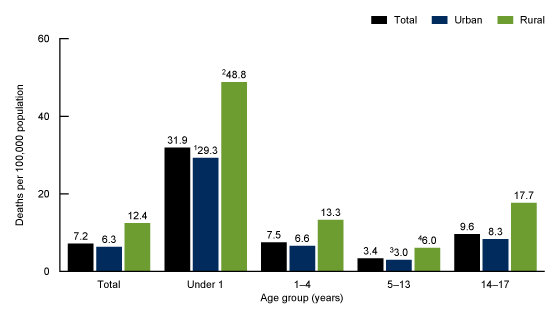
- In 2018–2019, the unintentional injury death rate was higher for children in rural areas (12.4 per 100,000) than in urban areas (6.3).
- In both urban and rural areas, children aged under 1 year had the highest rate of unintentional injury death, largely due to deaths from suffocation.
- Among children aged 1–4 years, the rate of unintentional injury death due to fire or flame was four times higher in rural areas (1.7) than in urban areas (0.4).
- Motor vehicle traffic was the leading mechanism of unintentional injury death among children aged 5–13, with the rural rate (3.1) twice as high as the urban rate (1.5).
- Among children aged 14–17, rates of unintentional injury death by poisoning, which includes drug overdose, were similar in urban and rural areas.
Unintentional injuries are the leading cause of death among children aged 0–17 years (1). In 2018–2019, 14% of children in the United States aged 0–17 years resided in rural areas but accounted 24% of all childhood injury deaths (1). Urban-rural differences in injury mortality have been associated with a variety of factors, including differences in types of activities, use of safety equipment, practice of safety-related behaviors, built environments, and access to care (2–9). This report presents rates of unintentional injury death among children aged 0–17 for 2018–2019, highlighting the differences in rates by mechanism of injury and urban-rural status.
Keywords: pediatric unintentional injury deaths, urbanicity, mechanism of injury, National Vital Statistics System
In 2018–2019, rates of unintentional injury death were higher among children in rural areas than in urban areas in every age group.
- The rate of unintentional injury death among all children aged 0–17 years was 7.2 per 100,000 and was nearly twice as high for children living in rural areas (12.4) compared with urban areas (6.3); rural rates were higher than urban rates for all age groups (Figure 1).
- Rates of unintentional injury death were highest for children aged under 1 year in both urban (29.3) and rural (48.8) areas compared with all other age groups.
- For both urban and rural areas, rates decreased with age from those aged under 1 year to those aged 5–13 years, and then increased for those aged 14–17.
Figure 1. Rates of unintentional injury death, by age group and urban-rural status: United States, 2018–2019
1Among urban children, rate for those under 1 year is significantly higher than the rates for all other age groups (p < 0.05).
2Among rural children, rate for those under 1 year is significantly higher than the rates for all other age groups (p < 0.05).
33Among urban children, rate for those aged 5–13 years is significantly lower than the rates for all other age groups (p < 0.05).
4Among rural children, rate for those aged 5–13 years is significantly lower than the rates for all other age groups (p < 0.05).
NOTES: Rural rates are significantly higher than urban rates for all groups (p < 0.05). Unintentional injury deaths are identified using International Classification of Diseases, 10th Revision underlying cause-of-death codes V01–X59 or Y85–Y86. The decedent’s county of residence was classified as urban or rural based on the 2013 NCHS Urban–Rural Classification Scheme for Counties. Rates shown are crude rates (deaths per 100,000). Access data table for Figure 1.
SOURCE: National Center for Health Statistics, National Vital Statistics System, Mortality.
In 2018–2019, among children aged under 1 year, suffocation was the leading mechanism of unintentional injury death in both urban and rural areas, followed by motor vehicle traffic.
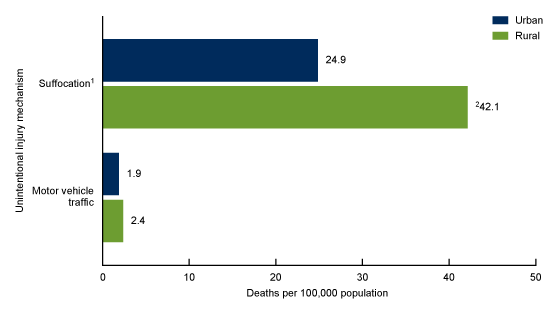
- Among children aged under 1 year, suffocation, which includes choking, asphyxiation, and strangulation, was the leading mechanism of unintentional injury death and was higher among rural (42.1 per 100,000) compared with urban children (24.9) (Figure 2).
- Motor vehicle traffic was the second leading mechanism of unintentional injury death among children aged under 1 year; rates were similar in urban (1.9) and rural (2.4) areas.
Figure 2. Rates of unintentional injury death, by mechanism and urban-rural status among children aged under 1 year: United States, 2018–2019
1For both rural and urban areas, rates of suffocation death were significantly higher than rates of motor vehicle traffic deaths (p < 0.05).
2Rate for rural children was significantly higher than rate for urban children (p < 0.05).
NOTES: Rates are only shown for mechanisms that had 20 or more deaths in both rural and urban areas during 2018–2019. The specific mechanisms shown account for 91.1% of rural and 91.3% of urban unintentional injury deaths among children under age 1. Unintentional injury deaths are identified using International Classification of Diseases, 10th Revision underlying cause-of-death codes V01–X59 or Y85–Y86. The decedent’s county of residence was classified as urban or rural based on the 2013 NCHS Urban–Rural Classification Scheme for Counties. Access data table for Figure 2.
SOURCE: National Center for Health Statistics, National Vital Statistics System, Mortality.
Among children aged 1–4 years, rates in rural areas were higher than urban areas for all mechanisms of unintentional injury death, in 2018–2019.
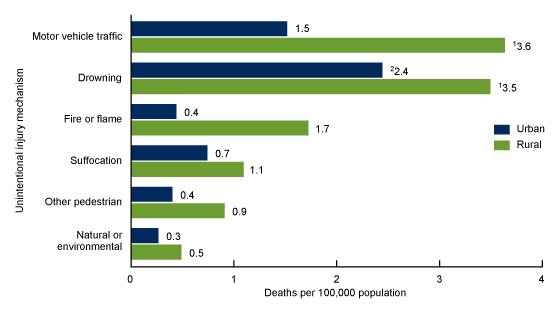
- Among children aged 1–4 in urban areas, drowning was the leading mechanism of unintentional injury death, with a rate of 2.4 per 100,000 (Figure 3). In rural areas, both motor vehicle traffic (3.6) and drowning (3.5) were the leading mechanisms of unintentional injury death.
- Rural rates were higher than urban rates for unintentional injury deaths involving motor vehicle traffic, drowning, fire or flame, suffocation, other pedestrian, and natural or environmental mechanisms among children aged 1–4.
- The largest disparity between urban and rural rates was seen for unintentional injury deaths involving fire or flame, where the rate was four times higher in rural areas (1.7) than in urban areas (0.4).
Figure 3. Rates of unintentional injury death, by mechanism and urban-rural status among children aged 1–4 years: United States, 2018–2019
1Among rural children, rates for drowning and motor vehicle traffic deaths were higher than rates for all other mechanisms (p < 0.05).
2Among urban children, rate for drowning deaths was significantly higher than rates for all other mechanisms (p < 0.05).
NOTES: Rates are only shown for mechanisms that had 20 or more deaths in both rural and urban areas during 2018–2019. The specific mechanisms shown account for 85.3% of rural deaths and 88.5% of urban deaths among children aged 1–4 years. Rates of unintentional injury death for rural children were significantly higher than rates for urban children for all mechanisms (p < 0.05). Unintentional injury deaths are identified using International Classification of Diseases, 10th Revision underlying cause-of-death codes V01–X59 or Y85–Y86. The decedent’s county of residence was classified as urban or rural based on the 2013 NCHS Urban–Rural Classification Scheme for Counties. Access data table for Figure 3.
SOURCE: National Center for Health Statistics, National Vital Statistics System, Mortality.
Among children aged 5–13 years, motor vehicle traffic was the leading mechanism of unintentional injury death in both urban and rural areas, in 2018–2019.
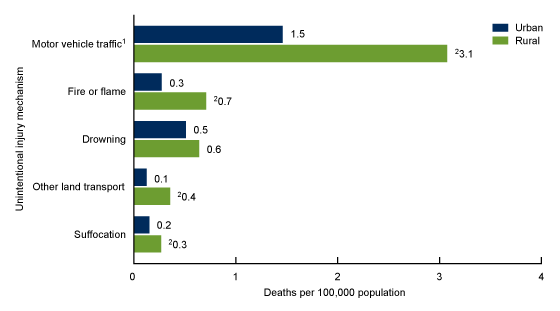
- Motor vehicle traffic was the leading mechanism of unintentional injury death among children aged 5–13 in both urban and rural areas; the rate was twice as high in rural (3.1) than in urban areas (1.5) (Figure 4).
- Rates for unintentional injury deaths involving fire or flame, suffocation, and other land transport were higher in rural compared with urban areas; the largest disparity was among other land transport deaths, where rural rates were four times higher than urban rates.
- Rates of drowning deaths were similar for children aged 5–13 in urban (0.5) and rural (0.6) areas.
Figure 4. Rates of unintentional injury death, by mechanism and urban-rural status among children aged 5–13 years: United States, 2018–2019
1Among rural and urban children, rates for motor vehicle traffic were significantly higher than rates for all other mechanisms (p < 0.05).
2Rates for rural children were significantly higher than rates for urban children (p < 0.05).
NOTES: Rates are only shown for mechanisms that had 20 or more deaths in both rural and urban areas during 2018–2019. The specific mechanisms shown account for 83.4% of rural and 85.0% of urban unintentional injury deaths among children aged 5–13 years. Unintentional injury deaths are identified using International Classification of Diseases, 10th Revision underlying cause-of-death codes V01–X59 or Y85–Y86. The decedent’s county of residence was classified as urban or rural based on the 2013 NCHS Urban–Rural Classification Scheme for Counties. Access data table for Figure 4.
SOURCE: National Center for Health Statistics, National Vital Statistics System, Mortality.
In 2018–2019, among children aged 14–17 years, motor vehicle traffic was the leading mechanism of unintentional injury death in both urban and rural areas.
- Motor vehicle traffic was the leading mechanism of unintentional injury death among children aged 14–17 in both urban and rural areas; the rate was 2.5 times higher in rural (12.5) than in urban areas (5.1) (Figure 5).
- Rural rates were also higher than urban rates for unintentional injury deaths involving drowning, other land transport, and firearms.
- Among children aged 14–17, the rate of unintentional poisoning deaths, which includes drug overdose, was similar in urban (1.1) and rural (0.9) areas.
Figure 5. Rates of unintentional injury death, by mechanism and urban-rural status among children aged 14–17 years: United States, 2018–2019
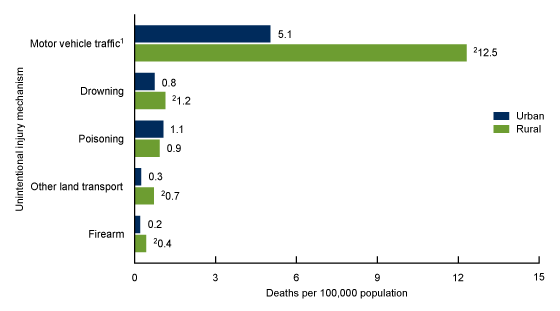
1Among rural and urban children, rates for motor vehicle traffic were significantly higher than rates for all other mechanisms (p < 0.05).
2Rates for rural children were significantly higher than rates for urban children (p < 0.05).
NOTES: Rates are only shown for mechanisms that had 20 or more deaths in both rural and urban areas during 2018–2019. The specific mechanisms shown account for 89.4% of rural and 89.2% of urban unintentional injury deaths among children aged 14–17 years. Unintentional injury deaths are identified using International Classification of Diseases, 10th Revision underlying cause-of-death codes V01–X59 or Y85–Y86. The decedent’s county of residence was classified as urban or rural based on the 2013 NCHS Urban–Rural Classification Scheme for Counties. Poisoning includes drug overdoses. Access data table for Figure 5.
SOURCE: National Center for Health Statistics, National Vital Statistics System, Mortality.
Summary
In both urban and rural areas, unintentional injury death rates were highest among children aged under 1 year, declined in the 1–4 and 5–13 age groups, and then increased in the 14–17 age group. Although this pattern was seen in both urban and rural areas, rural rates were consistently higher than urban rates for all age groups.
The specific mechanisms contributing to unintentional injury deaths differed by age group. Among children aged under 1 year, suffocation, which includes choking, asphyxiation, and strangulation, was the leading mechanism of unintentional injury death. Drowning and motor vehicle traffic were the leading mechanisms for children aged 1–4. In older age groups (5–13 and 14–17), motor vehicle traffic was the leading mechanism.
In most cases, children in rural areas were at higher risk of death by nearly all mechanisms. However, urban and rural rates were similar for motor vehicle traffic among children aged under 1 year, drowning and suffocation among children aged 5–13, and poisoning among children aged 14–17. The largest disparities between urban and rural rates were seen in unintentional fire or flame deaths among children aged 1–4 and other land transport deaths among children aged 5–13, where the rural rates were four times higher than the urban rates.
Definitions
Drowning: Deaths following submersion in water and excludes transportation and storm-related drownings.
Firearm: Deaths that involve the discharge of a firearm.
Motor vehicle traffic: Deaths that involve a motorized vehicle operating on a public roadway (that is, on a publicly owned street). This category includes deaths of any role type including vehicle occupants, pedestrians, pedal cyclists, and other road users.
Natural or environmental: Deaths that stem from adverse environmental or natural conditions including causes related to animals, weather, or other elements of nature.
Other land transport: Deaths that involve a nontraffic crash or collision that occurred while riding selected types of vehicles such as a motorcycle; streetcar; railway; construction, agricultural, or other industrial vehicle; or an animal. This category also includes deaths occurring in unspecified nontraffic accidents, nonmotor vehicle accidents in traffic, and unspecified vehicle accidents.
Other pedestrian: Deaths that occur to a pedestrian outside of a public roadway (for example, on a driveway, private road, path, or parking lot), and pedestrians hit by nonmotorized vehicles or trains.
Poisoning: Deaths from the ingestion, absorption, or inhalation of any toxic foreign agent including drug and nondrug substances and gases.
Suffocation: Deaths resulting from any mechanical airway obstruction involving a foreign object that hinders breathing. This category includes deaths from strangulation and asphyxiation from bedding, and other objects, as well as choking due to food, foreign objects, or aspiration.
Data source and methods
The National Vital Statistics System (NVSS) multiple cause-of-death mortality data from 2018 and 2019 (10) were used to examine unintentional injury deaths by age and urban-rural classification. Deaths were identified using International Classification of Diseases, 10th Revision were further categorized by mechanism of injury using the ICD–10 External Cause Mortality Matrix (11). Results are only presented for mechanisms with 20 or more deaths during the 2018–2019 period in both urban and rural areas.
The decedent’s county of residence was categorized using the 2013 NCHS Urban–Rural Classification Scheme for Counties (12). Counties were classified into six urbanization levels based on metropolitan-nonmetropolitan status, population distribution, and other factors. The four metropolitan categories (that is, large central metro, large fringe metro, medium metro, and small metro) were grouped as urban. The two nonmetropolitan categories (that is, micropolitan and noncore) were grouped as rural.
Crude rates (deaths per 100,000 population) (Figures 1–5) were calculated. For rates based on 100 deaths or more, pairwise comparisons of rates were conducted using the z test statistic with an alpha level of 0.05 (two-sided) (13). For rates based on fewer than 100 deaths, significance at the p < 0.05 level was determined by examination of overlapping 95% confidence intervals from a gamma distribution.
About the authors
Matthew F. Garnett, Merianne Rose Spencer, and Holly Hedegaard are with the National Center for Health Statistics, Division of Analysis and Epidemiology.
References
- National Center for Health Statistics. About underlying cause of death 1999–2019. CDC WONDER online database. 2021.
- Zwerling C, Peek-Asa C, Witten PS, Choi S-W, Sprince NL, Jones MP. Fatal motor vehicle crashes in rural and urban areas: Decomposing rates into contributing factors. Inj Prev 11(1):24–8. 2005.
- National Center for Statistics and Analysis. Rural/urban comparison of traffic fatalities: 2018 data. Traffic Safety Facts. Report No. DOT HS 812 957. National Highway Traffic Safety Administration. 2020.
- Ballesteros MF, Williams DD, Mack KA, Simon TR, Sleet DA. The epidemiology of unintentional and violence-related injury morbidity and mortality among children and adolescents in the United States. Int J Environ Res Public Health 15(4):616. 2018.
- National Center for Injury Prevention and Control. National action plan for child injury prevention. Atlanta, GA: Centers for Disease Control and Prevention. 2012.
- Alanazy ARM, Wark S, Fraser J, Nagle A. Factors impacting patient outcomes associated with use of emergency medical services operating in urban versus rural areas: A systematic review. Int J Environ Res Public Health 16(10):1728. 2019.
- Pressley JC, Hines LM, Bauer MJ, Oh SA, Kuhl JR, Liu C, et al. Using rural–urban continuum codes (RUCCS) to examine alcohol-related motor vehicle crash injury and enforcement in New York state. Int J Environ Res Public Health 16(8):1346. 2019.
- Miller KE, James HJ, Holmes GM, Van Houtven CH. The effect of rural hospital closures on emergency medical service response and transport times. Health Serv Res 55(2):288–300. 2020.
- Mohamoud YA, Kirby RS, Ehrenthal DB. County poverty, urban–rural classification, and the causes of term infant death: United States, 2012–2015. Public Health Rep 136(5):584–94. 2021.
- National Center for Health Statistics. Public-use data files: Mortality multiple cause files. 2018.
- National Center for Health Statistics. Tools and frameworks. 2021.
- Ingram DD, Franco SJ. 2013 NCHS urban–rural classification scheme for counties. National Center for Health Statistics. Vital Health Stat 2(166). 2014.
- Murphy SL, Xu JQ, Kochanek KD, Arias E, Tejada-Vera B. Deaths: Final data for 2018. National Vital Statistics Reports; vol 69 no 13. Hyattsville, MD: National Center for Health Statistics. 2021.
Suggested citation
Garnett MF, Spencer MR, Hedegaard H. Urban-rural differences in unintentional injury death rates among children aged 0–17 years: United States, 2018–2019. NCHS Data Brief, no 421. Hyattsville, MD: National Center for Health Statistics. 2021. DOI: https://dx.doi.org/10.15620/cdc:110040.
Copyright information
All material appearing in this report is in the public domain and may be reproduced or copied without permission; citation as to source, however, is appreciated.
National Center for Health Statistics
Brian C. Moyer, Ph.D., Director
Amy M. Branum, Ph.D., Associate Director for Science
Division of Analysis and Epidemiology
Irma E. Arispe, Ph.D., Director
Kevin C. Heslin, Ph.D., Associate Director for Science