Breakfast Intake Among Children and Adolescents: United States, 2015–2018
- Key findings
- What percentage of children and adolescents consumed breakfast on a given day in 2015–2018, and were there differences by sex and age?
- Were there differences in the percentage of children and adolescents who consumed breakfast on a given day by race and Hispanic origin and age in 2015–2018?
- Were there differences in the percentage of children and adolescents who consumed breakfast on a given day by income and age in 2015–2018?
- Which foods and beverages were most consumed for breakfast on a given day by children and adolescents in 2015–2018?
- Did the percentage of children and adolescents consuming breakfast on a given day change during the past 10 years?
- Summary
- Definitions
- Data source and methods
- About the authors
- References
- Suggested citation
PDF Version (428 KB) | Visual Abstract
Key findings
Data from the National Health and Nutrition Examination Survey
- In 2015–2018, 82.4% of children and adolescents consumed breakfast on a given day.
- The percentage of children and adolescents who consumed breakfast decreased with age, from 95.8% of children aged 2–5 years to 72.9% of adolescents aged 12–19 years.
- Breakfast consumption increased with increasing family income.
- Milk, cereal, and water were the most frequently consumed breakfast foods and beverages for children and adolescents aged 2–19 years.
- The percentage of children and adolescents who consumed breakfast did not change from 2009–2010 through 2017–2018.
The American Academy of Pediatrics recommends that children and adolescents consume breakfast for healthier body weights, improved nutrition, better memory, better test scores, and better attention spans (1). This report describes breakfast consumption among children and adolescents by sex, age, race and Hispanic origin, and family income level. Foods and beverages frequently consumed for breakfast, as well as trends in breakfast consumption over the last decade, are also reported.
Keywords: meals, youth, National Health and Nutrition Examination Survey (NHANES)
What percentage of children and adolescents consumed breakfast on a given day in 2015–2018, and were there differences by sex and age?
In 2015–2018, 82.4% of children and adolescents aged 2–19 years consumed breakfast on a given day, and no difference was observed by sex (Figure 1). Breakfast consumption declined with age. Almost 96% (95.8%) of children aged 2–5 years consumed breakfast, compared with 86.7% of children aged 6–11 years, and less than three-quarters of adolescents (72.9%) aged 12–19 years. The same pattern was observed in both boys and girls. No differences were observed by sex for any age group.
Figure 1. Percentage of children and adolescents aged 2–19 years consuming breakfast on a given day, by sex and age: United States, 2015–2018
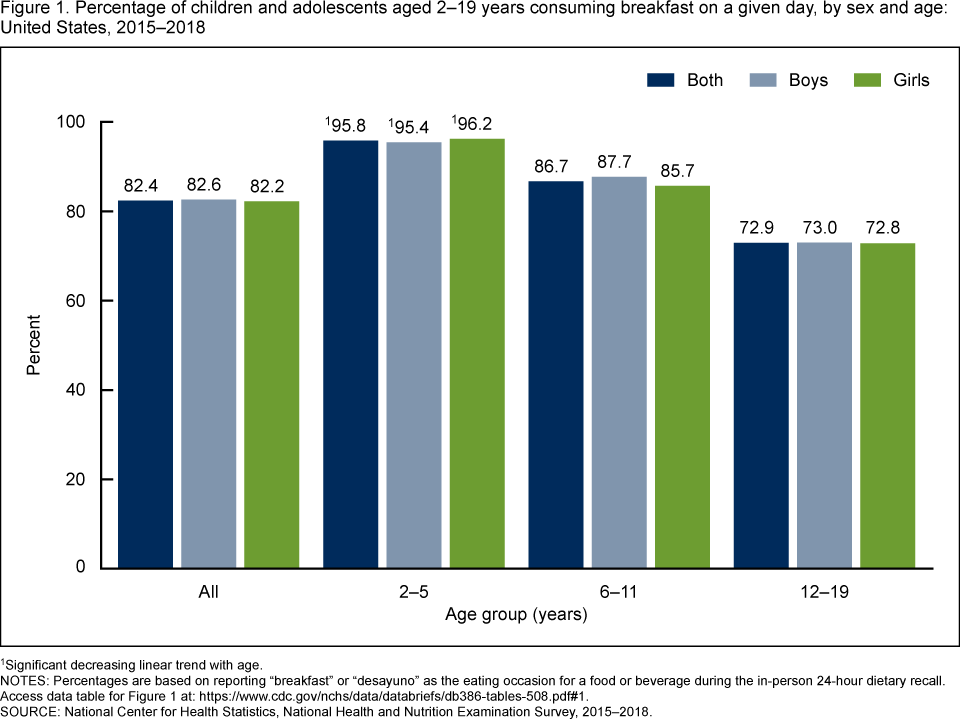
1Significant decreasing linear trend with age.
NOTES: Percentages are based on reporting “breakfast” or “desayuno” as the eating occasion for a food or beverage during the in-person 24-hour dietary recall. Access data table for Figure 1.
SOURCE: National Center for Health Statistics, National Health and Nutrition Examination Survey, 2015–2018.
Were there differences in the percentage of children and adolescents who consumed breakfast on a given day by race and Hispanic origin and age in 2015–2018?
Among all ages, a lower percentage of non-Hispanic black children and adolescents (77.8%) consumed breakfast on a given day compared with non-Hispanic white (84.5%) and non-Hispanic Asian (85.7%) children and adolescents (Figure 2). Fewer Hispanic (80.2%) children and adolescents reported consuming breakfast compared with non-Hispanic white and non-Hispanic Asian children and adolescents, but the difference between Hispanic and non-Hispanic black children and adolescents was not significant.
Among those aged 2–5 years, a lower percentage of non-Hispanic black children (91.0%) consumed breakfast, compared with non-Hispanic white (98.0%) and non-Hispanic Asian (97.8%) children. The observed differences between Hispanic children (93.8%) and other race and Hispanic-origin groups of the same age group was not significant. A similar pattern was observed for adolescents aged 12–19 years.
Among those aged 6–11 years, fewer non-Hispanic black children (84.8%) consumed breakfast, compared with non-Hispanic Asian children (93.7%). In addition, fewer Hispanic children (82.6%) consumed breakfast compared with non-Hispanic white (88.4%) and non-Hispanic Asian children.
A decreasing trend in breakfast consumption with age was observed in all race and Hispanic-origin groups.
Figure 2. Percentage of children and adolescents aged 2–19 years consuming breakfast on a given day, by age and race or Hispanic origin: United States, 2015–2018
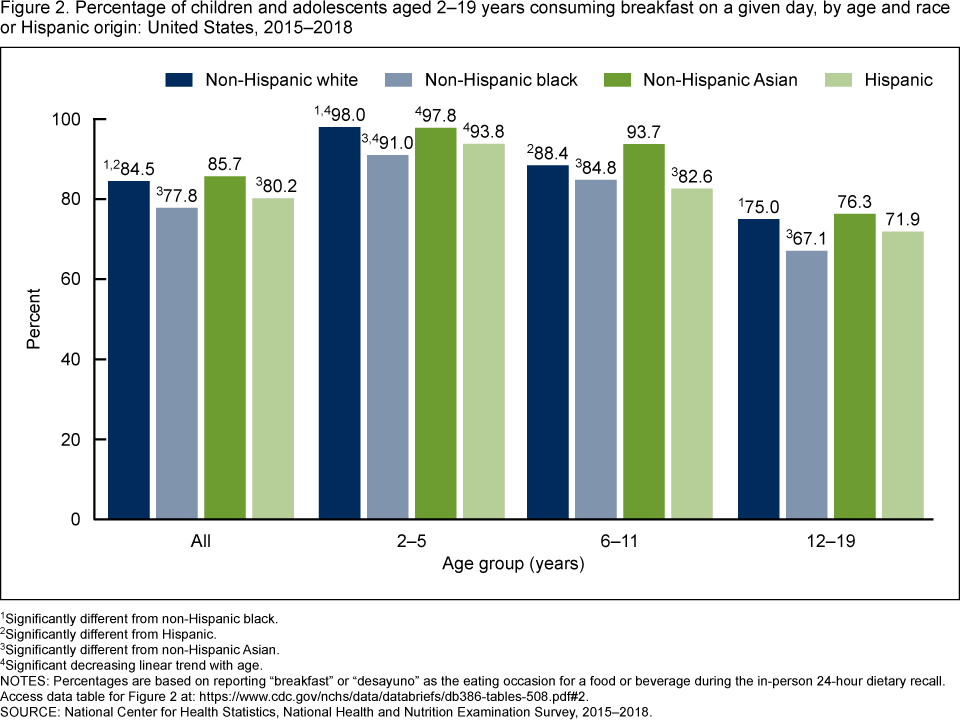
1Significantly different from non-Hispanic black.
2Significantly different from Hispanic.
3Significantly different from non-Hispanic Asian.
4Significant decreasing linear trend with age.
NOTES: Percentages are based on reporting “breakfast” or “desayuno” as the eating occasion for a food or beverage during the in-person 24-hour dietary recall. Access data table for Figure 2.
SOURCE: National Center for Health Statistics, National Health and Nutrition Examination Survey, 2015–2018.
Were there differences in the percentage of children and adolescents who consumed breakfast on a given day by income and age in 2015–2018?
The percentage of children and adolescents aged 2–19 years consuming breakfast on a given day increased with increasing levels of family income (Figure 3). Among families with incomes less than 100% of the federal poverty level (FPL), 78.4% of children and adolescents consumed breakfast, compared with 88.2% of those from families with incomes at or above 400% of FPL. Similar patterns were observed in children aged 2–11 years. Among adolescents aged 12–19 years, the percentage who consumed breakfast was higher among those in families at or above 400% of FPL (80.8%) compared with the three lower income groups (67.1%, 71.0%, and 68.9%, respectively).
A decreasing trend in breakfast consumption with age was observed in all income groups. Among the lowest income group, the percentage consuming breakfast decreased with age from 93.4% of children aged 2–5 years to 67.1% of adolescents aged 12–19 years, among children in families with incomes of 100% to less than 200% of FPL, 94.5% to 71.0%, among families with incomes between 200% to less than 400% of FPL, 97.2% to 68.9%, and in the highest income group (at or above 400% of FPL), from 99.0% to 80.8%.
Figure 3. Percentage of children and adolescents aged 2–19 years consuming breakfast on a given day, by age and income: United States, 2015–2018
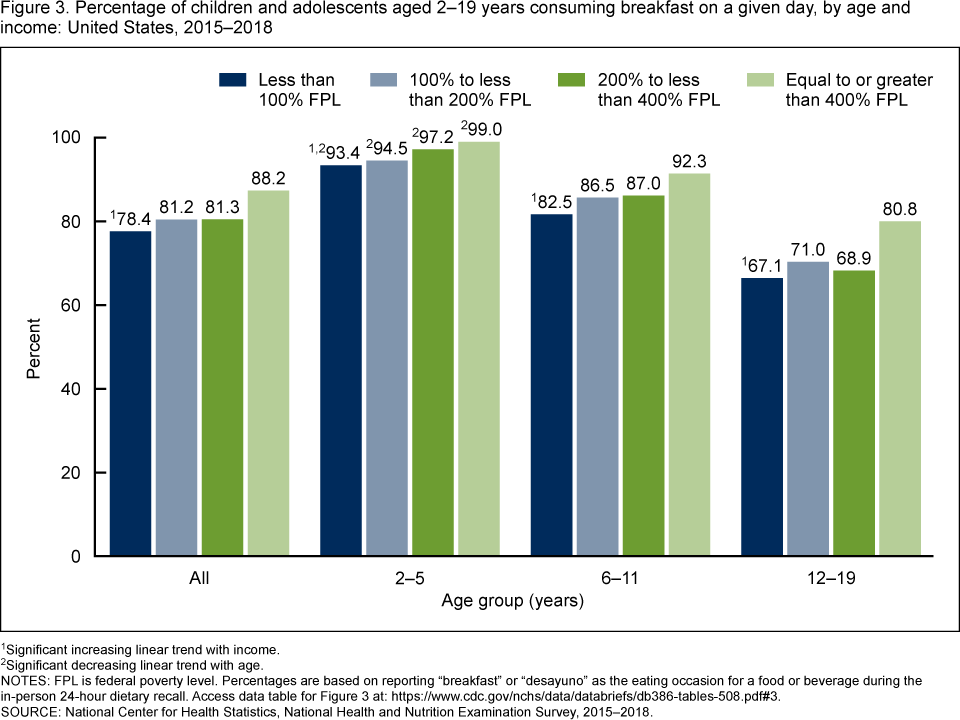
1Significant increasing linear trend with income.
2Significant decreasing linear trend with age.
NOTES: FPL is federal poverty level. Percentages are based on reporting “breakfast” or “desayuno” as the eating occasion for a food or beverage during the in-person 24-hour dietary recall. Access data table for Figure 3.
SOURCE: National Center for Health Statistics, National Health and Nutrition Examination Survey, 2015–2018.
Which foods and beverages were most consumed for breakfast on a given day by children and adolescents in 2015–2018?
The top five foods and beverages reported for breakfast varied slightly by age (Figure 4). Milk, cereal, and water were reported by all age groups. The remaining top five foods were pancakes, waffles, and French toast (15.5%) and eggs (14.6%), reported by children aged 2–5 years; 100% juice (15.3%) and pancakes (12.4%), reported by those aged 6–11 years; and 100% juice (8.9%) and eggs (8.8%), reported by adolescents.
Water was reported by approximately 20% of children and adolescents in the three age groups who reported consuming breakfast (19.2% of children aged 2–5 years; 19.5% of children aged 6–11 years; and 19.5% of adolescents aged 12–19).
Milk was reported for breakfast by children and adolescents in the three age groups: 59.7% of children aged 2–5 years, 47.3% of those aged 6–11 years, and 31.5% of adolescents aged 12–19.
Children and adolescents in all age groups reported consuming ready-to-eat cereal higher in sugar for breakfast: 26.8% of children aged 2–5 years, 26.1% of those aged 6–11 years, and 17.3% of adolescents aged 12–19.
Figure 4. Most consumed foods at breakfast on a given day among children and adolescents aged 2–19 years, by age: United States, 2015–2018
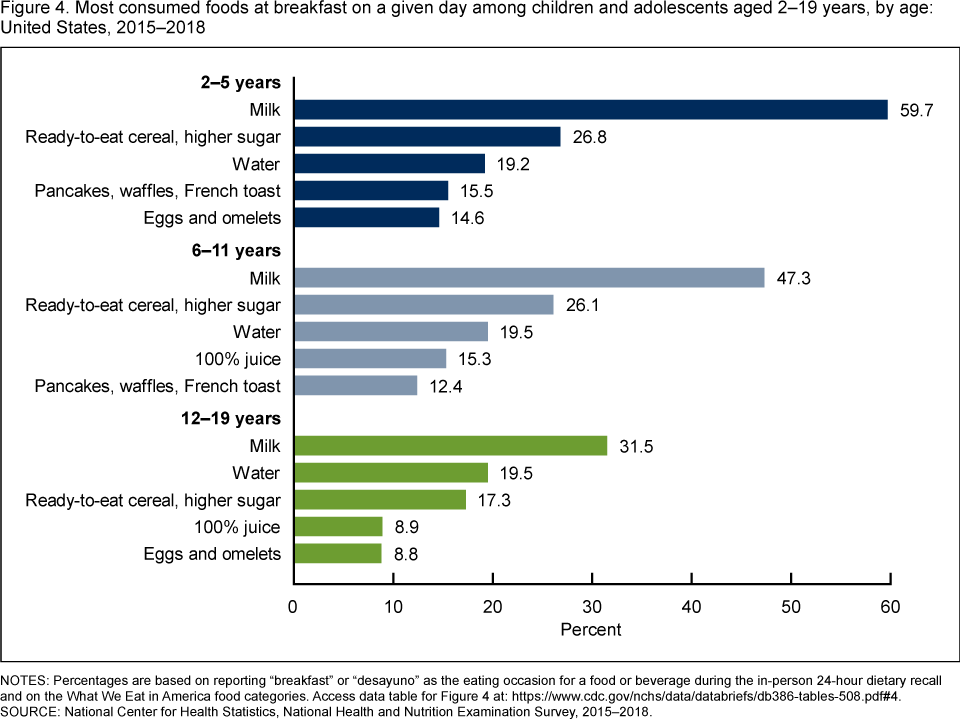
NOTES: Percentages are based on reporting “breakfast” or “desayuno” as the eating occasion for a food or beverage during the in-person 24-hour dietary recall and on the What We Eat in America food categories. Access data table for Figure 4.
SOURCE: National Center for Health Statistics, National Health and Nutrition Examination Survey, 2015–2018.
Did the percentage of children and adolescents consuming breakfast on a given day change during the past 10 years?
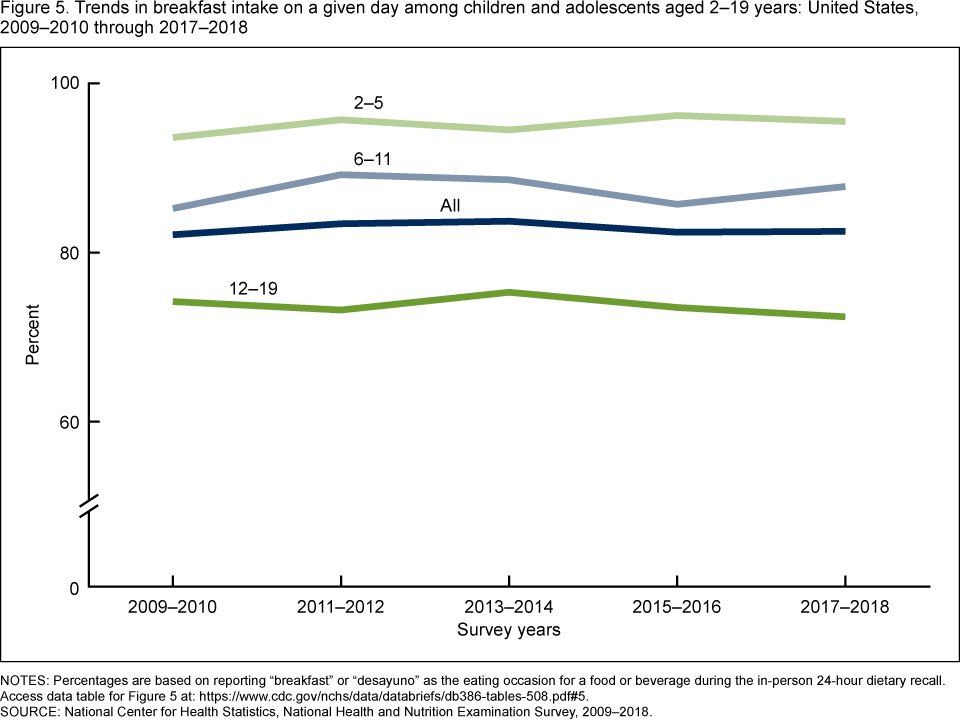
The percentage of children and adolescents aged 2–19 years who consumed breakfast on a given day was consistent between 2009–2010 (82.1%) and 2017–2018 (82.5%), among all ages and for any age group (Figure 5).
Figure 5. Trends in breakfast intake on a given day among children and adolescents aged 2–19 years: United States, 2009–2010 through 2017–2018
NOTES: Percentages are based on reporting “breakfast” or “desayuno” as the eating occasion for a food or beverage during the in-person 24-hour dietary recall. Access data table for Figure 5.
SOURCE: National Center for Health Statistics, National Health and Nutrition Examination Survey, 2009–2018.
Summary
In 2015–2018, 82.4% of children and adolescents reported consuming breakfast. Breakfast consumption was generally lower among non-Hispanic black children and adolescents. An increase in breakfast consumption was observed as family income increased. Among children and adolescents who reported eating breakfast, milk was the most reported breakfast food or beverage among all age groups; however, consumption declined with age. Approximately 20% of children and adolescents in each age group reported drinking water for breakfast. No change was observed in the percentage of children and adolescents consuming breakfast on a given day over the decade from 2009–2010 to 2017–2018. The results from this brief demonstrate that approximately 20% of children and adolescents did not report eating breakfast on a given day.
Definitions
Breakfast consumers: Children and adolescents (or their proxies) who reported “breakfast” or “desayuno” as the eating occasion for a food or beverage during the in-person 24-hour dietary recall.
Food categories: Foods and beverages were grouped using the U.S. Department of Agriculture’s What We Eat in America Food Categories (2). All foods or beverages reported for breakfast were included in this analysis.
Milk: Includes flavored varieties, dairy milk substitutes (such as soy or almond milks), and milk consumed as part of a combination food (e.g., milk added to cereal).
Ready-to-eat cereal, higher sugar: Includes higher sugar ready-to-eat cereal, greater than 21.2g/100g (2).
Water: Includes tap, bottled, carbonated, non-carbonated, flavored, and unflavored.
Pancakes, waffles, French toast: Includes pancakes, waffles, and French toast.
Eggs and omelets: Includes eggs and omelets.
100% juice: Includes citrus juice, apple juice, other fruit juice, and vegetable juice.
Federal poverty level (FPL): Levels are based on the income to poverty ratio, a measure of the annual total family income divided by the U.S. Department of Health and Human Services’ poverty guidelines, after accounting for inflation and family size (3).
Data source and methods
The National Health and Nutrition Examination Survey (NHANES) is a cross-sectional survey conducted by the National Center for Health Statistics designed to monitor the health and nutritional status of the civilian noninstitutionalized U.S. population (3). It consists of home interviews followed by standardized physical examinations conducted in mobile examination centers (MECs). For this report, dietary data collected through an in-person 24-hour dietary recall using the U.S. Department of Agriculture’s Automated Multiple Pass Method (AMPM) were analyzed. For children aged 2–5 years, the dietary recall was provided by a proxy. For children aged 6–11 years, the recall was assisted by a proxy, and for adolescents aged 12–19 the recall was self-reported. Limitations associated with 24-hour recalls, such as misreporting, have been described (4). Despite these limitations, dietary recall data have utility in describing population level estimates (5,6).
The NHANES sample is selected through a complex, multistage probability design. In 2015–2018, non-Hispanic black, non-Hispanic Asian, and Hispanic persons were oversampled. For more information, visit the NHANES website. Race- and Hispanic origin-specific estimates reflect individuals reporting only one race; those reporting more than one race are included in the total but are not reported separately.
Day 1 dietary weights were used to account for differential probabilities of selection, nonresponse, and noncoverage. Differences between groups were tested using a univariate t statistic. Test for linear trends by age and over time were evaluated using orthogonal polynomials. The significance level for statistical testing was set at p < 0.05. All differences reported are statistically significant unless otherwise indicated. Data management and statistical analyses were conducted using SAS System for Windows version 9.4 (SAS Institute, Inc., Cary, N.C.) and SUDAAN version 11.0 (RTI International, Research Triangle Park, N.C.).
About the authors
Ana L. Terry, Edwina Wambogo, Nicholas Ansai, and Namanjeet Ahluwalia are with CDC’s National Center for Health Statistics (NCHS), Division of Health and Nutrition Examination Surveys.
References
- American Academy of Pediatrics HealthyChildren.org.
- U.S. Department of Agriculture, Agricultural Research Service. 2020. What We Eat in America Food Categories 2017–2018.
- Chen TC, Clark J, Riddles MK, Mohadjer LK, Fakhouri THI. National Health and Nutrition Examination Survey, 2015–2018: Sample design and estimation procedures. National Center for Health Statistics. Vital Health Stat 2(184). 2020.
- Subar AF, Freedman LS, Tooze JA, Kirkpatrick SI, Boushey C, Neuhouser ML, et al. Addressing current criticism regarding the value of self-report dietary data. J Nutr 145(12):2639–45. 2015.
- Ahluwalia N, Dwyer J, Terry A, Moshfegh A, Johnson C. Update on NHANES dietary data: Focus on collection, release, analytical considerations, and uses to inform public policy. Adv Nutr 7(1):121–34. 2016.
- Hébert JR, Hurley TG, Steck SE, Miller DR, Tabung FK, Peterson KE, et al. Considering the value of dietary assessment data in informing nutrition-related health policy. Adv Nutr 5(4):447–55. 2014.
Suggested citation
Terry AL, Wambogo E, Ansai N, Ahluwalia N. Breakfast intake among children and adolescents: United States, 2015–2018. NCHS Data Brief, no 386. Hyattsville, MD: National Center for Health Statistics. 2020.
Copyright information
All material appearing in this report is in the public domain and may be reproduced or copied without permission; citation as to source, however, is appreciated.
National Center for Health Statistics
Brian C. Moyer, Ph.D., Director
Amy M. Branum, Ph.D., Acting Associate Director for Science
Division of Health and Nutrition Examination Surveys
Ryne Paulose-Ram, M.A., Ph.D., Acting Director
Lara Akinbami, M.D., Acting Associate Director for Science