Symptoms of Depression Among Adults: United States, 2019
- Key findings
- In 2019, 18.5% of adults had symptoms of depression that were either mild, moderate, or severe in the past 2 weeks.
- Severity of depression symptoms in the past 2 weeks varied by age.
- Women were more likely than men to experience mild, moderate, and severe depression symptoms in the past 2 weeks.
- The percentage of adults who experienced depression symptoms in the past 2 weeks varied by Hispanic origin and race.
- Summary
- Definitions
- Data source and methods
- About the authors
- References
- Suggested citation
PDF Version (500 KB) | Visual Abstract
Key findings
Data from the National Health Interview Survey
- In 2019, 2.8% of adults experienced severe symptoms of depression, 4.2% experienced moderate symptoms, and 11.5% experienced mild symptoms in the past 2 weeks.
- The percentage of adults who experienced any symptoms of depression was highest among those aged 18–29 (21.0%), followed by those aged 45–64 (18.4%) and 65 and over (18.4%), and lastly, by those aged 30–44 (16.8%).
- Women were more likely than men to experience mild, moderate, or severe symptoms of depression.
- Non-Hispanic Asian adults were least likely to experience mild, moderate, or severe symptoms of depression compared with Hispanic, non-Hispanic white, and non-Hispanic black adults.
Depression is characterized by the presence of feelings of sadness, emptiness, or irritability, accompanied by bodily and cognitive changes lasting at least 2 weeks that significantly affect the individual’s capacity to function (1). The eight-item Patient Health Questionnaire (PHQ–8) is a validated diagnostic and severity measure of symptoms of depressive disorders (2,3). Adults with scores of 0–4 are considered to have no or minimal symptoms of depression, while those with scores of 5–9, 10–14, or 15–24 are considered to have mild, moderate, or severe symptoms, respectively (2,3). This report examines the percentage of adults aged 18 and over with symptoms of depression in the past 2 weeks in 2019, by symptom severity and select demographic characteristics, using the PHQ–8 scale.
Keywords: depressive disorder, mental health, PHQ–8, National Health Interview Survey
In 2019, 18.5% of adults had symptoms of depression that were either mild, moderate, or severe in the past 2 weeks.
- During 2019, 81.5% of adults aged 18 and over experienced no or minimal symptoms of depression in the past 2 weeks (Figure 1).
- Among adults, 11.5% experienced mild symptoms of depression, 4.2% experienced moderate symptoms, and 2.8% experienced severe symptoms.
Figure 1. Percent distribution of severity of depression symptoms in the past 2 weeks among adults aged 18 and over: United States, 2019
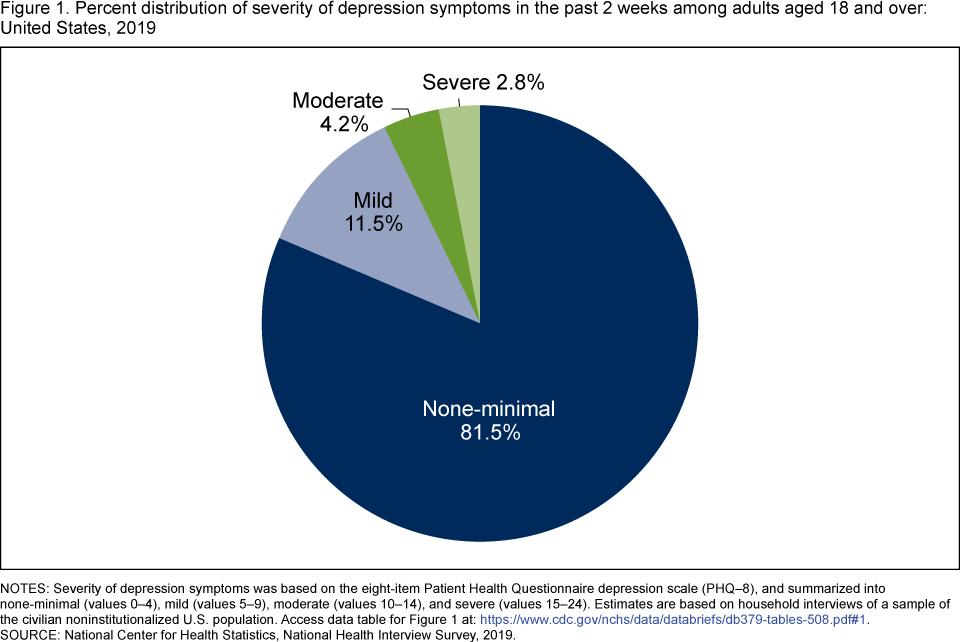
NOTES: Severity of depression symptoms was based on the eight-item Patient Health Questionnaire depression scale (PHQ–8), and summarized into none-minimal (values 0–4), mild (values 5–9), moderate (values 10–14), and severe (values 15–24). Estimates are based on household interviews of a sample of the civilian noninstitutionalized U.S. population. Access data table for Figure 1.
SOURCE: National Center for Health Statistics, National Health Interview Survey, 2019.
Severity of depression symptoms in the past 2 weeks varied by age.
- The total percentage of adults who experienced symptoms of depression that were either mild, moderate, or severe in the past 2 weeks was highest among those aged 18–29 (21.0%) and lowest among those aged 30–44 (16.8%) (Figure 2).
- The percentage of adults who experienced mild depression symptoms was highest among those aged 18–29 (13.9%), followed by those aged 65 and over (12.0%), and lowest among those aged 45–64 (10.7%) and 30–44 (10.3%).
- The percentage of adults who experienced moderate depression symptoms was higher among those aged 45–64 (4.5%) compared with those aged 30–44 (3.8%) and those aged 65 and over (3.8%). The observed difference between adults aged 18–29 (4.4%) and the older age groups was not significant.
- The percentage of adults who experienced severe depression symptoms did not vary significantly by age and was 2.7% among those aged 18–29, 2.7% among those aged 30–44, 3.1% among those aged 45–65, and 2.6% among those aged 65 and over.
Figure 2. Percentage of adults aged 18 and over with symptoms of depression in the past 2 weeks, by symptom severity and age group: United States, 2019

1Significant quadratic trend (p < 0.05).
2Significant cubic trend (p < 0.05).
NOTES: Severity of depression symptoms was based on the eight-item Patient Health Questionnaire depression scale (PHQ–8), and summarized into none-minimal (values 0–4), mild (values 5–9), moderate (values 10–14), and severe (values 15–24). Those categorized as having no or minimal symptoms of depression are not shown in this figure. Any severity includes those categorized as having either mild, moderate, or severe symptoms of depression in the past 2 weeks. Estimates are based on household interviews of a sample of the civilian noninstitutionalized U.S. population. Access data table for Figure 2.
SOURCE: National Center for Health Statistics, National Health Interview Survey, 2019.
Women were more likely than men to experience mild, moderate, and severe depression symptoms in the past 2 weeks.
- In 2019, 21.8% of women experienced depression symptoms in the past 2 weeks that were either mild, moderate, or severe, which was higher than men (15.0%) (Figure 3).
- Women were more likely than men to have experienced depression symptoms that were mild (13.4% and 9.6%, respectively), moderate (4.9% and 3.4%, respectively), and severe (3.5% and 2.1%, respectively).
Figure 3. Percentage of adults aged 18 and over with symptoms of depression in the past 2 weeks, by symptom severity and sex: United States, 2019

1Significantly different from women (p < 0.05).
NOTES: Severity of depression symptoms was based on the eight-item Patient Health Questionnaire depression scale (PHQ–8), and summarized into none-minimal (values 0–4), mild (values 5–9), moderate (values 10–14), and severe (values 15–24). Those categorized as having no or minimal symptoms of depression are not shown in this figure. Any severity includes those categorized as having either mild, moderate, or severe symptoms of depression in the past 2
weeks. Estimates are based on household interviews of a sample of the civilian noninstitutionalized U.S. population. Access data table for Figure 3.
SOURCE: National Center for Health Statistics, National Health Interview Survey, 2019.
The percentage of adults who experienced depression symptoms in the past 2 weeks varied by Hispanic origin and race.
- Non-Hispanic white (19.3%) and non-Hispanic black (19.3%) adults were the most likely to have experienced any severity of depression symptoms in the past 2 weeks, followed by Hispanic (16.9%) adults, while non-Hispanic Asian (10.2%) adults were least likely (Figure 4).
- Non-Hispanic white (12.0%) and non-Hispanic black (12.2%) adults were the most likely to have experienced mild depression symptoms in the past 2 weeks, followed by Hispanic (10.2%) adults, while non-Hispanic Asian (7.9%) adults were least likely.
- Non-Hispanic Asian (1.2%) adults were least likely to have experienced moderate depression symptoms, compared with non-Hispanic black (4.6%), non-Hispanic white (4.4%), and Hispanic (4.0%) adults.
- Non-Hispanic Asian (1.2%) adults were least likely to have experienced severe depression symptoms, compared with non-Hispanic white (2.9%), Hispanic (2.7%), and non-Hispanic black (2.5%) adults.
Figure 4. Percentage of adults aged 18 and over with symptoms of depression in the past 2 weeks, by symptom severity and race and Hispanic origin: United States, 2019

1Significantly different from non-Hispanic white (p < 0.05).
2Significantly different from non-Hispanic black (p < 0.05).
3Significantly different from non-Hispanic Asian (p < 0.05).
NOTES: Severity of depression symptoms was based on the eight-item Patient Health Questionnaire depression scale (PHQ–8), and summarized into none-minimal (values 0–4), mild (values 5–9), moderate (values 10–14), and severe (values 15–24). Those categorized as having no or minimal symptoms of depression are not shown in this figure. Any severity includes those categorized as having either mild, moderate, or severe symptoms of depression in the past 2 weeks. Estimates are based on household interviews of a sample of the civilian noninstitutionalized U.S. population. Access data table for Figure 4.
SOURCE: National Center for Health Statistics, National Health Interview Survey, 2019.
Summary
During 2019, approximately one in five (18.5%) adults aged 18 and over experienced any symptoms of depression in the past 2 weeks, with 11.5% experiencing mild symptoms, 4.2% experiencing moderate symptoms, and 2.8% experiencing severe symptoms.
Women were more likely than men to experience symptoms of depression across all severity levels. While there was no significant trend by age among adults experiencing severe symptoms of depression, adults aged 18–29 and those aged 65 and over were most likely to experience mild symptoms of depression. A higher percentage of adults aged 45–64 experienced moderate symptoms of depression compared with those aged 30–44 and 65 and over. Adults aged 18–29 were as likely to experience moderate symptoms of depression as those aged 45–64, but the observed differences with the other age groups were not significant. Non-Hispanic white and non-Hispanic black adults were most likely to experience mild symptoms of depression, compared with Hispanic and non-Hispanic Asian adults. Non-Hispanic Asian adults were least likely to experience mild, moderate, or severe symptoms of depression, compared with Hispanic, non-Hispanic white, and non-Hispanic black adults.
The PHQ–8 scale is a valid screening and diagnostic measure for depressive disorders with a score of 10 or higher corresponding to moderate and severe symptoms and indicative of current depression (3). Based on responses to the PHQ–8 scale, 7.0% of adults aged 18 and over had scores of 10 or higher.
Definitions
Race and Hispanic origin: Based on responses to two questions that determine Hispanic or Latino origin and race. Adults categorized as Hispanic may be of any race or combination of races. Adults categorized as non-Hispanic white, non-Hispanic black, and non-Hispanic Asian indicated one race only.
Severity of depression symptoms: Based on the eight-item Patient Health Questionnaire depression scale (PHQ–8) and summarized into no or minimal (values 0–4), mild (values 5–9), moderate (values 10–14), and severe (values 15–24) symptoms of depression (2,3). Sample adults were asked how often they have been bothered by the following symptoms in the past 2 weeks: “Little interest or pleasure in doing things;” “Feeling down, depressed, or hopeless;” “Trouble falling or staying asleep, or sleeping too much;” “Feeling tired or having little energy;” “Poor appetite or overeating;” “Feeling bad about yourself, or that you are a failure, or have let yourself or your family down;” “Trouble concentrating on things, such as reading the newspaper or watching television;” and “Moving or speaking so slowly that other people could have noticed? Or the opposite, being so fidgety or restless that you have been moving around a lot more than usual.” Response options were “not at all,” “several days,” “more than half the days,” and “nearly every day,” scored as 0 to 3 points, respectively, and then summed into a total score. Sample adults with two or more PHQ–8 questions answered as “refused,” “don’t know,” or whose answers were not ascertained, were not included in this analysis.
Data source and methods
Data from the 2019 National Health Interview Survey (NHIS) data were used for this analysis. NHIS is a nationally representative multipurpose health survey of the civilian noninstitutionalized U.S. population. It is conducted continuously throughout the year by the National Center for Health Statistics (NCHS). Interviews are conducted in the respondent’s home, but follow-ups to complete interviews may be conducted by telephone when necessary. For more information about NHIS, visit: https://www.cdc.gov/nchs/nhis.htm.
Point estimates and the corresponding variances were calculated using SAS-callable SUDAAN version 11.0 (4) to account for the complex sample design of NHIS. Linear, quadratic, and cubic trends by age were evaluated using orthogonal polynomials in logistic regression. Differences between percentages were evaluated using two-sided significance tests at the 0.05 level. All estimates presented meet NCHS data presentation standards for proportions (5).
About the authors
Maria A. Villarroel and Emily P. Terlizzi are with the National Center for Health Statistics, Division of Health Interview Statistics.
References
- American Psychiatric Association. Diagnostic and statistical manual of mental disorders (DSM–5). 5th ed. Arlington, VA. 2013.
- Kroenke K, Spitzer RL. The PHQ–9: A new depression diagnostic and severity measure. Psychiatric Annals 32:509–21. 2002.
- Kroenke K, Strine TW, Spitzer RL, Williams JB, Berry JT, Mokdad AH. The PHQ–8 as a measure of current depression in the general population. J Affect Disord 114(1–3):163–73. 2009.
- RTI International. SUDAAN (Release 11.0.3) [computer software]. 2018.
- Parker JD, Talih M, Malec DJ, Beresovsky V, Carroll M, Gonzalez JF Jr, et al. National Center for Health Statistics data presentation standards for proportions. National Center for Health Statistics. Vital Health Stat 2(175). 2017.
Suggested citation
Villarroel MA, Terlizzi EP. Symptoms of depression among adults: United States, 2019. NCHS Data Brief, no 379. Hyattsville, MD: National Center for Health Statistics. 2020.
Copyright information
All material appearing in this report is in the public domain and may be reproduced or copied without permission; citation as to source, however, is appreciated.
National Center for Health Statistics
Brian C. Moyer, Ph.D., Director
Amy M. Branum, Ph.D., Acting Associate Director for Science
Division of Health Interview Statistics
Stephen J. Blumberg, Ph.D., Director
Anjel Vahratian, Ph.D., M.P.H., Associate Director for Science