Attempts to Lose Weight Among Adults in the United States, 2013–2016
- Key findings
- What percentage of adults tried to lose weight in 2013–2016?
- Were there differences in the percentage of adults who tried to lose weight by race and Hispanic origin in 2013–2016?
- Were there differences in the percentage of adults who tried to lose weight by family income in 2013–2016?
- Were there differences in the percentage of adults who tried to lose weight, by weight status in 2013–2016?
- What ways to lose weight were reported by adults who tried to lose weight in 2013–2016?
- Summary
- Definitions
- Data source and methods
- About the authors
- References
- Suggested citation
PDF Version (503 KB)
Crescent B. Martin, M.P.H., M.A., Kirsten A. Herrick, Ph.D., M.Sc., Neda Sarafrazi, Ph.D., and Cynthia L. Ogden, Ph.D., M.R.P.
Key findings
Data from the National Health and Nutrition Examination Survey
- In 2013–2016, 49.1% of U.S. adults tried to lose weight in the last 12 months.
- A higher percentage of women (56.4%) than men (41.7%) tried to lose weight.
- A lower percentage of non-Hispanic Asian adults (41.4%) than non-Hispanic white (49.4%), non-Hispanic black (48.0%), and Hispanic (49.1%) adults tried to lose weight.
- The percentage of adults who tried to lose weight increased with family income and with weight status category.
- Among adults who tried to lose weight, the most commonly reported methods were exercising (62.9%) and eating less food (62.9%), followed by consuming more fruits, vegetables, and salads (50.4%).
Almost 40% of adults in the United States had obesity in 2015–2016 (1). Obesity is associated with a range of serious health risks (2). Individuals may have multiple motivations for trying to losing weight, including health and appearance reasons (3). This report describes the percentage of U.S. adults who tried to lose weight in the past year by sex, age, race and Hispanic origin, family income, and weight status, based on data collected in the National Health and Nutrition Examination Survey (NHANES) from 2013–2016.
Keywords: National Health and Nutrition Examination Survey, weight loss, NHANES
What percentage of adults tried to lose weight in 2013–2016?
- Nearly one-half (49.1%) of adults tried to lose weight within the last 12 months (Figure 1).
- A lower percentage of older adults aged 60 and over (42.7%) tried to lose weight than younger adults aged 20–39 (49.7%) and middle-aged adults aged 40–59 (52.4%). No significant difference was observed between younger and middle-aged adults.
- Among women, the pattern by age was similar to the overall adult population. Among men, no significant differences were observed by age group.
- A higher percentage of women (56.4%) than men (41.7%) tried to lose weight, overall and within each age group.
Figure 1. Percentage of adults aged 20 and over who tried to lose weight, by sex and age: United States, 2013–2016

1Significantly different from those aged 60 and over.
2Significantly different from women of the same age group.
NOTES: Estimates for adults aged 20 and over were age adjusted by the direct method to the 2000 U.S. census population using the age groups 20–39, 40–59, and 60 and over. Crude estimates are 48.7% for total, 41.6% for men, and 55.4% for women. Access data table for Figure 1.
SOURCE: NCHS, National Health and Nutrition Examination Survey, 2013–2016.
Were there differences in the percentage of adults who tried to lose weight by race and Hispanic origin in 2013–2016?
- The percentage of non-Hispanic Asian adults (41.4%) who tried to lose weight was lower compared with non-Hispanic white (49.4%), non-Hispanic black (48.0%), and Hispanic (49.1%) adults (Figure 2).
- The pattern among women was similar to the overall adult population. A lower percentage of non-Hispanic Asian women (44.8%) tried to lose weight than did non-Hispanic white (56.9%), non-Hispanic black (56.4%), and Hispanic (57.2%) women.
- Among men, the percentage who tried to lose weight was lower among non-Hispanic black (37.9%) than non-Hispanic white (42.1%) or Hispanic (41.1%) men.
- Within each race and Hispanic-origin group, a higher percentage of women than men tried to lose weight.
Figure 2. Age-adjusted percentage of adults aged 20 and over who tried to lose weight, by sex and race and Hispanic origin: United States, 2013–2016

1Significantly different from non-Hispanic white persons.
2Significantly different from non-Hispanic black persons.
3Significantly different from Hispanic persons.
4Significantly different from women of the same race and Hispanic origin.
NOTES: All estimates are age adjusted by the direct method to the 2000 U.S. census population using the age groups 20–39, 40–59, and 60 and over. Access data table for Figure 2.
SOURCE: NCHS, National Health and Nutrition Examination Survey, 2013–2016.
Were there differences in the percentage of adults who tried to lose weight by family income in 2013–2016?
- The percentage of adults who tried to lose weight increased with family income level.
- Overall, 53.7% of adults with higher family income (greater than 350% of federal poverty level [FPL]), 48.7% of adults with middle family income (greater than 130% to less than or equal to 350% of FPL), and 42.9% of adults with lower family income (less than or equal to 130% of FPL) tried to lose weight (Figure 3).
- Similar patterns were observed among both men and women.
- Within each income group, a higher percentage of women than men tried to lose weight.
Figure 3. Age-adjusted percentage of adults aged 20 and over who tried to lose weight, by sex and family income: United States, 2013–2016

1Significant increasing linear trend.
2Significantly different from women in same family income level.
NOTES: FPL is federal poverty level. All estimates are age adjusted by the direct method to the 2000 U.S. census population using the age groups 20–39, 40–59, and 60 and over. Access data table for Figure 3.
SOURCE: NCHS, National Health and Nutrition Examination Survey, 2013–2016.
Were there differences in the percentage of adults who tried to lose weight, by weight status in 2013–2016?
- The percentage of adults who tried to lose weight increased with weight status category, overall and among both men and women.
- Overall, 66.7% of adults with obesity, 49.0% of overweight adults, and 26.5% of underweight or normal weight adults tried to lose weight (Figure 4).
- Within each weight status category, a higher percentage of women than men tried to lose weight.
Figure 4. Age-adjusted percentage of adults aged 20 and over who tried to lose weight, by sex and weight status: United States, 2013–2016
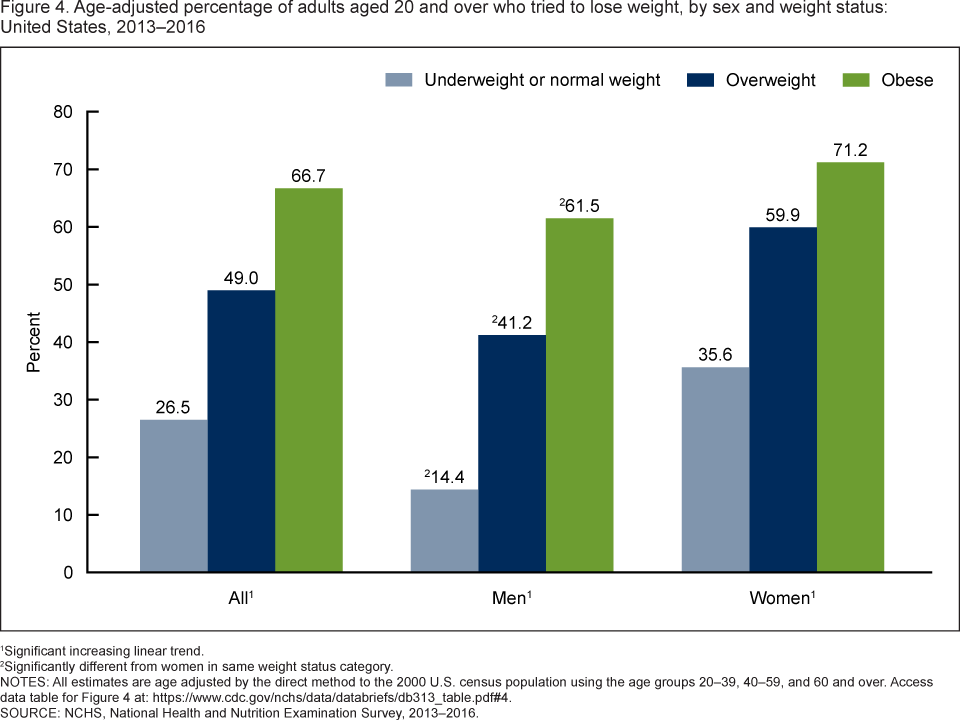
1Significant increasing linear trend.
2Significantly different from women in same weight status category.
NOTES: All estimates are age adjusted by the direct method to the 2000 U.S. census population using the age groups 20–39, 40–59, and 60 and over. Access data table for Figure 4.
SOURCE: NCHS, National Health and Nutrition Examination Survey, 2013–2016.
What ways to lose weight were reported by adults who tried to lose weight in 2013–2016?
Among adults who tried to lose weight, the most commonly reported ways were exercising (62.9%); eating less food (62.9%); eating more fruits, vegetables, and salads (50.4%); drinking a lot of water (44.7%); and eating less junk food or fast food (42.4%) (Figure 5).
Figure 5. Ways of trying to lose weight used by adults aged 20 and over who tried to lose weight: United States, 2013–2016

NOTES: Respondents could report multiple ways to lose weight; 88.3% of adults who tried to lose weight reported using two or more ways. Ways reported by less than 10% of adults who tried to lose weight are not shown separately. Access data table for Figure 5.
SOURCE: NCHS, National Health and Nutrition Examination Survey, 2013–2016.
Summary
In 2013–2016, almost one-half of U.S. adults tried to lose weight within the last year. A higher percentage of younger adults aged 20–39 and middle-aged adults aged 40–59 tried to lose weight, compared with older adults aged 60 and older. A higher percentage of women than men tried to lose weight, overall and within each age group.
Patterns by race and Hispanic origin differed between men and women. Among women, a lower percentage of non-Hispanic Asian women tried to lose weight, compared with all other race and Hispanic-origin groups. Among men, a lower percentage of non-Hispanic black men tried to lose weight than did non-Hispanic white men or Hispanic men.
The percentage of adults who tried to lose weight increased with family income and with weight status. Among adults who tried to lose weight, the most commonly reported ways were exercising (62.9%) and eating less food (62.9%). A majority of adults who tried to lose weight reported using two or more methods (88.3%).
Definitions
Tried to lose weight: Based on two questions. Participants whose self-reported current weight was at least 10 pounds lower than their reported weight a year ago were asked if that weight change was intentional; those who answered yes were categorized as having tried to lose weight. All other participants, including those who reported an unintentional weight loss of 10 pounds or more, were asked directly, “During the past 12 months, have you tried to lose weight?”
Federal poverty level (FPL): Based on the income-to-poverty ratio, a measure of the annual total family income divided by the poverty guidelines, adjusted for family size and inflation.
Weight status: Body mass index (BMI) was calculated as measured weight in kilograms divided by measured height in meters squared, rounded to one decimal place. Overweight was defined as a BMI greater than or equal to 25 and less than 30. Obesity was defined as a BMI greater than or equal to 30. Normal or underweight was defined as a BMI less than 25.
Data source and methods
NHANES is a cross-sectional survey conducted by the National Center for Health Statistics designed to monitor the health and nutritional status of the civilian noninstitutionalized U.S. population (4). It consists of home interviews followed by standardized physical examinations, including measured height and weight, in mobile examination centers.
The NHANES sample is selected through a complex, multistage probability design. In 2013–2016, non-Hispanic black, non-Hispanic Asian, and Hispanic persons were oversampled; for more information, visit the NHANES website. Race and Hispanic origin-specific estimates reflect individuals reporting only one race; those reporting more than one race are included in the total but are not reported separately. Pregnant females were excluded from analyses.
Examination weights were used to account for the differential probabilities of selection, nonresponse, and noncoverage. Taylor series linearization was used to compute variance estimates. Prevalence estimates for the adult population aged 20 and over were age adjusted using the direct method to the 2000 projected U.S. census population using the age groups 20–39, 40–59, and 60 and over. Differences between groups were tested using a univariate t statistic. Test for trends by family income and weight status were evaluated using orthogonal polynomials to determine linear trends. The significance level for statistical testing was set at p < 0.05. All differences reported are statistically significant unless otherwise indicated. Data management and statistical analyses were conducted using SAS System for Windows version 9.4 (SAS Institute, Inc., Cary, N.C.) and SUDAAN version 11.0 (RTI International, Research Triangle Park, N.C.).
About the authors
Crescent B. Martin was a student volunteer with CDC’s National Center for Health Statistics, Division of Health and Nutrition Examination Surveys and a graduate student at the George Washington University Milken Institute School of Public Health during the analysis and writing of this report. Kirsten A. Herrick, Neda Sarafrazi, and Cynthia L. Ogden are with the National Center for Health Statistics, Division of Health and Nutrition Examination Surveys.
References
- Hales CM, Carroll MD, Fryar CD, Ogden CL. Prevalence of obesity among adults and youth: United States, 2015–2016. NCHS Data brief, no 288. Hyattsville, MD: National Center for Health Statistics. 2017.
- National Institutes of Health. National Heart, Lung, and Blood Institute. Clinical guidelines on the identification, evaluation, and treatment of overweight and obesity in adults—The evidence report. Obes Res 6(Suppl 2):51s–209. 1998.
- Levy AS, Heaton AW. Weight control practices of U.S. adults trying to lose weight. Ann Intern Med 119(7 Pt 2):661–6. 1993.
- Johnson CL, Dohrmann SM, Burt VL, Mohadjer LK. National Health and Nutrition Examination Survey: Sample design, 2011–2014. National Center for Health Statistics. Vital Health Stat 2(162). 2014.
Suggested citation
Martin CB, Herrick KA, Sarafrazi N, Ogden CL. Attempts to lose weight among adults in the United States, 2013–2016. NCHS Data Brief, no 313. Hyattsville, MD: National Center for Health Statistics. 2018.
Copyright information
All material appearing in this report is in the public domain and may be reproduced or copied without permission; citation as to source, however, is appreciated.
National Center for Health Statistics
Charles J. Rothwell, M.S., M.B.A., Director
Jennifer H. Madans, Ph.D., Associate Director for Science
Division of Health and Nutrition Examination Surveys
Kathryn S. Porter, M.D., M.S., Director
Ryne Paulose-Ram, M.A., Ph.D., Associate Director for Science