Variation in Adult Day Services Center Participant Characteristics, by Center Ownership: United States, 2016
- Key findings
- The racial and ethnic composition of participants in adult day services centers varied by center ownership.
- Selected sociodemographic characteristics of adult day services center participants differed by center ownership.
- The prevalence of selected diagnosed medical conditions among adult day services center participants differed by center ownership.
- Nonprofit adult day services centers had a higher percentage of participants needing assistance with selected activities of daily living (ADLs) than for-profit centers.
- The prevalence of emergency department visits, discharges from overnight hospital stays, and falls among adult day services center participants differed by center ownership.
- Summary
- Definitions
- Data source and methods
- About the authors
- References
- Suggested citation
NCHS Data Brief No. 296, February 2018
PDF Version (357 KB)
Jessica Penn Lendon, Ph.D., and Vincent Rome, M.P.H.
Key findings
Data from the National Study of Long-Term Care Providers
- A higher percentage of participants of a race and ethnicity other than non-Hispanic white were in for-profit centers compared with nonprofit centers.
- About 73% of participants in for-profit centers paid for services using Medicaid compared with 58% in nonprofit centers.
- The percentage of participants with Alzheimer disease and with intellectual or developmental disability was higher in nonprofit centers than in for-profit centers.
- The percentage of participants needing assistance with bathing, dressing, toileting, transferring in or out of a chair, or eating was higher in nonprofit centers than in for-profit centers.
- A higher percentage of participants in nonprofit centers (10%) than in for-profit centers (6%) had fallen in the last 90 days.
An estimated 286,300 participants were enrolled in adult day services centers in the United States in 2016 (1). The percentage of for-profit adult day services centers has grown in recent years, from 40% in 2012 to 44% in 2014 and remaining stable at 45% in 2016 (2–4). This report presents the most current national estimates of selected characteristics of participants in adult day services centers and compares these characteristics by center ownership type. State-level estimates for the characteristics presented are available from: https://www.cdc.gov/nchs/nsltcp/nsltcp_products.htm.
Keywords: medical conditions, activities of daily living (ADLs), home and community-based services, National Study of Long-Term Care Providers
The racial and ethnic composition of participants in adult day services centers varied by center ownership.
- About 31% of participants in for-profit centers were non-Hispanic white, 29% were Hispanic, 24% were of other race and ethnicity, and 14% were non-Hispanic black, compared with 54% non-Hispanic white, 15% Hispanic, 12% other race and ethnicity, and 17% non-Hispanic black in nonprofit centers (Figure 1).
Figure 1. Percent distribution of race and ethnicity among adult day services center participants, by center ownership: United States, 2016
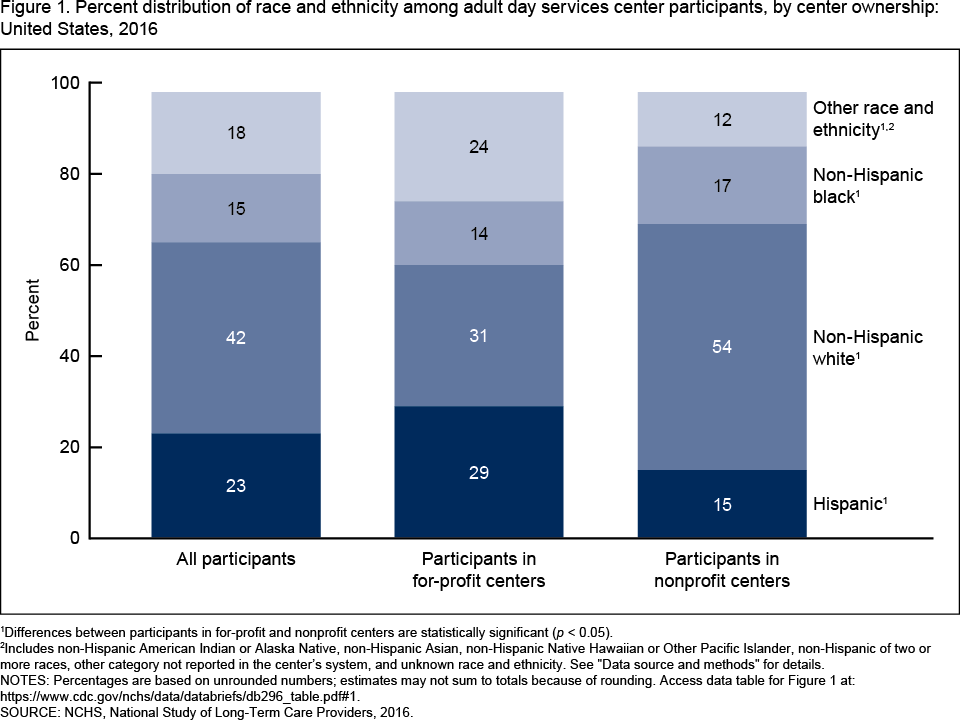
1Differences between participants in for-profit and nonprofit centers are statistically significant (p < 0.05).
2Includes non-Hispanic American Indian or Alaska Native, non-Hispanic Asian, non-Hispanic Native Hawaiian or Other Pacific Islander, non-Hispanic of two or more races, other category not reported in the center’s system, and unknown race and ethnicity.
NOTES: Percentages are based on unrounded numbers; estimates may not sum to totals because of rounding. See “Data source and methods” for details on the study and methodology. Access data table for Figure 1.
SOURCE: NCHS, National Study of Long-Term Care Providers, 2016.
Selected sociodemographic characteristics of adult day services center participants differed by center ownership.
- A higher percentage of participants had some or all services paid by Medicaid in for-profit centers (73%) compared with participants in nonprofit centers (58%) (Figure 2).
- A higher percentage of participants in for-profit adult day services centers were aged 65 and over (65%) compared with nonprofit centers (60%).
- For-profit adult day services centers had a slightly higher percentage of female participants (59%) compared with nonprofit centers (58%).
Figure 2. Selected sociodemographic characteristics among adult day services center participants, by center ownership: United States, 2016
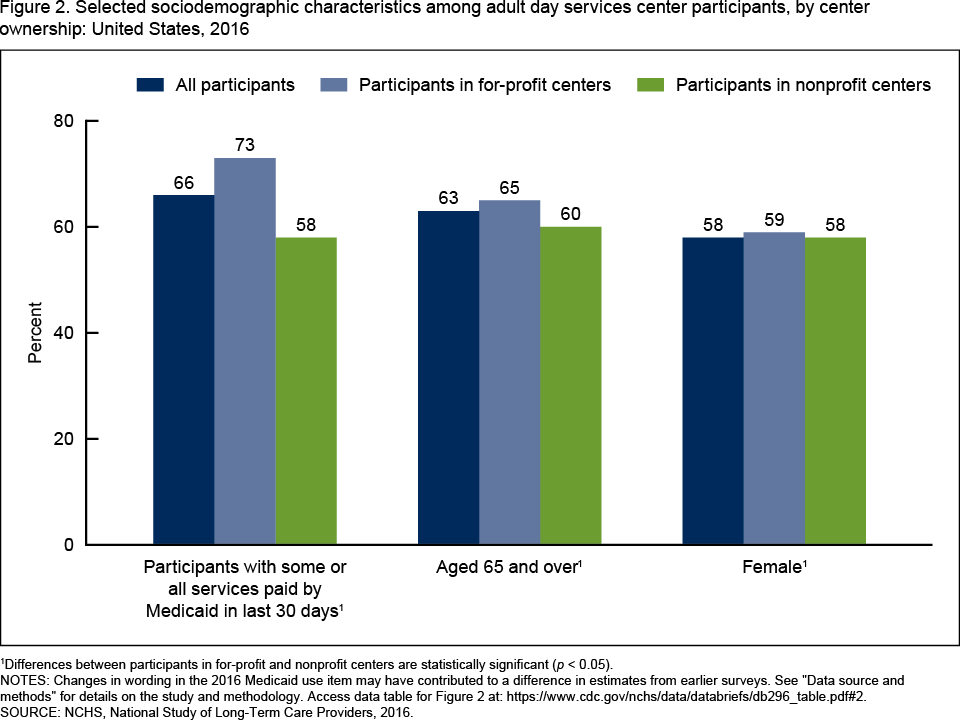
1Differences between participants in for-profit and nonprofit centers are statistically significant (p < 0.05).
NOTES: Changes in wording in the 2016 Medicaid use item may have contributed to a difference in estimates from earlier surveys. See “Data source and methods” for details on the study and methodology. Access data table for Figure 2.
SOURCE: NCHS, National Study of Long-Term Care Providers, 2016.
The prevalence of selected diagnosed medical conditions among adult day services center participants differed by center ownership.
- A higher percentage of participants in for-profit centers than in nonprofit centers had a diagnosis of diabetes (38% compared with 24%), depression (32% compared with 24%), heart disease (30% compared with 24%), and severe mental illness (11% compared with 8%) (Figure 3).
- A lower percentage of participants in for-profit centers than in nonprofit centers had a diagnosis of Alzheimer disease or other dementias (26% compared with 37%) and intellectual or developmental disability (21% compared with 36%).
Figure 3. Selected diagnosed medical conditions among adult day services center participants, by center ownership: United States, 2016
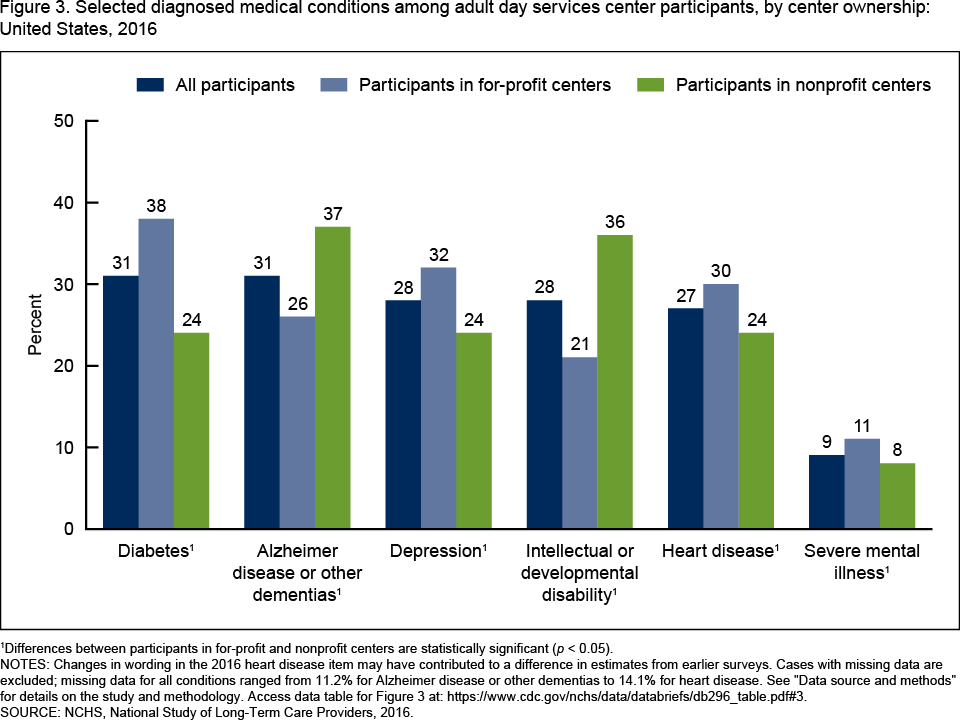
1Differences between participants in for-profit and nonprofit centers are statistically significant (p < 0.05).
NOTES: Changes in wording in the 2016 heart disease item may have contributed to a difference in estimates from earlier surveys. Cases with missing data are excluded; missing data for all conditions ranged from 11.2% for Alzheimer disease or other dementias to 14.1% for heart disease. See “Data source and methods” for details on the study and methodology. Access data table for Figure 3.
SOURCE: NCHS, National Study of Long-Term Care Providers, 2016.
Nonprofit adult day services centers had a higher percentage of participants needing assistance with selected activities of daily living (ADLs) than for-profit centers.
- Nonprofit centers had a higher percentage of participants needing assistance with bathing (41%) compared with participants in for-profit centers (37%) (Figure 4).
- A higher percentage of participants in nonprofit centers than in for-profit centers needed assistance with toileting (40% compared with 28%), dressing (39% compared with 34%), transferring in or out of a chair (30% compared with 27%), and eating (28% compared with 19%).
Figure 4. Need for assistance with selected activities of daily living among adult day services center participants, by center ownership: United States, 2016
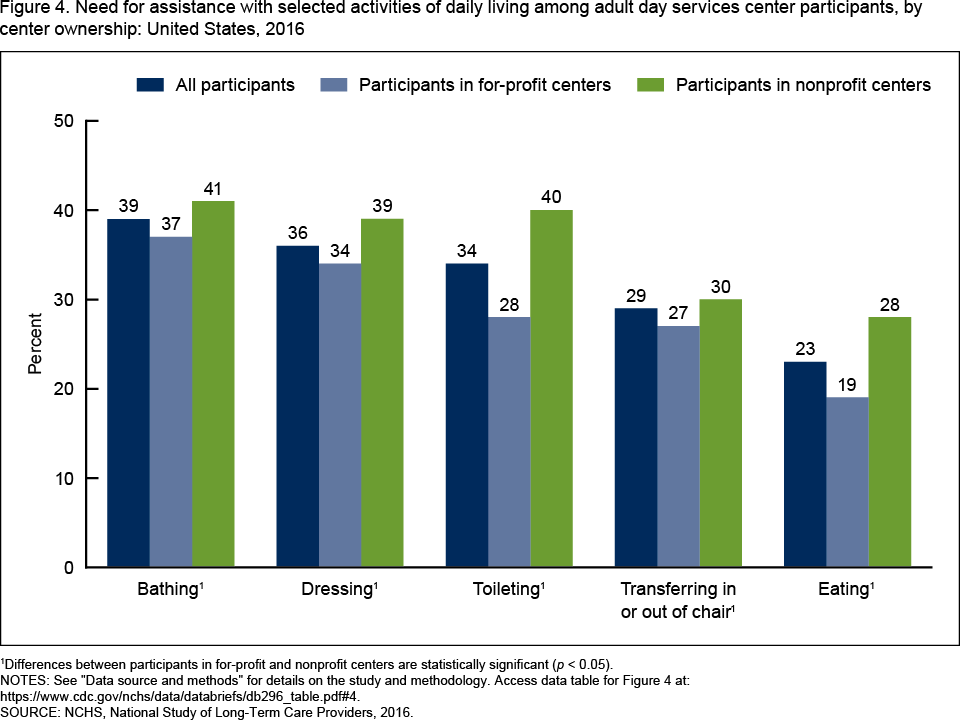
1Differences between participants in for-profit and nonprofit centers are statistically significant (p < 0.05).
NOTES: See “Data source and methods” for details on the study and methodology. Access data table for Figure 4.
SOURCE: NCHS, National Study of Long-Term Care Providers, 2016.
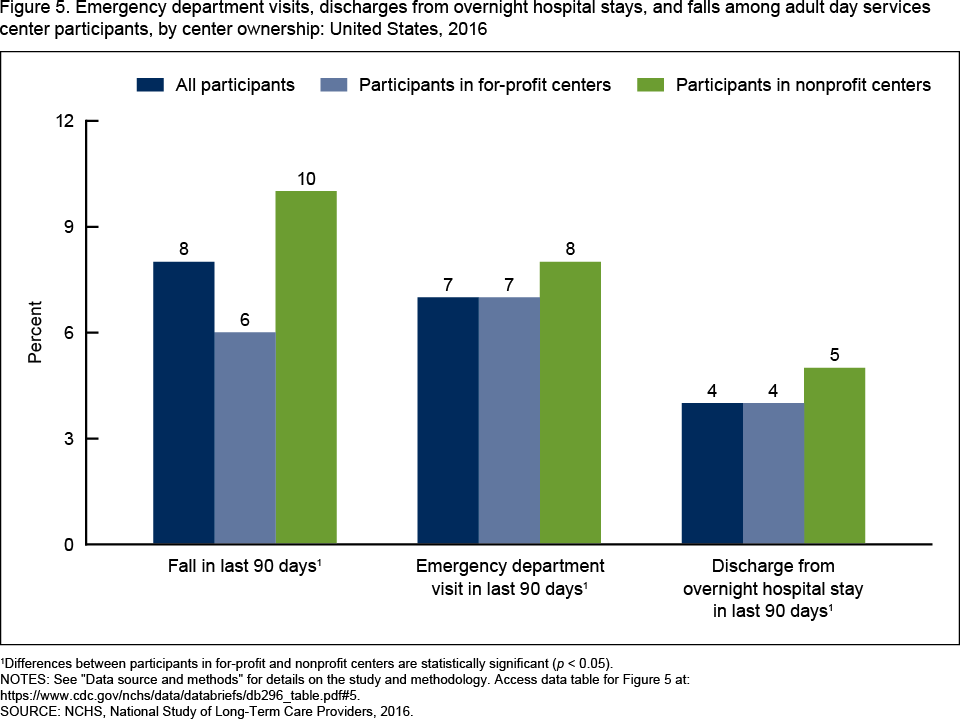
The prevalence of emergency department visits, discharges from overnight hospital stays, and falls among adult day services center participants differed by center ownership.
- Nonprofit centers had a higher percentage of participants who had fallen in the last 90 days (10%) compared with for-profit centers (6%) (Figure 5).
- A slightly higher percentage of participants in nonprofit centers than in for-profit centers had emergency department visits (8% compared with 7%) and discharges from an overnight hospital stay (5% compared with 4%) in the last 90-day period.
Figure 5. Emergency department visits, discharges from overnight hospital stays, and falls among adult day services center participants, by center ownership: United States, 2016
1Differences between participants in for-profit and nonprofit centers are statistically significant (p < 0.05).
NOTES: See “Data source and methods” for details on the study and methodology. Access data table for Figure 5.
SOURCE: NCHS, National Study of Long-Term Care Providers, 2016.
Summary
In 2016, U.S. adult day services center participants differed by type of center ownership for each of the characteristics examined in this report. As in previous years (5,6), the sociodemographic, functional and health status, and service utilization characteristics of center participants varied by type of center ownership. For-profit adult day services centers had a higher percentage of racial and ethnic minorities, served a somewhat older population (aged 65 and over), and had more participants with services paid by Medicaid compared with nonprofit centers. For-profit centers served higher percentages of participants with a diagnosis of heart disease, diabetes, depression, or severe mental illness compared with nonprofit centers. Conversely, compared with for-profit centers, nonprofit adult day services centers served a higher percentage of participants with a diagnosis of Alzheimer disease or other dementias, and with intellectual or developmental disability. Nonprofit centers served more participants who needed assistance with selected ADLs. Slightly higher percentages of participants in nonprofit centers than in for-profit centers had an emergency department visit, a discharge from an overnight hospital stay, or a fall in the last 90 days.
Definitions
Adult day services center: A community-based center, generally open on weekdays, that provides long-term care services, including structured activities, health monitoring, socialization, and assistance with activities of daily living (ADLs) to adults with disabilities.
Assistance with selected activities of daily living (ADLs): Refers to participants needing any help or supervision from another person, or use of assistive devices, at their usual residence or at the adult day services center, with up to five limitations in ADLs (bathing, dressing, transferring in and out of a chair, toileting, and eating) that reflect a participant’s capacity for self-care.
Emergency department visits: Includes participants who were treated in a hospital emergency department at least once in the 90 days prior to the survey.
Falls: Includes participants with at least one on-site or off-site fall in the 90 days prior to the survey.
Heart disease: Includes conditions such as congestive heart failure, coronary or ischemic heart disease, heart attack, and stroke.
Other race and ethnicity: Includes participants of the following racial and ethnic backgrounds: non-Hispanic American Indian or Alaska Native, non-Hispanic Asian, non-Hispanic Native Hawaiian or Other Pacific Islander, non-Hispanic of two or more races, other category not reported in the adult day services center’s system, and unknown race and ethnicity.
Overnight hospital stays: Includes participants with at least one discharge from an overnight hospital stay in the 90 days prior to the survey.
Ownership type: For-profit includes private for-profit centers, publicly traded centers, and limited liability centers. Nonprofit includes private nonprofit centers as well as federal, state, county, and local government-owned centers.
Participants with some or all services paid by Medicaid: Includes participants who had some or all of their long-term care services paid by Medicaid during the 30 days prior to the survey, including funding from a Medicaid state plan, Medicaid waiver, Medicaid managed care, or California regional center.
Data source and methods
Data are from the Adult Day Services Center Survey component of the 2016 wave of the biennial National Study of Long-Term Care Providers (NSLTCP), conducted by the National Center for Health Statistics. The survey used a census of adult day services centers in the National Adult Day Services Association’s database. More details on the NSLTCP survey, including eligibility criteria, design, and outcomes, are published elsewhere (1,7).
Although the 2016 NSLTCP includes an estimated 286,300 participants in 4,600 adult day services centers nationwide, the analyses in this report are based on the 285,100 participants in adult day services centers for which ownership status was known. Cases with missing data were excluded from the analyses, ranging from less than 1% for ownership status to 14.1% in diagnoses of heart disease. Missing data greater than 10% are noted in the data.
Differences by ownership status were evaluated using t tests, and a ratio of weighted sums for each subgroup was computed for comparison. All statistical significance tests were two-sided, using p < 0.05 as the significance level. All differences reported are statistically significant unless otherwise indicated. Data analyses were performed using SAS version 9.3, SAS-callable SUDAAN version 11.0.0, and Stata/SE version 14.
About the authors
Jessica Penn Lendon and Vincent Rome are with the National Center for Health Statistics, Division of Health Care Statistics, Long-Term Care Statistics Branch.
References
- National Center for Health Statistics. 2016 National Study of Long-Term Care Providers survey methodology for the Adult Day Services Center and Residential Care Community components. Hyattsville, MD. 2017.
- Dwyer LL, Harris-Kojetin LD, Valverde RH. Differences in adult day services center characteristics by center ownership: United States, 2012. NCHS Data Brief, no 165. Hyattsville, MD: National Center for Health Statistics. 2014.
- Rome V, Harris-Kojetin LD, Park-Lee E. Variation in operating characteristics of adult day services centers, by center ownership: United States, 2014. NCHS Data Brief, no 224. Hyattsville, MD: National Center for Health Statistics. 2015.
- Harris-Kojetin L, Sengupta M, Park-Lee E, Valverde R, Caffrey C, Rome V, Lendon J. Long-term care providers and services users in the United States: Data from the National Study of Long-Term Care Providers, 2013–2014. National Center for Health Statistics. Vital Health Stat 3(38). 2016.
- Park-Lee E, Harris-Kojetin LD, Rome V, Lendon JP. Variation in adult day services center participant characteristics, by center ownership: United States, 2014. NCHS Data Brief, no 227. Hyattsville, MD: National Center for Health Statistics. 2015.
- Dwyer LL, Harris-Kojetin LD, Valverde RH. Differences in adult day services center participant characteristics by center ownership: United States, 2012. NCHS Data Brief, no 164. Hyattsville, MD: National Center for Health Statistics. 2014.
- National Center for Health Statistics. 2016 National Study of Long-Term Care Providers (NSLTCP) Adult Day Services Center Survey restricted data file: Data description and usage (readme). Hyattsville, MD. 2017.
Suggested citation
Lendon JP, Rome V. Variation in adult day services center participant characteristics, by center ownership: United States, 2016. NCHS Data Brief, no 296. Hyattsville, MD: National Center for Health Statistics. 2018.
Copyright information
All material appearing in this report is in the public domain and may be reproduced or copied without permission; citation as to source, however, is appreciated.
National Center for Health Statistics
Charles J. Rothwell, M.S., M.B.A., Director
Jennifer H. Madans, Ph.D., Associate Director for Science
Division of Health Care Statistics
Denys T. Lau, Ph.D., Acting Director
Alexander Strashny, Ph.D., Associate Director for Science