Total and High-density Lipoprotein Cholesterol in Adults: National Health and Nutrition Examination Survey, 2011–2012
- Key findings
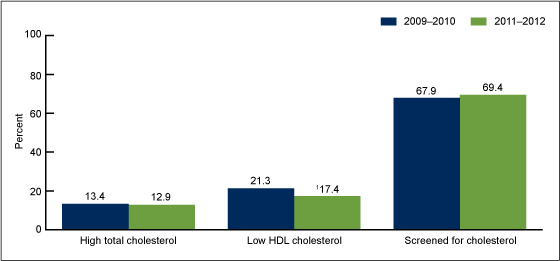
- During 2011–2012, 12.9% of adults had high total cholesterol, 17.4% had low HDL cholesterol, and 69.4% had been screened for cholesterol.
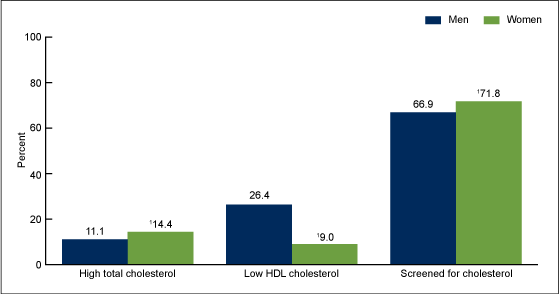
- During 2011–2012, the percentage of adults with high total cholesterol, low HDL cholesterol, and screened for cholesterol differed by sex.
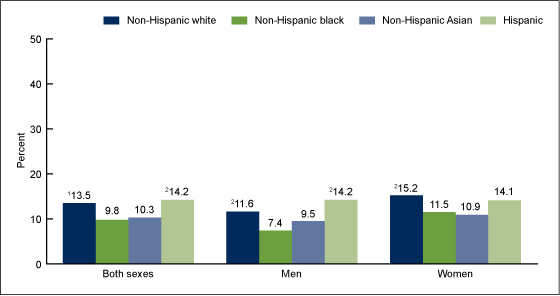
- The percentage of adults with high total cholesterol during 2011–2012 differed by race and Hispanic origin.
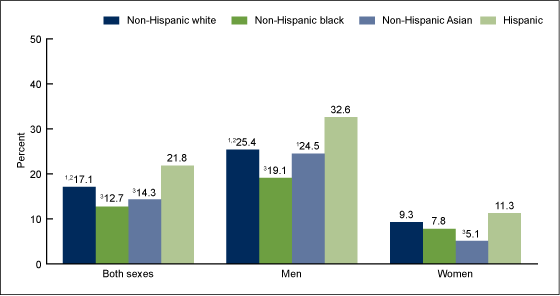
- The percentage of adults with low HDL cholesterol during 2011–2012 also differed by race and Hispanic origin.
- During 2011–2012, the percentage of adults screened for cholesterol also differed by race and Hispanic origin.
- Summary
- Definitions
- Data source and methods
- About the authors
- References
- Suggested citation
NCHS Data Brief No. 132, October 2013
PDF Version (779 KB)
Margaret D. Carroll, M.S.P.H.; Brian K. Kit, M.D., M.P.H.; David A. Lacher, M.D., M.Ed.; and Sung Sug (Sarah) Yoon, R.N., Ph.D.
Key findings
Data from the National Health and Nutrition Examination Survey, 2011–2012
- In 2011–2012, an estimated 12.9% of U.S. adults aged 20 and over (11.1% of men and 14.4% of women) had high total cholesterol, which is unchanged since 2009–2010.
- Approximately 17% of adults (just over one-quarter of men and less than 10% of women) had low high-density lipoprotein (HDL) cholesterol during 2011–2012. The percentage of adults with low HDL cholesterol has decreased 20% since 2009–2010.
- Nearly 70% of adults (67% of men and nearly 72% of women) had been screened for cholesterol, which is unchanged since 2009–2010.
High levels of total cholesterol and low levels of high-density lipoprotein (HDL) cholesterol (the “good cholesterol”) are risk factors for coronary heart disease (1–5). To identify persons who may be at risk for developing coronary heart disease, adults are advised to have their cholesterol checked at least once every 5 years (i.e., to be screened for cholesterol) (6). A previous study reported declining trends in the percentage of adults with high total cholesterol during 1999–2010 (7). This report presents estimates of the percentages of adults aged 20 and over with high total cholesterol, low HDL cholesterol, and screened for cholesterol, based on data from 2011–2012, and compares them with corresponding estimates from 2009–2010. Analysis is based on measured cholesterol only and does not take into account whether lipid-lowering medications were taken.
Keywords: cholesterol screening, total cholesterol, HDL cholesterol
During 2011–2012, 12.9% of adults had high total cholesterol, 17.4% had low HDL cholesterol, and 69.4% had been screened for cholesterol.
Figure 1. Age-adjusted percentage of adults aged 20 and over with high total cholesterol, low HDL cholesterol, and screened for cholesterol: United States, 2009–2010 and 2011–2012
1Significant decrease between 2009–2010 and 2011–2012 (p < 0.05).
NOTES: HDL is high-density lipoprotein. High total cholesterol is ≥240 mg/dL; low HDL cholesterol is <40 mg/dL; screened for cholesterol is having cholesterol checked within the past 5 years.
SOURCE: CDC/NCHS, National Health and Nutrition Examination Survey, 2009–2010 and 2011–2012.
The percentage of adults with low HDL cholesterol has decreased since 2009–2010, but neither the percentage with high total cholesterol nor the percentage screened for cholesterol changed during this time period (Figure 1).
During 2011–2012, the percentage of adults with high total cholesterol, low HDL cholesterol, and screened for cholesterol differed by sex.
A higher percentage of women (14.4%) than men (11.1%) had high total cholesterol, and a higher percentage of women (71.8%) than men (66.9%) had been screened for cholesterol (Figure 2). However, a lower percentage of women (9.0%) than men (26.4%) had low HDL cholesterol.
Figure 2. Age-adjusted percentage of adults aged 20 and over with high total cholesterol, low HDL cholesterol, and screened for cholesterol, by sex: United States, 2011–2012
1Significantly different from men.
NOTES: HDL is high-density lipoprotein. High total cholesterol is ≥240 mg/dL; low HDL cholesterol is <40 mg/dL; screened for cholesterol is having cholesterol checked within the past 5 years.
SOURCE: CDC/NCHS, National Health and Nutrition Examination Survey, 2011–2012.
The percentage of adults with high total cholesterol during 2011–2012 differed by race and Hispanic origin.
Non-Hispanic black adults had consistently lower percentages with high total cholesterol (9.8% overall, 7.4% for men, and 11.5% for women) than non-Hispanic white adults (13.5% overall, 11.6% for men, and 15.2% for women) (Figure 3). The percentage with high total cholesterol was also lower for non-Hispanic black adults overall (9.8%) than for Hispanic adults overall (14.2%) and for men (7.4% non-Hispanic black and 14.2% Hispanic), but not for women. For non-Hispanic Asian adults overall, and for non-Hispanic Asian men and women, the percentage with high total cholesterol did not differ significantly from the percentages for the three other racial and ethnic groups.
Figure 3. Age-adjusted percentage of adults aged 20 and over with high total cholesterol, by sex and race and Hispanic origin: United States, 2011–2012
1Significantly different from non-Hispanic black (p < 0.05).
2Significantly different from non-Hispanic black (p < 0.01).
NOTE: High total cholesterol is serum total cholesterol ≥ 240 mg/dL.
SOURCE: CDC/NCHS, National Health and Nutrition Examination Survey, 2011–2012.
The percentage of adults with low HDL cholesterol during 2011–2012 also differed by race and Hispanic origin.
The percentage of adults with low HDL cholesterol was lower in non-Hispanic black adults than in non-Hispanic white adults, and higher in Hispanic adults than in non-Hispanic black or non-Hispanic white adults (Figure 4). These racial and ethnic differences were also observed in men but not in women. Non-Hispanic Asian adults had consistently lower percentages with low HDL cholesterol (14.3% overall, 24.5% for men, and 5.1% for women) than Hispanic adults (21.8% overall, 32.6% for men, and 11.3% for women).
Figure 4. Age-adjusted percentage of adults aged 20 and over with low HDL cholesterol, by sex and race and Hispanic origin: United States, 2011–2012
1Significantly different from Hispanic (p < 0.05).
2Significantly different from non-Hispanic black (p < 0.05).
3Significantly different from Hispanic (p < 0.01).
NOTES: HDL is high-density lipoprotein. Low HDL is <40 mg/dL.
SOURCE: CDC/NCHS, National Health and Nutrition Examination Survey, 2011–2012.
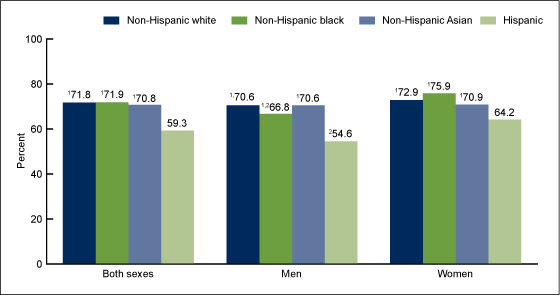
During 2011–2012, the percentage of adults screened for cholesterol also differed by race and Hispanic origin.
Overall, and for both men and women, the percentage of adults screened for cholesterol was lower for Hispanic adults than for non-Hispanic white, non-Hispanic black, and non-Hispanic Asian adults (Figure 5).
Figure 5. Age-adjusted percentage of adults aged 20 and over screened for cholesterol, by sex and race and Hispanic origin: United States, 2011–2012
1Significantly different from Hispanic (p < 0.001).
2Significantly different from women of the same racial and ethnic group (p < 0.01).
NOTE: Screened for cholesterol is having cholesterol checked within the past 5 years.
SOURCE: CDC/NCHS, National Health and Nutrition Examination Survey, 2011–2012.
Summary
Although the percentage of adults aged 20 and over with high total cholesterol declined substantially from 1999 to 2010 (7), there was no change between 2009–2010 and 2011–2012. There was also no change in the percentage of adults screened for cholesterol. However, the percentage of adults with low HDL cholesterol decreased.
The differences by sex and race and Hispanic origin observed for high total cholesterol, low HDL cholesterol, and screened for cholesterol during 2009–2010 were also observed during 2011–2012 (7). New with the 2011–2012 data is the ability to provide estimates for the non-Hispanic Asian population. The percentage of non-Hispanic Asian adults with high total cholesterol did not differ significantly from that of the other three racial and ethnic groups. However, non-Hispanic Asian adults had consistently lower percentages with low HDL cholesterol and consistently higher percentages screened for cholesterol, compared with Hispanic adults.
The Healthy People 2020 (8) target for high total cholesterol of no more than 13.5% (objective 7) was achieved in all adults and in all sex and racial and ethnic groups except for women overall, Hispanic men, and non-Hispanic white women. However, none of the sex and race and Hispanic origin groups attained the Healthy People 2020 target for cholesterol screening of at least 82.5% (objective 6).
Definitions
High total cholesterol: Serum total cholesterol greater than or equal to 240 mg/dL (6).
Low HDL cholesterol: Serum HDL cholesterol less than 40 mg/dL (6).
Screened for high cholesterol: Defined by an affirmative response to the question, “Have you ever been told by a doctor your cholesterol was high?” and a response indicating less than 5 years ago to the question, “About how long has it been since you last had your blood cholesterol level checked?”
Healthy People 2020: Heart Disease and Stroke, Objective 6: Increase the proportion of adults who have had their blood cholesterol checked within the preceding 5 years; target: 82.5% (8).
Healthy People 2020: Heart Disease and Stroke, Objective 7: Reduce the proportion of adults with high total blood cholesterol levels; target: 13.5% (8).
Data source and methods
Data from the National Health and Nutrition Examination Surveys (NHANES) 2009–2010 and 2011–2012 were used for these analyses. NHANES is a cross-sectional survey designed to monitor the health and nutritional status of the civilian noninstitutionalized U.S. population (9). It is conducted by the Centers for Disease Control and Prevention’s (CDC) National Center for Health Statistics (NCHS). The survey consists of interviews conducted in participants’ homes, standardized physical examinations conducted in mobile examination centers (MECs), and laboratory tests using blood specimens provided by participants during the physical examination. Details on the laboratory methods are available elsewhere (9).
The NHANES sample is selected through a complex, multistage probability design. In 2011–2012, non-Hispanic Asian, non-Hispanic black, and Hispanic persons; persons with low income (below 130% of the federal poverty level); and those aged 60 and over were oversampled to obtain reliable estimates of health and nutritional measures for these population subgroups. Data collection is based on a representative sample covering all ages of the civilian noninstitutionalized population. Public-use data files are released in 2-year cycles (9).
Sample weights (which account for the differential probabilities of selection, nonresponse, and noncoverage) are incorporated into the estimation process. The MEC examination weight was used in estimating the prevalence of high total cholesterol and low HDL cholesterol. The interview weight was used to estimate the prevalence of cholesterol screening. All variance estimates accounted for the complex survey design by using Taylor series linearization (10).
Prevalence estimates for the total adult population were age-adjusted by the direct method to the 2000 U.S. census population, using age groups 20–39, 40–59, and 60 and over (11). Differences between groups were tested using Student’s t statistic with the appropriate number of degrees of freedom, at the p < 0.05 significance level. All differences reported are statistically significant unless otherwise indicated. Adjustments were not made for multiple comparisons. Statistical analyses were conducted using the SAS System for Windows, release 9.3 (SAS Institute, Inc., Cary, N.C.) and SUDAAN, release 11.0 (RTI International, Research Triangle Park, N.C.).
About the authors
Margaret D. Carroll, Brian K. Kit, David A. Lacher, and Sarah Yoon are with CDC’s National Center for Health Statistics, Division of Health and Nutrition Examination Surveys.
References
- Wilson PW, D’Agostino RB, Levy D, Belanger AM, Silbershatz H, Kannel WB. Prediction of coronary heart disease using risk factor categories. Circulation 97(18):1837–47. 1998.
- Lipid Research Clinics Program. The Lipid Research Clinics Coronary Primary Prevention Trial results: II. The relationship of reduction in incidence of coronary heart disease to cholesterol lowering. JAMA 251(3):365–74. 1984.
- Stamler J, Wentworth D, Neaton JD. Is the relationship between serum cholesterol and risk of premature death from coronary heart disease continuous or graded? Findings in 356,222 primary screenees of the Multiple Risk Factor Intervention Trial (MRFIT). JAMA 256(20):2823–8. 1986.
- Wilson PW, Garrison RJ, Castelli WP, Feinleib M, McNamara PM, Kannel WB. Prevalence of coronary heart disease in the Framingham Offspring Study: Role of lipoprotein cholesterol. Am J Cardiol 46(4):649–54. 1980.
- Assmann G, Schulte H, von Eckardstein A, Huang Y. High-density lipoprotein cholesterol as a predictor of coronary heart disease risk: The PROCAM experience and pathophysiological implications for reverse cholesterol transport. Atherosclerosis 124(suppl 6):S11–20. 1996.
- National Cholesterol Education Program. Third report of the NCEP Expert Panel on Detection, Evaluation, and Treatment of High Blood Cholesterol in Adults (Adult Treatment Panel III) [PDF-1.2KB]. Final report. NIH Pub. No. 02–5215. Bethesda, MD: National Institutes of Health, National Heart, Lung, and Blood Institute. 2002.
- Carroll MD, Kit BK, Lacher DA. Total and high-density lipoprotein cholesterol in adults: National Health and Nutrition Examination Survey, 2009–2010 [PDF-512KB]. NCHS data brief, no 92. Hyattsville, MD: National Center for Health Statistics. 2012.
- U.S. Department of Health and Human Services, Office of Disease Prevention and Health Promotion. Healthy People 2020 topics and objectives: Heart disease and stroke. Washington, DC.
- National Center for Health Statistics. National Health and Nutrition Examination Survey: NHANES 2011–2012.
- Wolter KM. Introduction to variance estimation. 2nd ed. New York, NY: Springer Science+Business Media. 2007.
- Klein RJ, Schoenborn CA. Age adjustment using the 2000 projected U.S. population [PDF-122KB]. Healthy People 2010 Statistical Notes, no 20. Hyattsville, MD: National Center for Health Statistics. 2001.
Suggested citation
Carroll MD, Kit BK, Lacher DA, Yoon SS. Total and high-density lipoprotein cholesterol in adults: National Health and Nutrition Examination Survey, 2011–2012. NCHS data brief, no 132. Hyattsville, MD: National Center for Health Statistics. 2013.
Copyright information
All material appearing in this report is in the public domain and may be reproduced or copied without permission; citation as to source, however, is appreciated.
National Center for Health Statistics
Charles J. Rothwell, M.S., Acting Director
Jennifer H. Madans, Ph.D., Associate Director for Science
Division of Health and Nutrition Examination Surveys
Kathryn S. Porter, M.D., M.S., Director
