Generalist and Specialty Physicians: Supply and Access, 2009–2010
- Key findings
- The number of specialty physicians was significantly larger than the number of generalists, but the number of visits to both types of physicians was about the same, resulting in higher annual visits per generalist than per specialist.
- Generalist and specialty physicians differed in their acceptance of new patients.
- In 2009–2010, generalists spent more time providing direct patient care and were more likely than specialists to see patients during evening and weekend hours.
- In 2009–2010, generalist physicians had shorter wait times for an appointment and were more likely to set aside time for same-day appointments compared with specialty physicians.
- Summary
- Data sources and methods
- About the authors
- References
- Suggested citation
NCHS Data Brief No. 105, September 2012
PDF Version (681 KB)
Esther Hing, M.P.H., and Susan M. Schappert, M.A.
Key findings
Data from the National Ambulatory Medical Care Survey
- In 2009–2010, annual visits per generalist physician were 30% higher than visits per specialty physician. A similar pattern was observed in 1999–2000.
- In 2009–2010, generalist physicians were less likely to accept new Medicaid patients (65%) than were specialty physicians (71%).
- A greater percentage of generalist physicians (70%) than specialty physicians (61%) spent 31 hours or more per week providing direct patient care in 2009–2010.
- In 2009–2010, a greater percentage of generalist physicians (40%) worked evening and weekend hours than did specialty physicians (19%).
- Generalist physicians were more likely to set aside time for same-day appointments (82%) compared with specialty physicians (49%) in 2009–2010.
As the overall population ages, policy makers are focusing on the current and growing shortage of the primary care workforce (1–3), particularly as provisions of the 2010 Patient Protection and Affordable Care Act (PPACA) expand health insurance coverage. This report presents selected trends in physician shortage measures and access to care measures for generalist physicians and specialists. Generalists are those in the specialties of family practice, general practice, internal medicine, and pediatrics, whereas specialists comprise all other specialties. Estimates are based on physicians who participated in the National Ambulatory Medical Care Survey (NAMCS) by providing data on visits.
Keywords: National Ambulatory Medical Care Survey, office-based physicians
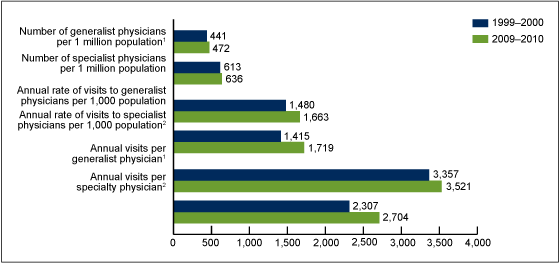
The number of specialty physicians was significantly larger than the number of generalists, but the number of visits to both types of physicians was about the same, resulting in higher annual visits per generalist than per specialist.
Figure 1. Number of physicians per population, annual visit rate per population, and annual visits per physician, by specialty: United States, 1999–2000 and 2009–2010
1Difference between generalist and specialist rates is statistically significant (p < 0.05) in each
2-year time period.
2Trend is statistically significant (p < 0.05).
NOTE: Generalist physicians include family and general practitioners, internists, and pediatricians; specialty physicians include all other specialties.
SOURCE: CDC/NCHS, National Ambulatory Medical Care Survey.
- In 2009–2010, the supply of generalist physicians per capita (472 per 1 million population) was 26% lower than the supply of specialty physicians (636 per 1 million population). This pattern was also observed in 1999–2000, when the per capita supply of generalists was 28% lower than the supply of specialists (Figure 1).
- The per capita supply of generalist and specialty physicians did not change significantly between 1999–2000 and 2009–2010.
- The annual rate of visits per 1,000 population to generalists was not statistically different from the corresponding rate of visits to specialists in either time period. However, annual visits per 1,000 population to specialty physicians increased 21% from 1,415 in 1999–2000 to 1,719 in 2009–2010.
- In 2009–2010, the annual visit load for generalist physicians (3,521) was 30% higher than the annual visit load for specialty physicians (2,704). A similar pattern was observed in 1999–2000, when the generalist visit load (3,357) was 46% higher than for specialists (2,307). Over the same period, the visit load increased significantly for specialists but not for generalists.
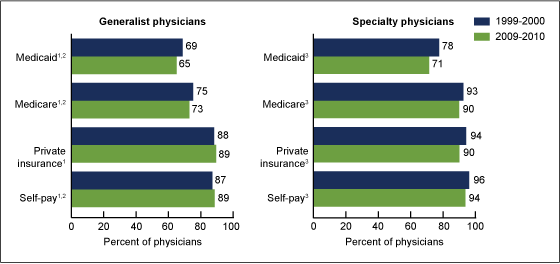
Generalist and specialty physicians differed in their acceptance of new patients.
- Between 1999–2000 and 2009–2010, no significant change was observed in the percentages of generalist physicians who said they would accept new patients with private insurance, Medicare, Medicaid, or self-payment (Figure 2).
- Between 1999–2000 and 2009–2010, the percentage of specialty physicians accepting new Medicaid patients declined 9% (from 78% to 71%); specialists accepting new Medicare patients declined 3% (from 93% to 90%); those accepting new private insurance patients declined 4% (from 94% to 90%); and those accepting new self-pay patients declined 2% (from 96% to 94%).
- In both 1999–2000 and 2009–2010, generalist physicians were less likely to accept new Medicare patients and Medicaid patients than were specialty physicians.
Figure 2. Percentage of physicians accepting new patients, by type of insurance and physician specialty: United States, 1999–2000 and 2009–2010
11999–2000 difference between generalist and specialty physicians is statistically significant
(p < 0.05).
22009–2010 difference between generalist and specialty physicians is statistically significant
(p < 0.05).
3Trend is statistically significant (p < 0.05).
NOTE: Generalist physicians include family and general practitioners, internists, and pediatricians; specialty physicians include all other specialties.
SOURCE: CDC/NCHS, National Ambulatory Medical Care Survey.
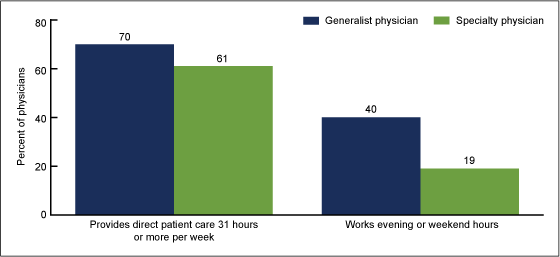
In 2009–2010, generalists spent more time providing direct patient care and were more likely than specialists to see patients during evening and weekend hours.
- In 2009–2010, a greater percentage of generalist physicians (70%) spent 31 hours or more per week providing direct patient care than did specialty physicians (61%) (Figure 3).
- A greater percentage of generalist physicians worked evening and weekend hours (40%) than did specialty physicians (19%) in 2009–2010.
Figure 3. Percentage of physicians providing direct patient care 31 hours or more per week, and percentage working evening and weekend hours, by specialty: United States, 2009–2010
NOTES: All differences between generalist and specialty physicians are statistically significant
(p < 0.05). Generalist physicians include family and general practitioners, internists, and pediatricians; specialty physicians include all other specialties.
SOURCE: CDC/NCHS, National Ambulatory Medical Care Survey.
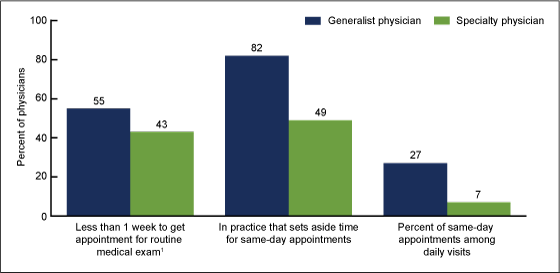
In 2009–2010, generalist physicians had shorter wait times for an appointment and were more likely to set aside time for same-day appointments compared with specialty physicians.
- A greater percentage of generalist (55%) than specialty (43%) physicians reported that patients waited less than a week to get an appointment for a routine medical examination (Figure 4).
- In 2009–2010, generalist physicians were more likely to set aside time for same-day appointments (82%) than were specialty physicians (49%).
- Generalist physicians reported a higher percentage of same-day appointments among their daily visits (27%) than did specialty physicians (7%).
Figure 4. Percentage of physicians by time to get an appointment, whether practice sets aside time for same-day appointments, and percentage of same-day appointments, and by specialty: United States, 2009–2010
1Excludes physicians who did not provide routine medical examinations (14% of specialty physicians).
NOTES: All differences between generalist and specialty physicians are statistically significant
(p < 0.05). Generalist physicians include family and general practitioners, internists, and pediatricians; specialty physicians include all other specialties.
SOURCE: CDC/NCHS, National Ambulatory Medical Care Survey.
Summary
In 2009–2010, the per capita supply of generalist physicians was lower than that of specialty physicians. At the same time, the annual volume of visits per generalist physician exceeded the corresponding volume per specialty physician by 30%. Both patterns were also noted in 1999–2000. The larger volume of visits to generalist physicians occurred at the same time that generalists reported a lower likelihood of accepting new Medicare and Medicaid patients compared with specialty physicians. Previous research found that cuts in Medicaid physician fees led to statistically significant reductions in the number of visits for Medicaid patients compared with privately insured patients (4). Medicaid and Medicare reimbursement rates may have been associated with the 9% and 3% declines in percentages of specialty physicians accepting new Medicaid and Medicare patients, respectively, between 1999–2000 and 2009–2010 (5).
Although generalist physicians’ annual visit loads were higher compared with specialty physicians, access to generalist care in 2009–2010 was more available than access to specialty care by several measures. Generalist physicians were more likely than specialty physicians to spend more hours per week providing direct patient care; treat patients in their offices during evening and weekend hours; report shorter waiting periods for patients to get an appointment for a routine medical examination; and have practices that set aside time for same-day appointments.
Further research is needed to monitor the supply of generalist physicians, particularly at state and local levels (6).
Data sources and methods
All estimates are from NAMCS, an annual, nationally representative survey of visits to nonfederal office-based physicians, excluding pathologists, anesthesiologists, and radiologists. The sampling frames for the 2009 and 2010 NAMCS were constructed from master files of the American Medical Association (AMA) and the American Osteopathic Association (AOA); the sampling frame for community health centers was obtained from the federal Health Resources and Services Administration. The average 2009–2010 response rate was 60% (unweighted). More details about NAMCS methodology are available elsewhere (7).
The physician estimates presented in this report reflect physicians who participated in NAMCS by providing data on a sample of their office visits. Note that NAMCS physician estimates (8–10) are lower than comparable AMA–AOA estimates because each year, about one-third of the NAMCS physician sample is found to be out of scope when contacted by interviewers (7).
Data for sampled physicians were collected during an induction interview. In cases where physicians worked at multiple offices, whether the physician worked evening or weekend hours was reported for the office where most visits occurred. Estimates for 2009–2010 exclude missing data for the following items:
- For new patients, which types of payment do you accept: private insurance (6.3%), Medicare (3.7%), Medicaid (2.9%), or self-pay (3.0%)?
- Do you see patients in the office during the evening or on weekends? (1.4%)
- Does your practice set aside time for same-day appointments? (3.5%)
- What is the percentage of daily visits that are same-day appointments? (1.4%)
- On average, about how long does it take to get an appointment for a routine medical exam? (1.1%)
- What hours were spent providing direct patient care during the last full week of practice? (3.4%)
Note that time spent providing direct patient care does not include time spent doing administrative and nonclinical activities. Estimates for 1999–2000 exclude missing data for the following items: For new patients, which types of payment do you accept: private insurance (1.8%), Medicare (2.1%), Medicaid (3.0%), or self-pay (2.0%)?
Data analyses were performed using the statistical packages SAS version 9.2 (SAS Institute, Cary, N.C.) and SUDAAN version 9.0 (RTI International, Research Triangle Park, N.C.). Differences in practice characteristics were examined using t tests for differences at the p = 0.05 level.
About the authors
Esther Hing and Susan Schappert are with the Centers for Disease Control and Prevention’s National Center for Health Statistics, Division of Health Care Statistics.
References
- Carrier E, Yee T, Stark LB. Matching supply to demand: Addressing the U.S. primary care workforce shortage. Policy Analysis No. 7. Washington, DC: National Institute for Health Care Reform, Center for Studying Health System Change. 2011.
- Colwill JM, Cultice JM, Kruse RL. Will generalist physician supply meet demands of an increasing and aging population? Health Affairs 27(3):w232–41. 2008.
- Staiger DO, Auerbach DI, Buerhaus PI. Comparison of physician workforce estimates and supply projections. JAMA 302(15):1674–80. 2009.
- Decker SL. Changes in Medicaid physician fees and patterns of ambulatory care. Inquiry 46(3):291–304. 2009.
- Medicare Payment Advisory Commission. Report to the Congress: Medicare payment policy. 2010.
- Cunningham PJ. State variation in primary care physician supply: Implications for health reform Medicaid expansions. Research Brief No. 19. Washington, DC: Center for Studying Health System Change. 2011.
- National Center for Health Statistics. 2005–2010 NAMCS physician trend file documentation [PDF – 240 KB]. Public use data file documentation.
- Burt CW, Schappert SM. Ambulatory care visits to physician offices, hospital outpatient departments, and emergency departments: United States, 1999–2000. National Center for Health Statistics. Vital Health Stat 13(157). 2004.
- Hing E, Burt CW. Characteristics of office-based physicians and their practices: United States, 2003–04. National Center for Health Statistics. Vital Health Stat 13(164). 2007.
- Hing E, Burt CW. Characteristics of office-based physicians and their practices: United States, 2005–2006. National Center for Health Statistics. Vital Health Stat 13(166). 2008.
Suggested citation
Hing E, Schappert SM. Generalist and specialty physicians: Supply and access, 2009–2010. NCHS data brief, no 105. Hyattsville, MD: National Center for Health Statistics. 2012.
Copyright information
All material appearing in this report is in the public domain and may be reproduced or copied without permission; citation as to source, however, is appreciated.
National Center for Health Statistics
Edward J. Sondik, Ph.D., Director
Jennifer H. Madans, Ph.D., Associate Director for Science
Division of Health Care Statistics
Clarice Brown, M.S., Director


