Prevalence of Obesity Among Children and Adolescents: United States, Trends 1963-1965 Through 2007-2008
by Cynthia Ogden, Ph.D., and Margaret Carroll, M.S.P.H., Division of Health and Nutrition Examination Surveys
PDF Version (158 KB)
Healthy People 2010 identified overweight and obesity as 1 of 10 leading health indicators and called for a reduction in the proportion of children and adolescents who are overweight or obese, but the United States has made little progress toward the target goal. Progress toward reducing the national prevalence of overweight and obesity is monitored using data from the National Health and Nutrition Examination Survey (NHANES).
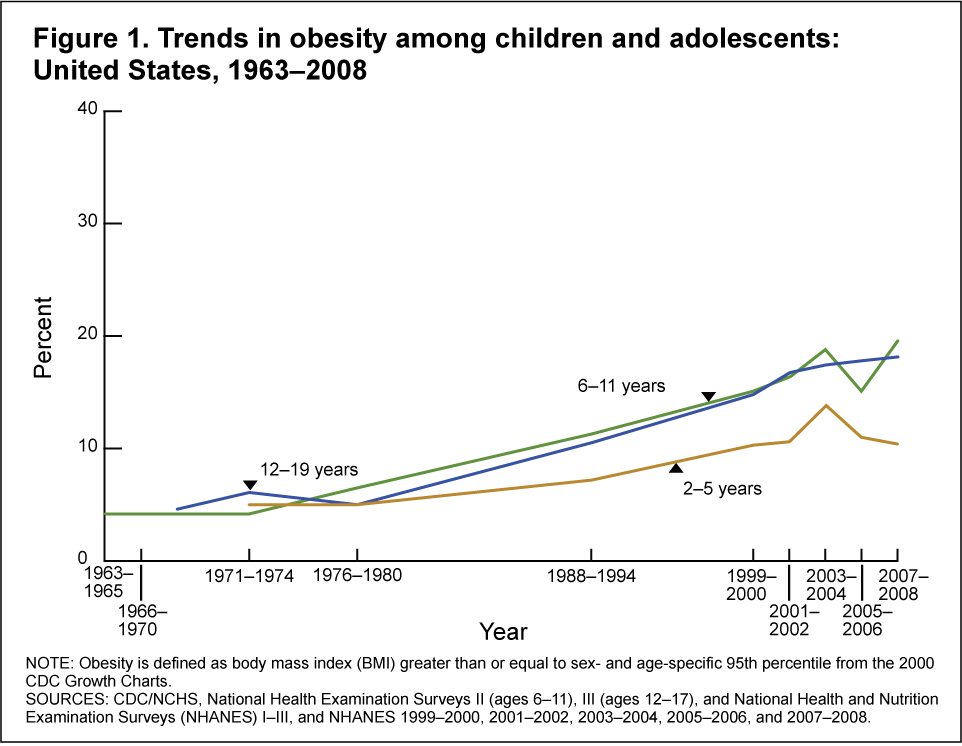
Results from the 2007-2008 NHANES, using measured heights and weights, indicate that an estimated 16.9% of children and adolescents aged 2-19 years are obese. Between 1976-1980 and 1999-2000, the prevalence of obesity increased. Between 1999-2000 and 2007-2008, there was no significant trend in obesity prevalence for any age group.
Table 1 shows the increase in obesity that has occurred since 1976-1980. Among preschool children aged 2-5, obesity increased from 5.0% to 10.4% between 1976-1980 and 2007-2008 and from 6.5% to 19.6% among those aged 6-11. Among adolescents aged 12-19, obesity increased from 5.0% to 18.1% during the same period.
Figure 1 shows the trends since the 1960s by age group.
Body mass index (BMI), expressed as weight in kilograms divided by height in meters squared (kg/m2), is commonly used to classify obesity among adults, and is also recommended in children. Cutoff criteria are based on the 2000 CDC BMI-for-age-growth charts for the United States. Based on current recommendations of expert committees, children with BMI values at or above the 95th percentile of the sex-specific BMI growth charts are categorized as obese. This is different from previous years where children above this cutoff were labeled overweight. This change in terminology reflects the labels used by organizations such as the Institute of Medicine and the American Academy of Pediatrics. For more information see Krebs NF, Himes JH, Jacobson D, Nicklas TA, Guilday P, Styne D. Assessment of child and adolescent overweight and obesity. Pediatrics 120:S193-228. 2007. Although this cutpoint is not diagnostic, elevated BMI among children indicates increased risk for future adverse health outcomes or development of disease.
Racial and ethnic disparities in adolescent obesity
There are significant racial and ethnic disparities in obesity prevalence among U.S. children and adolescents. Table 2 shows the estimates in obesity prevalence by race/ethnicity for boys and girls since NHANES III (1988-1994).
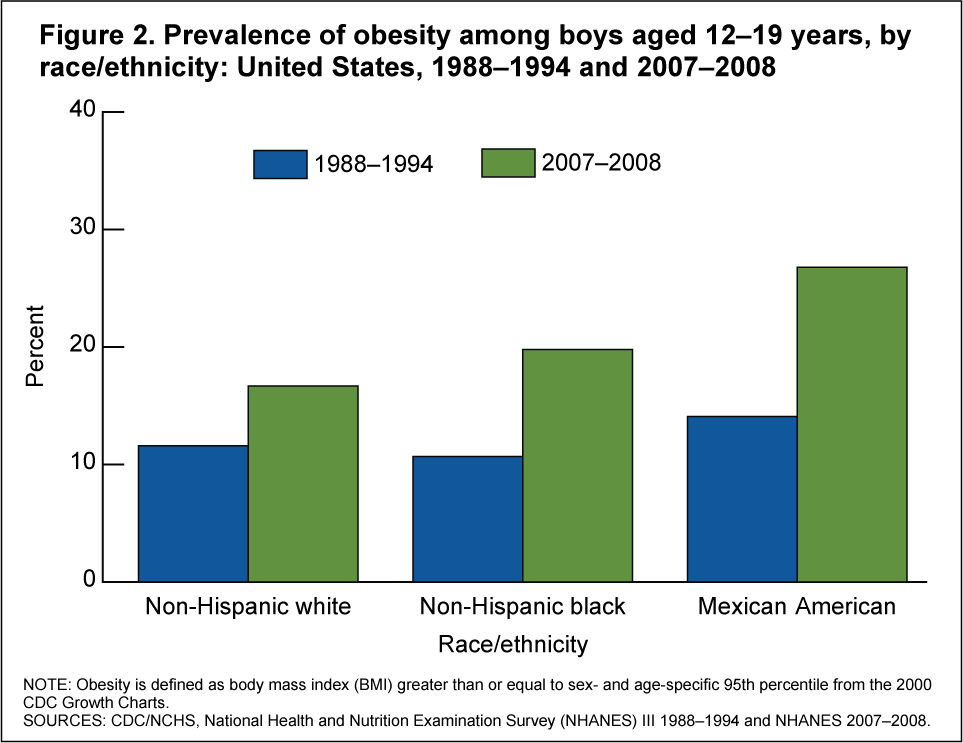
In 2007-2008, the prevalence of obesity was significantly higher among Mexican-American adolescent boys (26.8%) than among non-Hispanic white adolescent boys (16.7%). In NHANES III (1988-1994) there was no significant difference in prevalence between Mexican-American and non-Hispanic white adolescent boys.
Between 1988-1994 and 2007-2008 the prevalence of obesity increased (Figure 2):
- From 11.6% to 16.7% among non-Hispanic white boys.
- From 10.7% to 19.8% among non-Hispanic black boys.
- From 14.1% to 26.8% among Mexican-American boys.
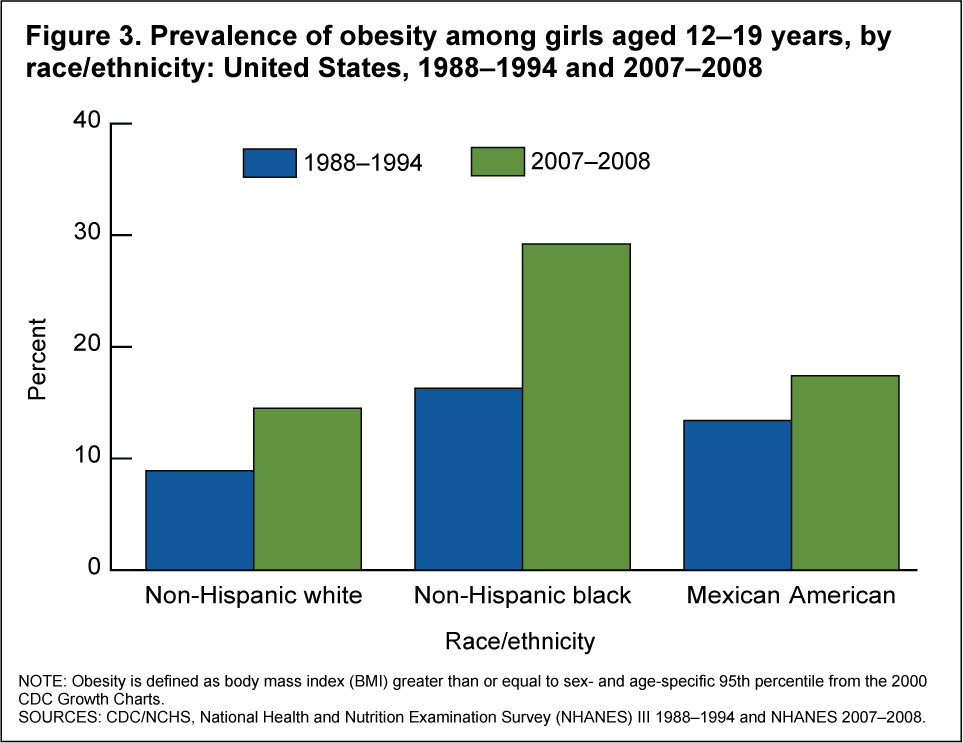
Among girls in the period 2007-2008, non-Hispanic black adolescents (29.2%) were significantly more likely to be obese compared with non-Hispanic white adolescents (14.5%). Similarly, non-Hispanic black adolescent girls (16.3%) were more likely to be obese compared with non-Hispanic white adolescent girls (8.9%) in the period 1988-1994.
Between 1988-1994 and 2007-2008 the prevalence of obesity increased (Figure 3):
- From 8.9% to 14.5% among non-Hispanic white girls.
- From 16.3% to 29.2% among non-Hispanic black girls.
- From 13.4% to 17.4% among Mexican-American girls.
NHANES used stratified, multistage, probability samples of the civilian noninstitutionalized U.S. population. A household interview and a physical examination were conducted for each survey participant. During the physical examination, conducted in a mobile examination center, height and weight were measured as part of a more comprehensive set of body measurements. These measurements were taken by trained health technicians, using standardized measuring procedures and equipment. Observations for persons missing a valid height or weight measurement or for pregnant females were not included in the data analysis.
Figures
Tables
Table 1. Prevalence of obesity among U.S. children and adolescents aged 2-19, for selected years 1963-1965 through 2007-2008
| Age (in years)1 | NHANES 1963-1965 1966-19702 |
NHANES 1971-1974 |
NHANES 1976-1980 |
NHANES 1988-1994 |
NHANES 1999-2000 |
NHANES 2001-2002 |
NHANES 2003-2004 |
NHANES 2005-2006 |
NHANES 2007-2008 |
|---|---|---|---|---|---|---|---|---|---|
| Total | (3) | 5.0 | 5.5 | 10.0 | 13.9 | 15.4 | 17.1 | 15.5 | 16.9 |
| 2-5 | (3) | 5.0 | 5.0 | 7.2 | 10.3 | 10.6 | 13.9 | 11.0 | 10.4 |
| 6-11 | 4.2 | 4.0 | 6.5 | 11.3 | 15.1 | 16.3 | 18.8 | 15.1 | 19.6 |
| 12-19 | 4.6 | 6.1 | 5.0 | 10.5 | 14.8 | 16.7 | 17.4 | 17.8 | 18.1 |
1 Excludes pregnant women starting with 1971-1974. Pregnancy status not available for 1963-1965 and 1966-1970.
2 Data for 1963-1965 are for children aged 6-11; data for 1966-1970 are for adolescents aged 12-17, not 12-19 years.
3 Children aged 2-5 were not included in the surveys undertaken in the 1960s.
NOTE: Obesity defined as body mass index (BMI) greater than or equal to sex- and age-specific 95th percentile from the 2000 CDC Growth Charts.
Table 2. Prevalence of obesity among U.S. adolescents aged 12-19, for selected years 1988-1994 through 2007-2008
| NHANES 1988-1994 | NHANES 1999-2000 |
NHANES 2001-2002 | NHANES 2003-2004 | NHANES 2005-2006 | NHANES 2007-2008 | |
|---|---|---|---|---|---|---|
| Boys, All | 11.3 | 14.8 | 17.6 | 18.2 | 18.2 | 19.3 |
| Boys, Non-Hispanic white | 11.6 | 11.8 | 16.6 | 19.1 | 15.5 | 16.7 |
| Boys, Non-Hispanic black | 10.7 | 21.1 | 16.7 | 18.4 | 18.4 | 19.8 |
| Boys, Mexican American | 14.1 | 27.2 | 21.8 | 18.3 | 25.6 | 26.8 |
| Girls1, All | 9.7 | 14.8 | 15.7 | 16.4 | 17.3 | 16.8 |
| Girls1, Non-Hispanic white | 8.9 | 11.0 | 13.7 | 15.4 | 13.5 | 14.5 |
| Girls1, Non-Hispanic black | 16.3 | 25.2 | 22.0 | 25.4 | 29.8 | 29.2 |
| Girls1, Mexican American | 13.4 | 19.3 | 20.3 | 14.1 | 25.4 | 17.4 |
1 Excludes pregnant females.
NOTE: Obesity defined as body mass index (BMI) greater than or equal to sex- and age-specific 95th percentile from the 2000 CDC Growth Charts.
For more detailed estimates see
- Ogden CL, Carroll MD, Curtin LR, McDowell MA, Tabak CJ, Flegal KM. Prevalence of overweight and obesity in the United States, 1999-2004. JAMA 295:1549-55. 2006.
- Ogden CL, Flegal KM, Carroll MD, Johnson CL. Prevalence and trends in overweight among U.S. children and adolescents, 1999-2000. JAMA 288:1728-32. 2002.
- Ogden CL, Carroll MD, Curtin LR, Lamb MM, Flegal KM. Prevalence of high body mass index in U.S. children and adolescents, 2007-2008. JAMA 303(3):242-9. 2010.