Maternal Mortality Rates in the United States, 2021
by Donna L. Hoyert, Ph.D., Division of Vital Statistics
This report presents maternal mortality rates for 2021 based on data from the National Vital Statistics System. A maternal death is defined by the World Health Organization as “the death of a woman while pregnant or within 42 days of termination of pregnancy, irrespective of the duration and the site of the pregnancy, from any cause related to or aggravated by the pregnancy or its management, but not from accidental or incidental causes” (1). Maternal mortality rates, which are the number of maternal deaths per 100,000 live births, are shown in this report by age group and race and Hispanic origin.
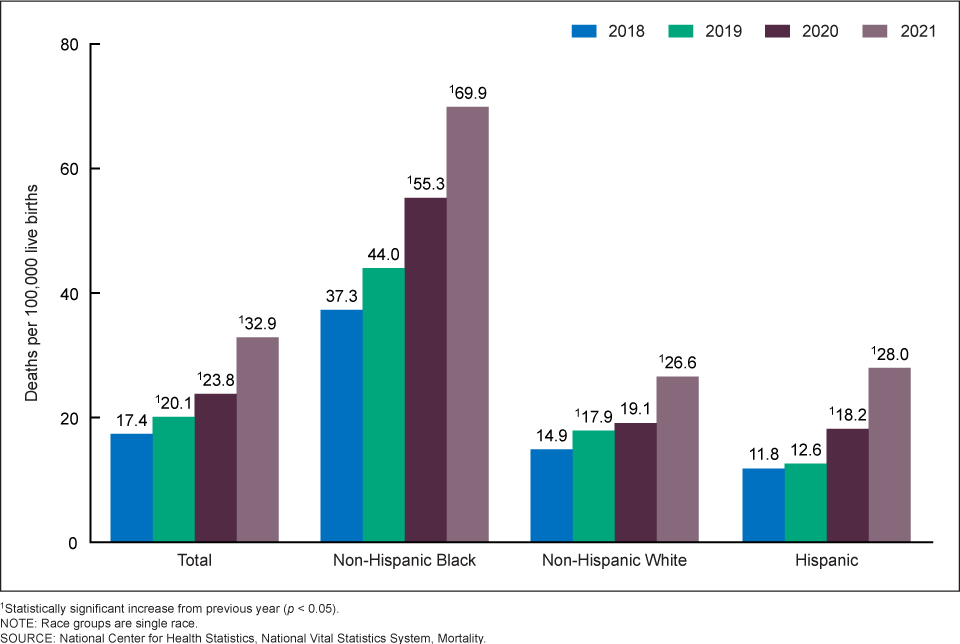
This report updates a previous one that showed maternal mortality rates for 2018–2020 (2). In 2021, 1,205 women died of maternal causes in the United States compared with 861 in 2020 and 754 in 2019 (2). The maternal mortality rate for 2021 was 32.9 deaths per 100,000 live births, compared with a rate of 23.8 in 2020 and 20.1 in 2019 (Table).
In 2021, the maternal mortality rate for non-Hispanic Black (subsequently, Black) women was 69.9 deaths per 100,000 live births, 2.6 times the rate for non-Hispanic White (subsequently, White) women (26.6) (Figure 1 and Table). Rates for Black women were significantly higher than rates for White and Hispanic women. The increases from 2020 to 2021 for all race and Hispanic-origin groups were significant.
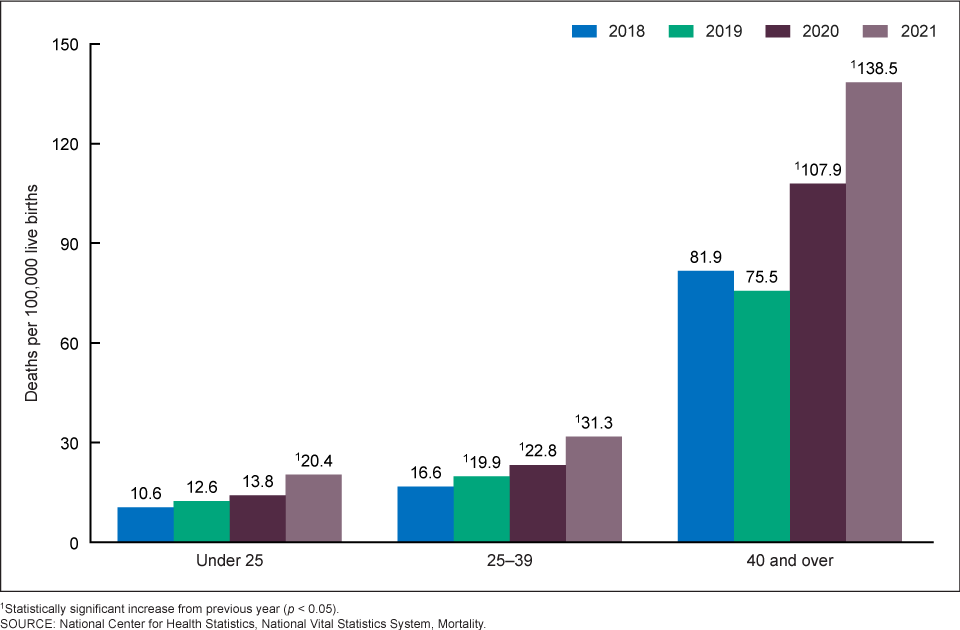
Rates increased with maternal age. Rates in 2021 were 20.4 deaths per 100,000 live births for women under age 25, 31.3 for those aged 25–39, and 138.5 for those aged 40 and over (Figure 2 and Table). The rate for women aged 40 and over was 6.8 times higher than the rate for women under age 25. Differences in the rates between age groups were statistically significant. The increases in the rates between 2020 and 2021 for each of these age groups were statistically significant.
Data source and methods
Data are from the National Vital Statistics System mortality file (3). Consistent with previous reports, the number of maternal deaths does not include all deaths occurring to pregnant or recently pregnant women, but only deaths with the underlying cause of death assigned to International Statistical Classification of Diseases, 10th Revision code numbers A34, O00–O95, and O98–O99. Maternal mortality rates are per 100,000 live births, based on data from the National Vital Statistics System natality file. Maternal mortality rates fluctuate from year to year because of the relatively small number of these events and possibly due to issues with the reporting of maternal deaths on death certificates (4). Efforts to improve data quality are ongoing, and these data will continue to be evaluated for possible errors. Data are shown for only the three largest race and Hispanic-origin groups for which statistically reliable rates can be calculated.
References
- World Health Organization. International statistical classification of diseases and related health problems, 10th revision (ICD–10). 2008 ed. Geneva, Switzerland. 2009.
- Hoyert DL. Maternal mortality rates in the United States, 2020. NCHS Health E-Stats. 2022.
DOI: https://doi.org/10.15620/cdc:113967. - Xu JQ, Murphy SL, Kochanek KD, Arias E. Mortality in the United States, 2021. NCHS Data Brief, no 456. Hyattsville, MD: National Center for Health Statistics. 2022.
DOI: https://dx.doi.org/10.15620/cdc:122516. - Hoyert DL, Miniño AM. Maternal mortality in the United States: Changes in coding, publication, and data release, 2018. National Vital Statistics Reports; vol 69 no 2. Hyattsville, MD: National Center for Health Statistics. 2020.
Suggested citation
Hoyert DL. Maternal mortality rates in the United States, 2021. NCHS Health E-Stats. 2023.
DOI: https://dx.doi.org/10.15620/cdc:124678.
Table
Table. Number of live births, maternal deaths, and maternal mortality rates, by race and Hispanic origin and age: United States, 2018–2021
| Race and Hispanic origin and age | 2018 | 2019 | 2020 | 2021 | ||||||||
| Number of live births | Number of deaths | Maternal mortality rate1 | Number of live births | Number of deaths | Maternal mortality rate1 | Number of live births | Number of deaths | Maternal mortality rate1 | Number of live births | Number of deaths | Maternal mortality rate1 | |
| Total2 | 3,791,712 | 658 | 17.4 | 3,747,540 | 754 | 20.1 | 3,613,647 | 861 | 23.8 | 3,664,292 | 1,205 | 32.9 |
| Under 25 | 907,782 | 96 | 10.6 | 877,803 | 111 | 12.6 | 825,403 | 114 | 13.8 | 797,334 | 163 | 20.4 |
| 25–39 | 2,756,974 | 458 | 16.6 | 2,739,976 | 544 | 19.9 | 2,658,445 | 607 | 22.8 | 2,731,223 | 854 | 31.3 |
| 40 and over | 126,956 | 104 | 81.9 | 129,761 | 98 | 75.5 | 129,799 | 140 | 107.9 | 135,735 | 188 | 138.5 |
| Non-Hispanic Black3 | 552,029 | 206 | 37.3 | 548,075 | 241 | 44.0 | 529,811 | 293 | 55.3 | 517,889 | 362 | 69.9 |
| Under 25 | 176,243 | 27 | 15.3 | 169,853 | 32 | 18.8 | 159,541 | 46 | 28.8 | 149,435 | 62 | 41.5 |
| 25–39 | 358,276 | 137 | 38.2 | 360,206 | 179 | 49.7 | 351,648 | 198 | 56.3 | 349,170 | 242 | 69.3 |
| 40 and over | 17,510 | 42 | 239.9 | 18,016 | 30 | 166.5 | 18,622 | 49 | 263.1 | 19,284 | 58 | 300.8 |
| Non-Hispanic White3 | 1,956,413 | 291 | 14.9 | 1,915,912 | 343 | 17.9 | 1,843,432 | 352 | 19.1 | 1,887,656 | 503 | 26.6 |
| Under 25 | 391,829 | 41 | 10.5 | 374,129 | 49 | 13.1 | 348,666 | 40 | 11.5 | 336,792 | 57 | 16.9 |
| 25–39 | 1,504,888 | 207 | 13.8 | 1,480,595 | 248 | 16.8 | 1,433,839 | 253 | 17.6 | 1,486,249 | 364 | 24.5 |
| 40 and over | 59,696 | 43 | 72.0 | 61,188 | 46 | 75.2 | 60,927 | 59 | 96.8 | 64,615 | 82 | 126.9 |
| Hispanic | 886,210 | 105 | 11.8 | 886,467 | 112 | 12.6 | 866,713 | 158 | 18.2 | 885,916 | 248 | 28.0 |
| Under 25 | 275,553 | 21 | 7.6 | 270,948 | 23 | 8.5 | 258,635 | 20 | 7.7 | 255,806 | 36 | 14.1 |
| 25–39 | 579,553 | 72 | 12.4 | 584,109 | 71 | 12.2 | 576,690 | 111 | 19.2 | 597,703 | 184 | 30.8 |
| 40 and over | 31,104 | 12 | * | 31,410 | 18 | * | 31,388 | 27 | 86.0 | 32,407 | 28 | 86.4 |
* Rate does not meet National Center for Health Statistics standards of reliability.
1Maternal mortality rates are deaths per 100,000 live births.
2Includes deaths for race and Hispanic-origin groups not shown separately, including women of multiple races and origin not stated.
3Race groups are single race.
NOTES: Maternal causes are those assigned to code numbers A34, O00–O95, and O98–O99 of the International Classification of Diseases, 10th Revision. Maternal deaths occur while pregnant or within 42 days of being pregnant.
SOURCE: National Center for Health Statistics, National Vital Statistics System, Natality and Mortality.