Key points

Best Practices
Locations can be placed based on latitude and longitude, and can also be configured to be different shapes.
The latitude and longitude can be used simply by having those as columns in your data set, and configuring them in the Columns area of the editor. The additional shapes for locations can be configured in the Visual area of the editor where the city shape has always been configured.
City styles work on all map types aside from Hex-style maps.
When including data for U.S. cities, follow these guidelines:
- To confirm that a specific city is supported, check the list of cities supported by the U.S. data map.
- Double-check the spelling of all cities in the source data file. (Washington, DC, should be listed as "District of Columbia," but it displays as Washington, DC, on the map and in the data table.
- If you are including multiple cities in the same metropolitan area, they may plot on top of one another on the map. Make certain you are following 508 guidelines:
- All data in the tooltips/modals should also be in the supporting data table.
- If the map works as a navigation aid, include the URLs in the data table.
- All data in the tooltips/modals should also be in the supporting data table.
Quick Build Notes
- Select a map as the Visualization Type.
- Upload your data.
- Type in the title and other text fields in the General panel.
- Select the Geography column.
- Select the Data Column.
- Select Latitude and Longitude columns if needed for cities.
- Use the Visual panel to set conditions for cities if desired.
Configuration Options
The example visualizations below highlight options available for maps with cities. Key configuration selections are in the build notes section under each example.
Don't forget to check out the General Map page for additional map guidance.
For in-depth configuration information visit the Configuration Options section.
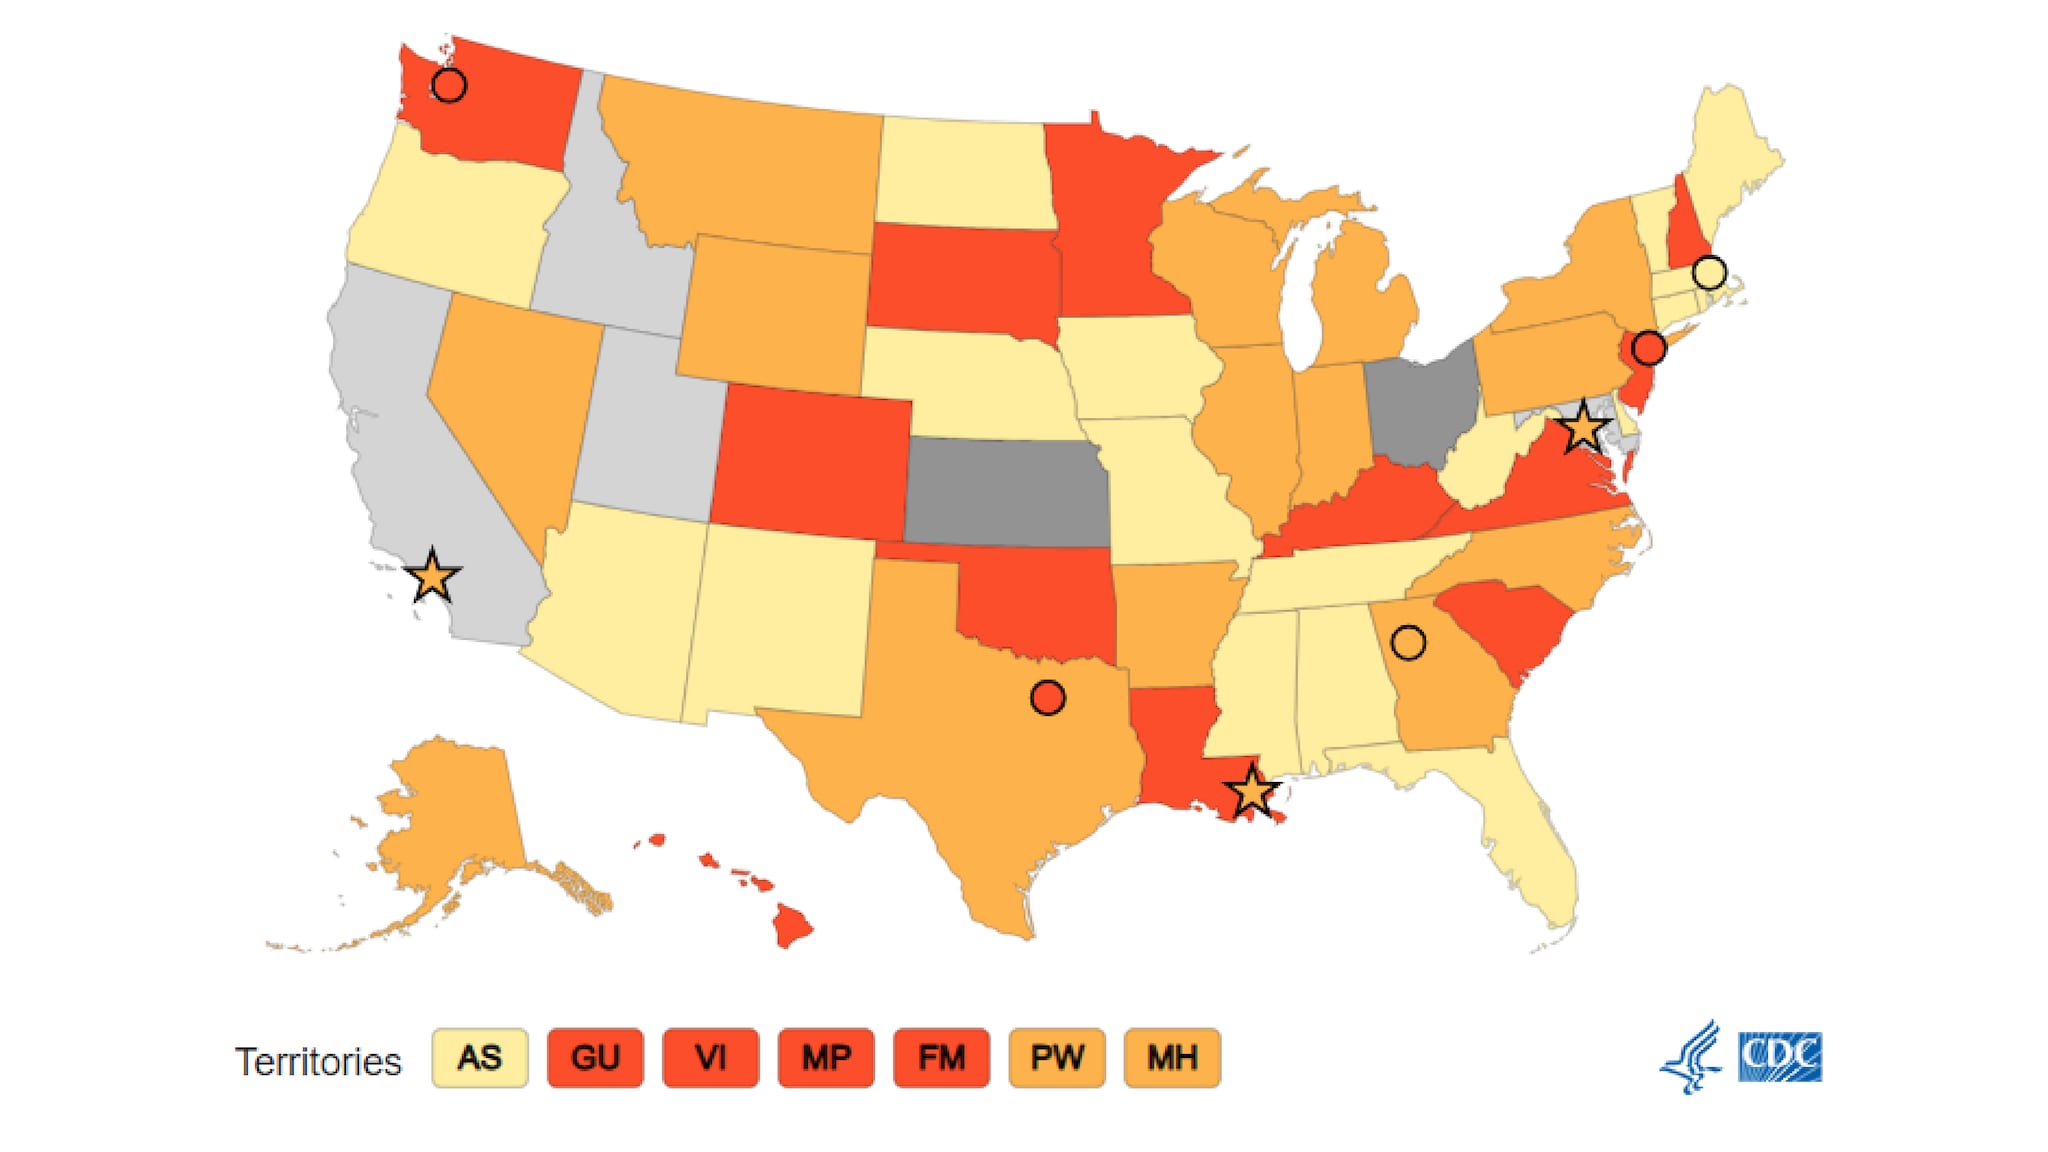
Example US Map with Cities
The map below has a conditional city style added for contrast. Up to 6 city styles can be selected, including the default style.
Note that in the example here, the cities used are on the list of 100 cities cited above, so latitude and longitude are not included in the data.
Sample Data: Example City Style
- Vertical
- Multiple Series: No
- Geography: State
- Hide Geography Column Name in Tooltip
- Data Column: Rate
- Data Label: Rate
- Add Special Class - Data Key: Rate, Value: *, Label: No Data
- Add Special Class - Data Key: Rate, Value: NA, Label: Not Applicable
- Add Column - Column: Location, Label: Location, Show in Data Table, Show in Tooltip
- Default City Style: Circle
- Add City Style - Column with Configuration Value: Location, Value to Trigger: Vehicle, Shape: Star, Label: New Locations
