Key points

Best Practices
Single State maps function the same as a US County-level map, but only display one state at a time. If your data shows more than one state, add a state-level filter to allow users to select which state to view.
Quick Build Notes
- Select a U.S. State map as the Visualization Type.
- Upload your data.
- Type in the title and other text fields in the General panel.
- Select the Geography column.
- Select the Data Column.
- Select Latitude and Longitude columns if needed for cities.
Configuration Options
The example visualizations below highlight options available for single state maps. Key configuration selections are in the build notes section under each example.
Don't forget to check out the General Map page for additional map guidance.
For in-depth configuration information visit the Configuration Options section.
Example Single State Map
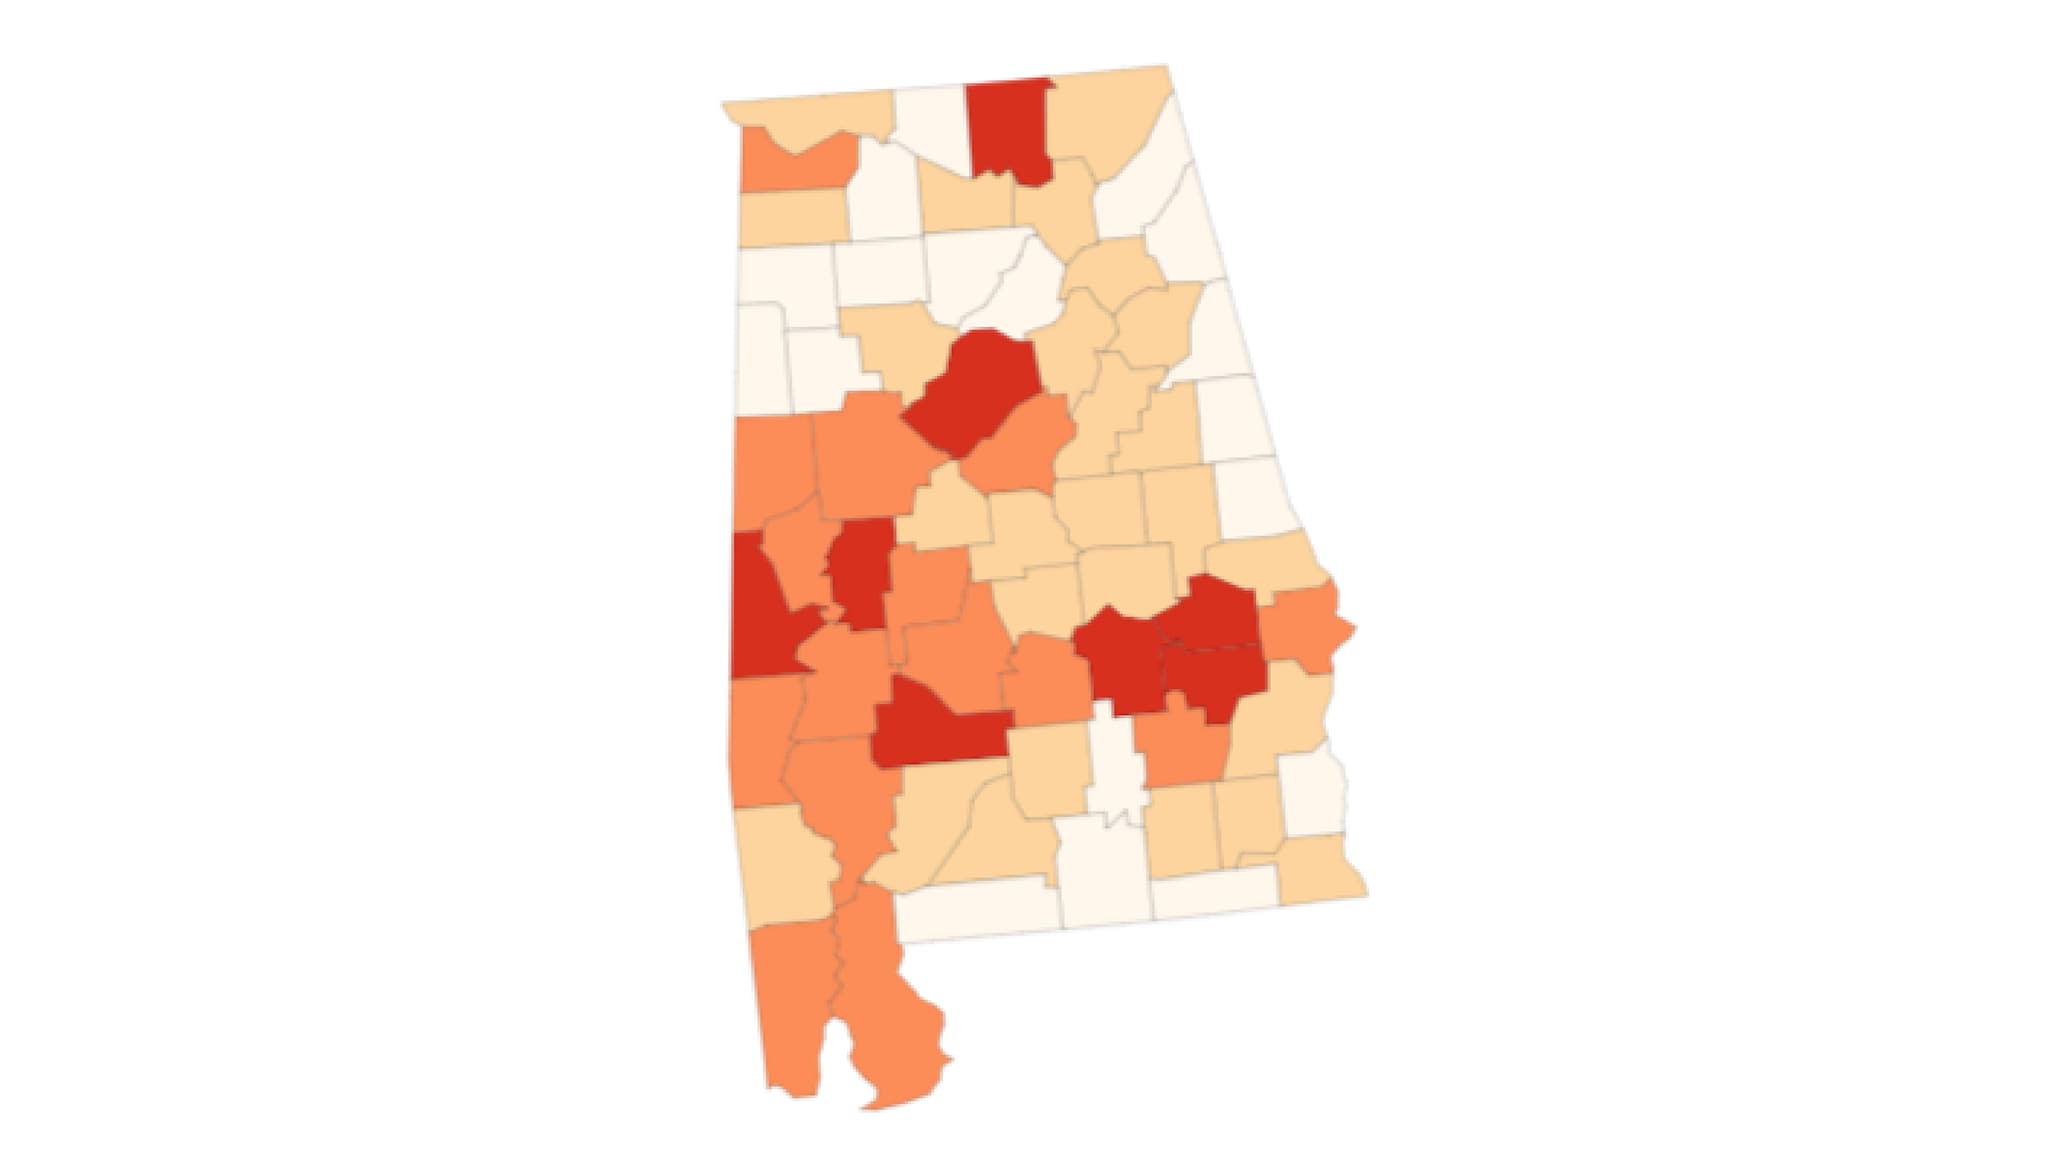
This example map shows a state map divided by county. Please ensure if your data is from a specific date, that you have added the correct County Census Year in the Type panel.
Sample Data: Single State Data
- Vertical
- Multiple series: No
- County Census Year: 2019
- State Selector: Alabama
- Geography: FIPS Code
- Data Column: Percent Vaccinated
- Data Label: Percent Vaccinated
Example Map with Census Filter
The County Census Year can be set via filter, such as the Alaska map below. Note that one of the counties in the lower right side is divided when switching to data from 2020.
Sample Data: Alaska County Year Data
- Vertical
- Multiple series: No
- County Census Year: 2019
- Filter Controlling Census Year: Year Note that this filter must be set up in the Filter panel before it can be selected.
- State Selector: Alaska
- Geography: FIPS
- Data Column: Value
- Filter Behavior: Apply button
- Add Filter - Label: Year, Filter Column: Year, Show Filter Input, Filter Style: Dropdown, Filter Order: Ascending Alphanumeric
Example Map with State Filter and Zoom
If your data set has more than one state, you can use the Type panel to apply a state filter. This will change the state that is displayed. Additionally, you can use the Visual panel to enable zoom on single state maps.
Sample Data: Single State Filter Zoom Data
- Vertical
- Multiple series: No
- County Census Year: 2019
- Filter Controlling State Picked: State
- State Selector: California
- Geography: FIPS Codes
- Data Column: Insured Rate
- Latitude: Latitude
- Longitude: Longitude
- Filter Behavior: Apply Button
- Add Filter - Label: State, Filter Column: State, Show Filter Input, Filter Style: Dropdown, Filter Order: Ascending Alphanumeric
Example Map with Custom Selected States
For some instances, you may need to display a small subset of states. For best results, these states should be located geographically close, as the states will be displayed as they are on a full choropleth map.
Sample data: Sample County Map Data
- Vertical
- Multiple series: No
- County Census Year: 2019
- States Selector: Alabama, Florida, Georgia, South Carolina
- Geography: FIPS Codes
- Data Column: Percent Vaccinated
- Legend Style: Boxes
- Separate Zero
- Number of Items: 5
