Key points

Best Practices
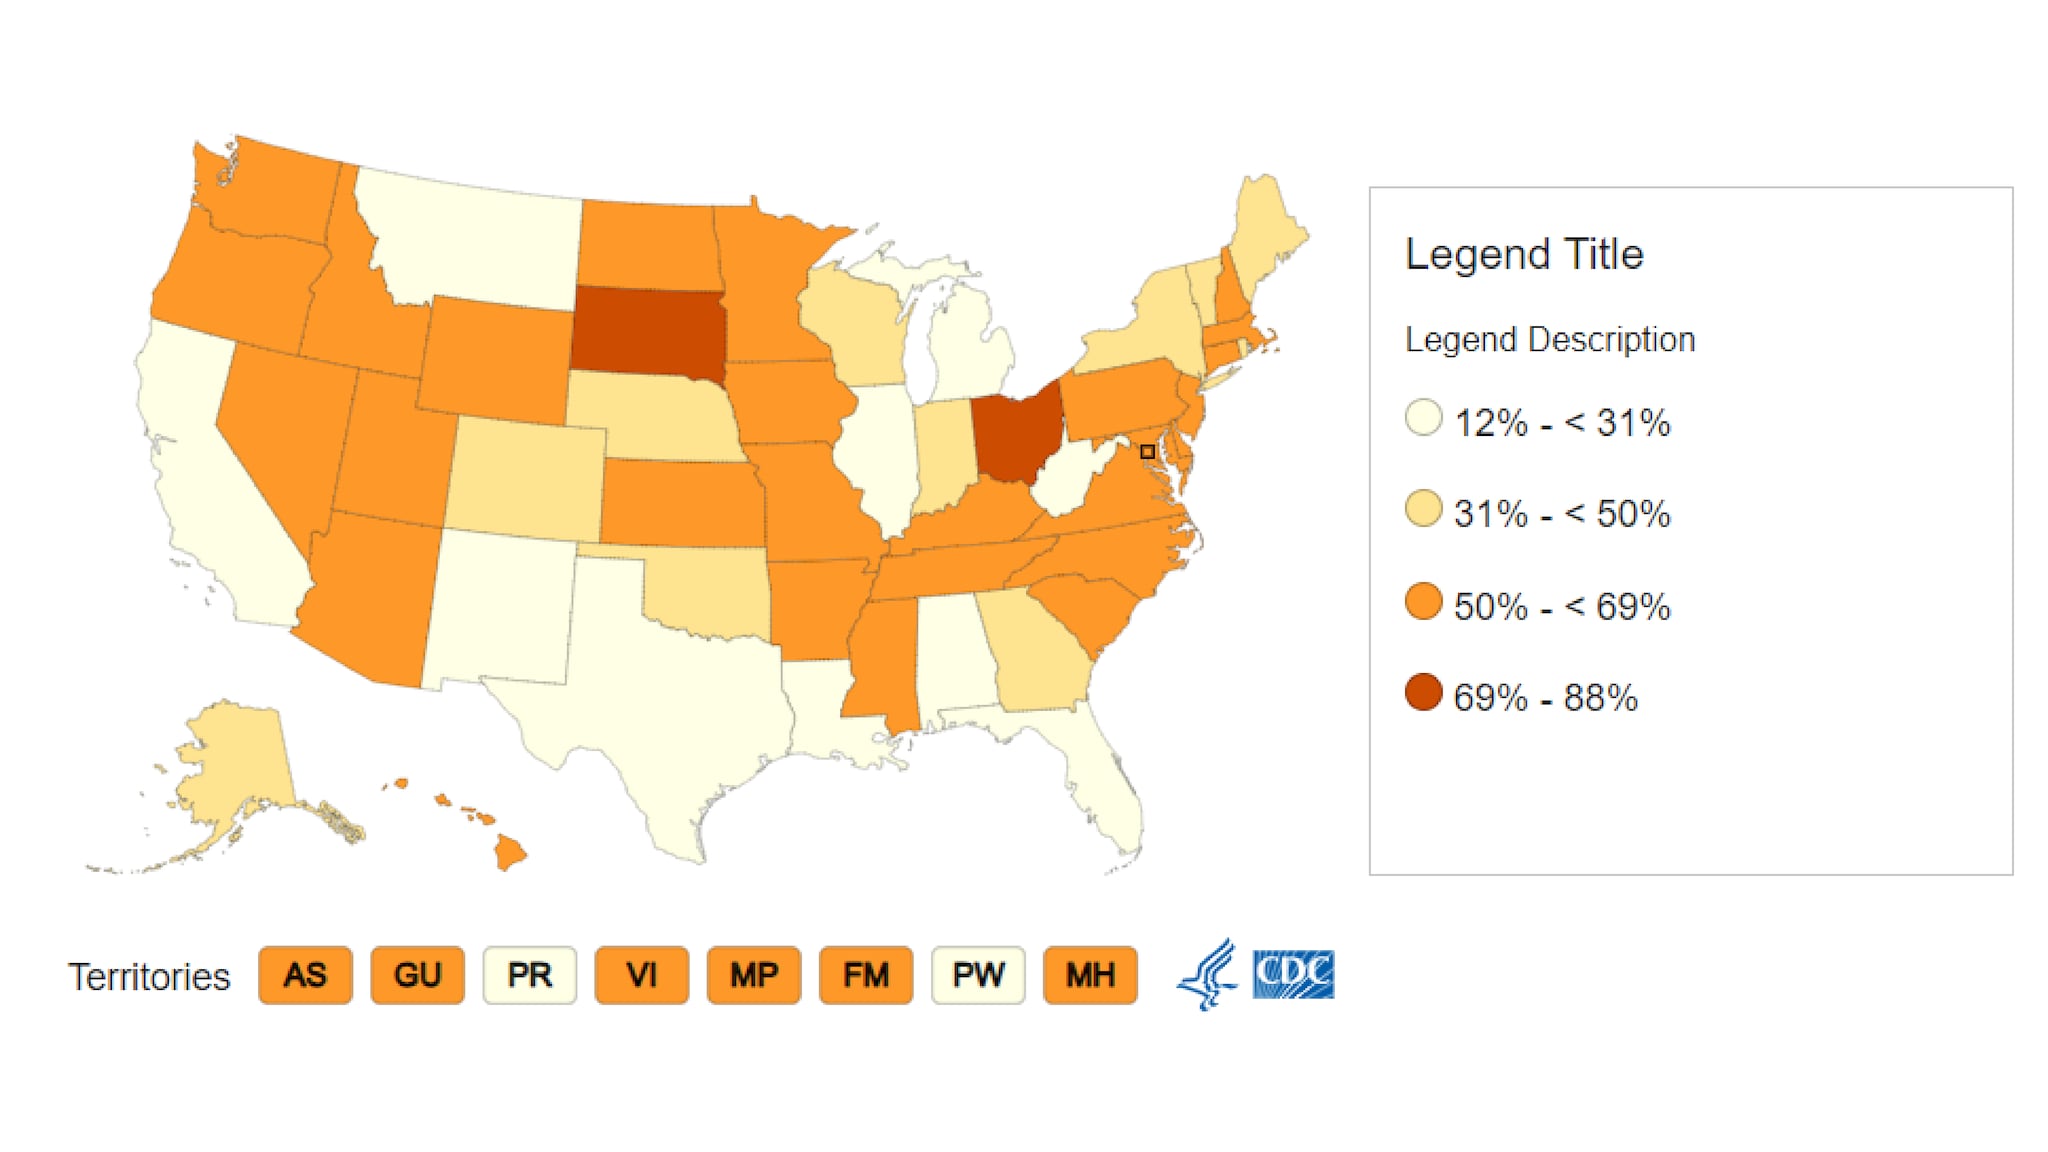
The maps below present the same source data in the same number of classes (four), but demonstrate an equal-interval map, an equal-number (quantile) map, and a New Quantile equal-number map. The equal-interval scheme divides the numeric range into subranges of equal size; the equal-number scheme places the states into classes of the same size (in this case, four classes with roughly 14 states / territories in each).
Note that all of these maps use the Colorblind Safe Palette. The Okabe-Ito color palette was proposed by Okabe and Ito (2008) as a qualitative color palette that is accessible to people with a variety of forms of color vision deficiency. Although certain colors in the palette may not meet Section 508 conformance for non-text contrast, the availability of a colorblind safe palette gives more options for COVE visualizations.
Quick Build Notes
- Select a map as the Visualization Type.
- Upload your data.
- Type in the title and other text fields in the General panel.
- Select the Geography column.
- Select the Data Column.
- Choose the legend type from the Legend panel.
Configuration Options
The example visualizations below highlight options available for map legend types. Key configuration selections are in the build notes section under each example.
Don't forget to check out the General Map page for additional map guidance.
For in-depth configuration information visit the Configuration Options section.
Example Equal Interval Map
Note that the equal-interval map highlights that South Dakota and Ohio are outliers. The decision to use equal-interval vs. equal-number classification depends on the content owner’s public health message regarding the data.
Tooltips on this map use the “click - on popover” action, which displays the state data in a modal with a “learn more” link to supporting content.
Sample Data:
- Vertical
- Multiple Series: No
- Geography: United States
- Geography subtype: US-State Level
- Numeric/Quantitative
- Geography: State
- Geography Label: Location
- Data Column: Rate
- Data Label: Rate
- Navigation: URL
- Add Additional Column - Column: Location, Label: Location, Show in Data Table, Show in Tooltip
- Legend Type: Equal Interval
- Single Column Legend
- Number of Items: 4
- Detail Displays On: Click - Popover Modal
- Tooltips Link Label: Learn More
- Colorblind Safe Palette
- Geocode Circle Size: 2
- Default City Style: Square
Example Equal Number Map
Tooltips on this map use the “hover” action, which displays the state data in an on-hover tooltip. To navigate to the supporting content, click the state.
Sample Data:
- Vertical
- Multiple series: No
- Geography: United States
- Geography subtype: US-State Level
- Numeric/Quantitative
- Geography: State
- Geography Label: Location
- Data Column: Rate
- Data Label: Rate
- Navigation: URL
- Add Additional Column - Column: Location, Label: Location, Show in Data Table, Show in Tooltip
- Legend Type: Equal Number (Quantile)
- Single Column Legend
- Number of Items: 4
- Detail Displays On: Hover - Tooltip
- Colorblind Safe Palette
- Geocode Circle Size: 2
- Default City Style: Square
Example Equal Number Map - New Quantile
Note that the above example has some overlapping numbers in the legend that aren't quite clear (one category is 12-40 and the next is 40-55). If you want to ensure there are no overlaps in the legend, you can use the New Quantile legend, but be aware that it can look quite different from the regular Equal Number.
Note that this map highlights South Dakota and Ohio, like the equal interval map, but also includes Washington.
Sample Data:
- Vertical
- Multiple series: No
- Geography: United States
- Geography subtype: US-State Level
- Numeric/Quantitative
- Geography: State
- Geography Label: Location
- Data Column: Rate
- Data Label: Rate
- Navigation: URL
- Add Additional Column - Column: Location, Label: Location, Show in Data Table, Show in Tooltip
- Legend Type: Equal Number (Quantile)
- Single Column Legend
- Use New Quantile Legend
- Number of Items: 4
- Detail Displays On: Hover - Tooltip
- Colorblind Safe Palette
- Geocode Circle Size: 2
- Default City Style: Square
