Key points

Best Practices
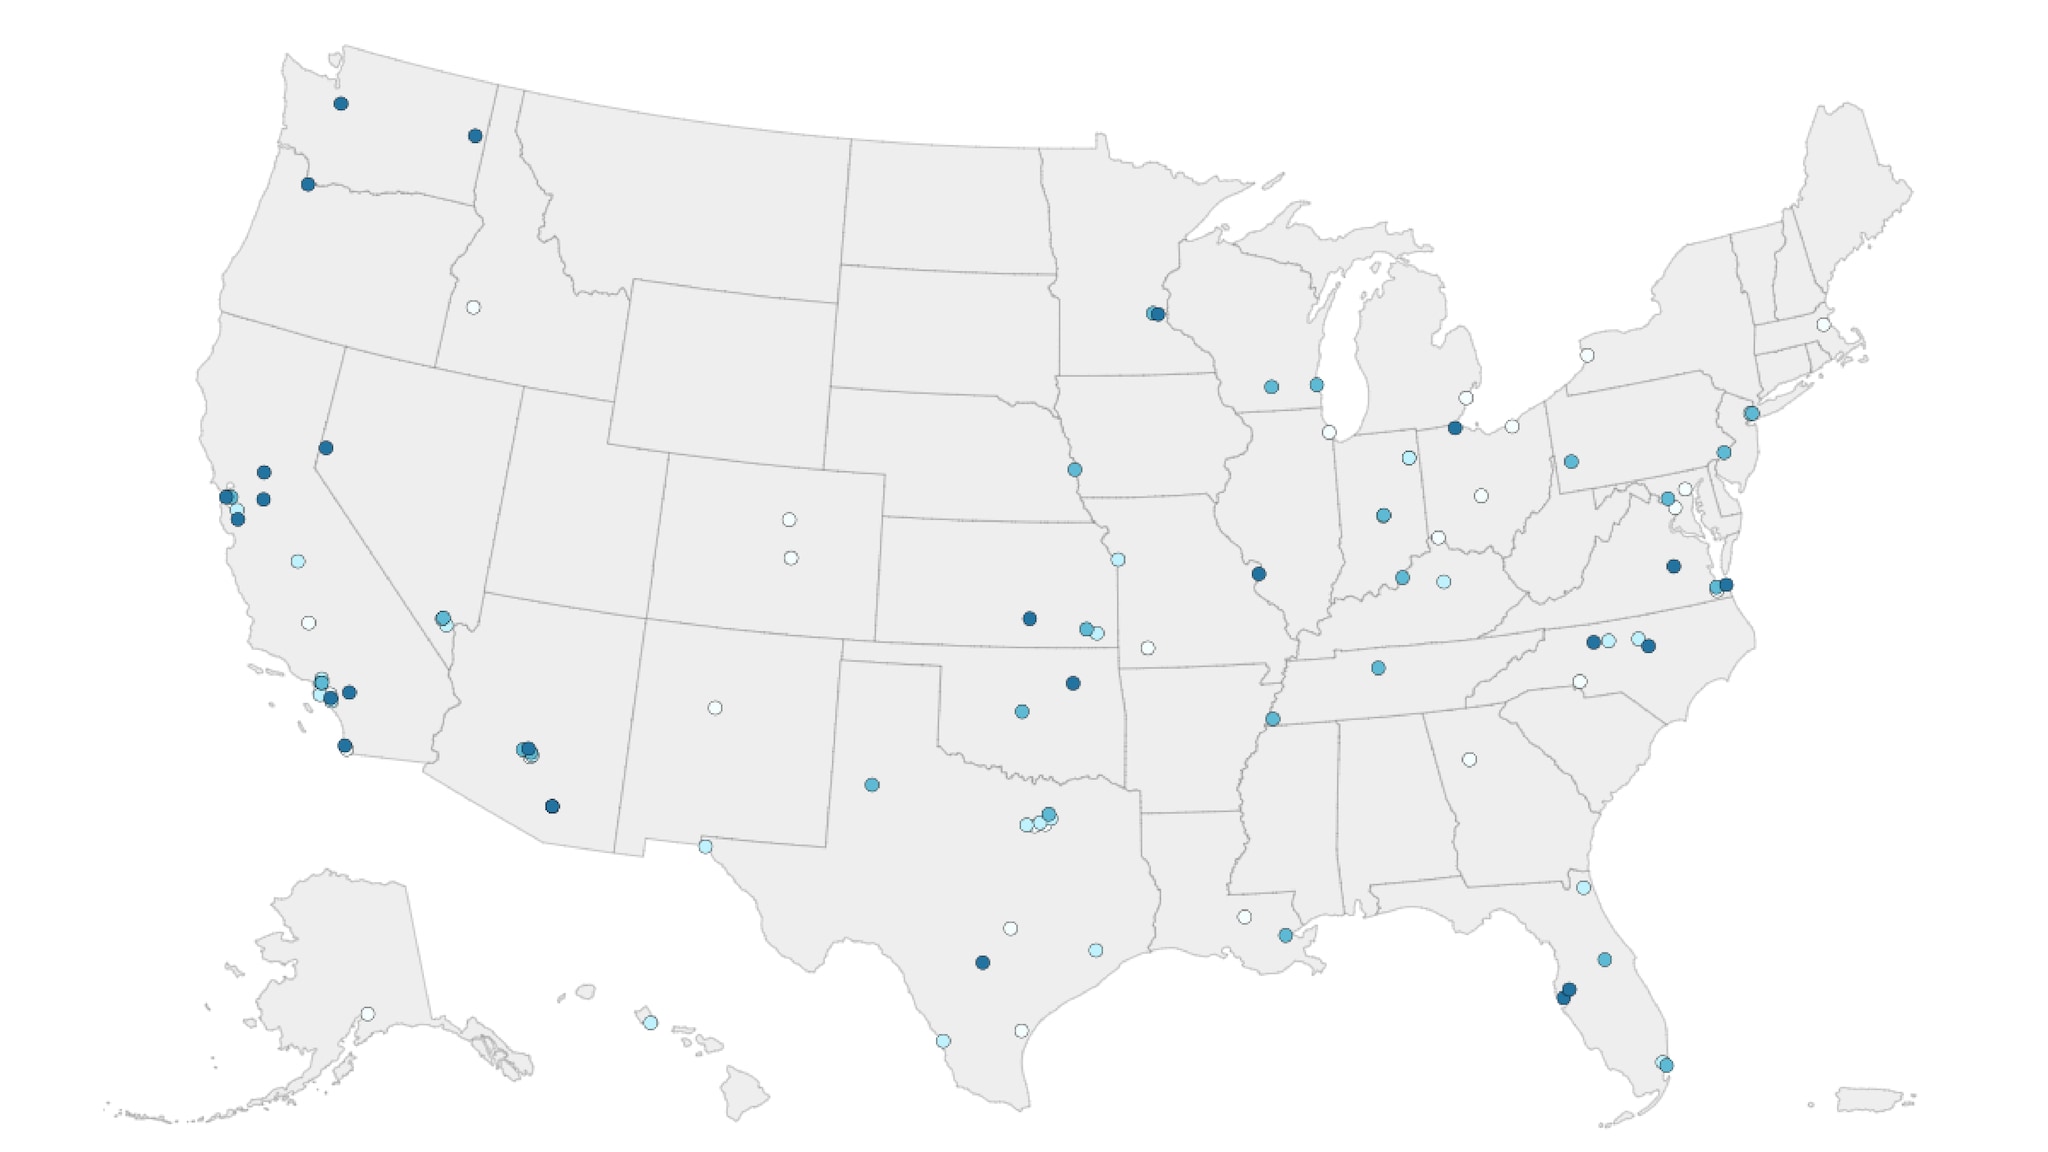
The map displays as the entire U.S. map but the user can click each state to zoom into the county-level view for finer clarity and readability.
Quick Build Notes
- Select Geocode Map as the Visualization Type.
- Upload your data.
- Set the Geography to United States and the Geography subtype to US County-Level.
- Set the Map Type to Geocode.
- Type in the title and other text fields in the General panel.
- Select the Geography column.
- Select the Data Column.
- Select Latitude and Longitude columns.
Configuration Options
The example visualizations below highlight options available for geocode maps. Key configuration selections are in the build notes section under each example.
Don't forget to check out the General Map page for additional map guidance.
For in-depth configuration information visit the Configuration Options section.
Example US Geocode Map
Click the map to zoom in on individual states.
Sample Data: Example US Geocode Map
- Vertical
- Multiple Series: No
- Geography: United States
- Geography Subtype: US County-Level
- Map Type: Geocode
- Geography: City
- Convert FIPS Codes to Geography Name
- Hide Geography Column Name in Tooltip
- Data Column: Value
- Latitude Column: Latitude
- Longitude Column: Longitude
- Legend Position: Bottom
- Single Row Legend
- Geocode Circle Size: 4
- Default City Style: Circle
