Key points

Best Practices
A custom layer requires geographic data in TopoJSON format. You must publish this file and enter the URL in the Custom Map Layers panel in the Configure tab.
In the Custom Map Layers panel you can control visual details such as the color and opacity of the area shading and the stroke color and width. You can also add a tooltip.
You can add multiple layers, but try to avoid overwhelming your map users with area shading. Consider creating multiple maps when you need to highlight more than a few geographic areas.
Configuration Options
The example visualizations below highlight options available for custom layer maps. Key configuration selections are in the build notes section under each example.
Don't forget to check out the General Map page for additional map guidance.
For in-depth configuration information visit the Configuration Options section.
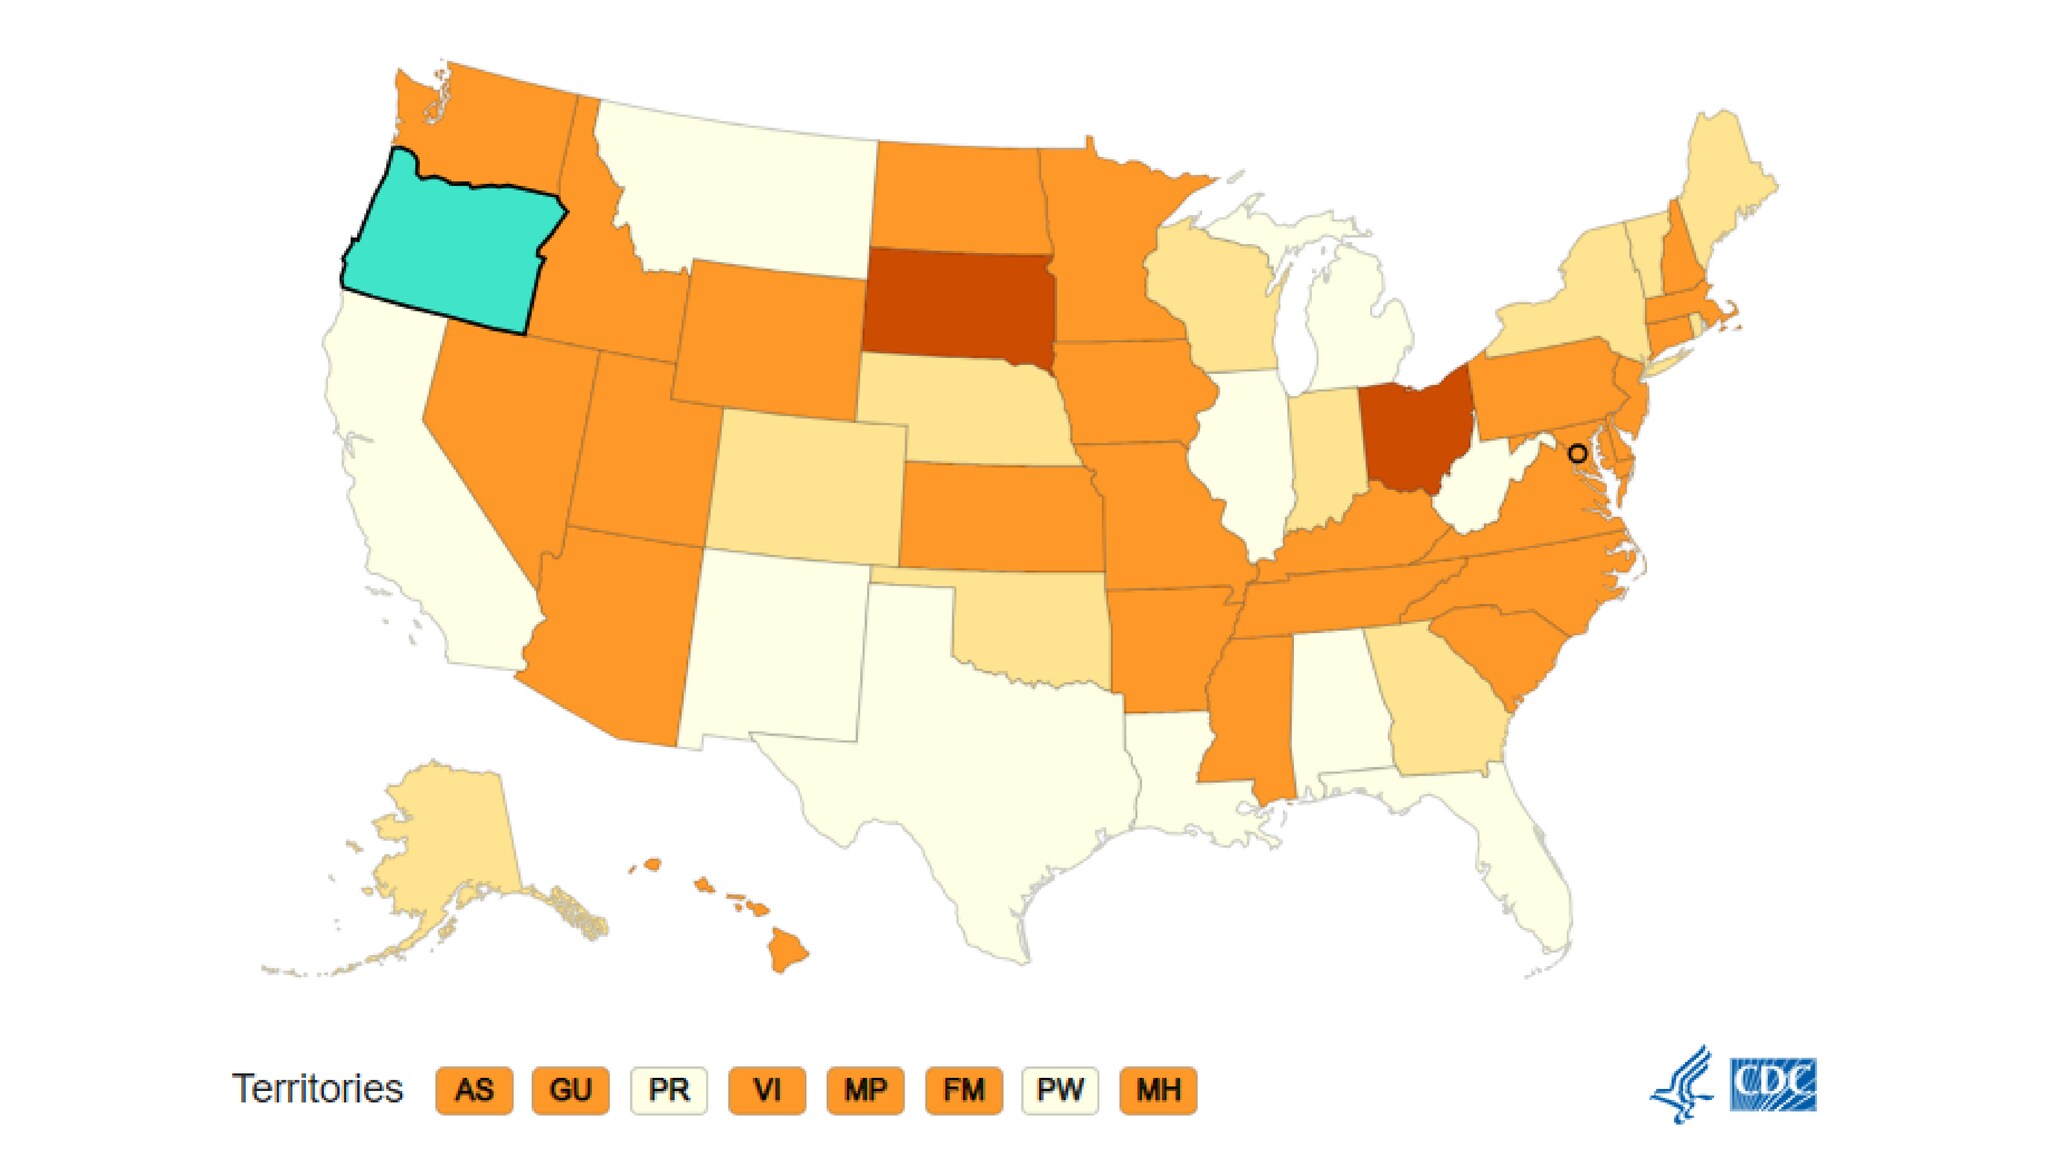
Example Custom Layer Map
Any shape can be configured for these types of maps, they do not need to be a specific state, as in this example.
Sample Data: Sample State Data
Sample Topojson: Oregon Topo
- Vertical
- Multiple series: No
- Geography: State
- Data Column: Rate
- Data Label: Rate
- Navigation: URL
- Add Column - Column: Location, Label: Location, Show in Data Table, Show in Tooltip
- Layer Name: Oregon
- File: https://www.cdc.gov/wcms/4.0/cdc-wp/data-presentation/data/oregon-topojson.json
- Topojson Namespace: cove (1)
- Fill Color: Aqua
- Fill Opacity (%): 75
- Stroke Width: 2
- Tooltip: Oregon
