Key points

Best Practices
Use a data map to display geographically color-coded numeric or categorical data. A data map can also serve as a navigation aid if URLs are provided in the data file.
Quick Build Notes
- Select a map as the Visualization Type.
- Upload your data.
- Set the Data Classification Type to Categorical.
- Type in the title and other text fields in the General panel.
- Select the Geography column.
- Select the Data Column.
- Select Latitude and Longitude columns if needed for cities.
Configuration Options
The example visualizations below highlight options available for categorical maps. Key configuration selections are in the build notes section under each example.
Don't forget to check out the General Map page for additional map guidance.
For in-depth configuration information visit the Configuration Options section.
Example Categorical US Map
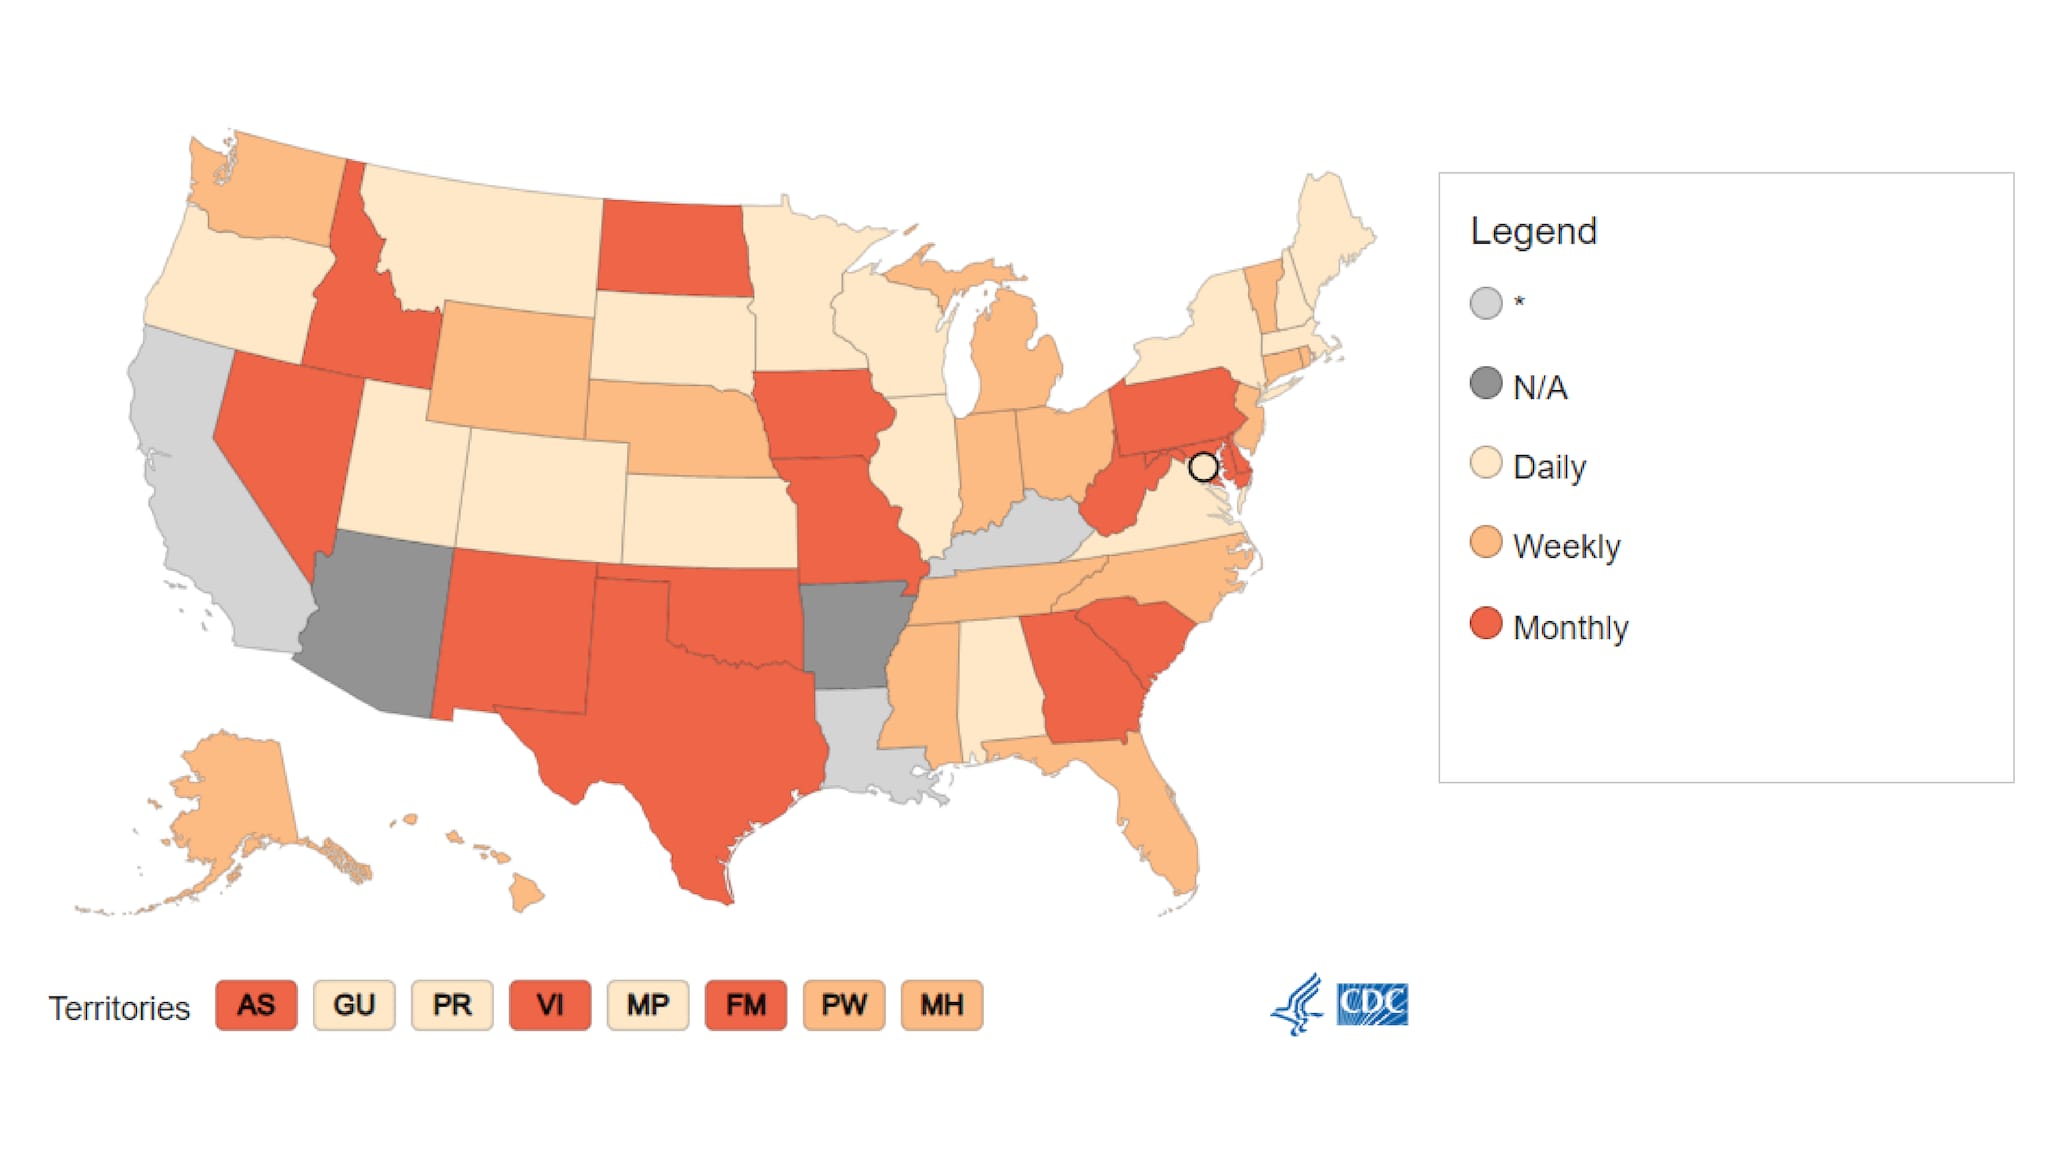
This example illustrates a categorical map can be based on a scale or intensity range.
It also illustrates the use of special classes, in this case two special classes for “*” and “NA” values.
Sample Data: Example Categorical US Map
- Vertical
- Multiple Series: No
- Geography: State
- Data Column: Frequency
- Add Special Class - Data Key: Frequency, Value: *, Label: *
- Add Special Class - Data Key: Frequency, Value: NA, Label: N/A
Example Qualitative Categorical US Map
Categorical maps that are not based on a scale or intensity range are called qualitative maps.
Sample Data: Example Qualitative Categorical US Map
- Vertical
- Multiple Series: No
- Geography: State
- Data Column: Location
- Navigation: URL
- Add Column - Column: Rate, Label: Rate, Show in Data Table, Show in Tooltips
