At a glance
CDC's Center for Forecasting and Outbreak Analytics (CFA) is working to make infectious disease outbreak forecasting as routine as weather forecasting. CFA aims to empower people to save lives and protect communities from public health threats by harnessing cutting-edge analytics to create forecasts and improve response to public health emergencies. This includes building modeling tools that utilize signal fusion, in which data streams from multiple sources are used to produce more accurate modeling and analytics for public health.
As of May 2024
Data Update
How is wastewater used to monitor disease?
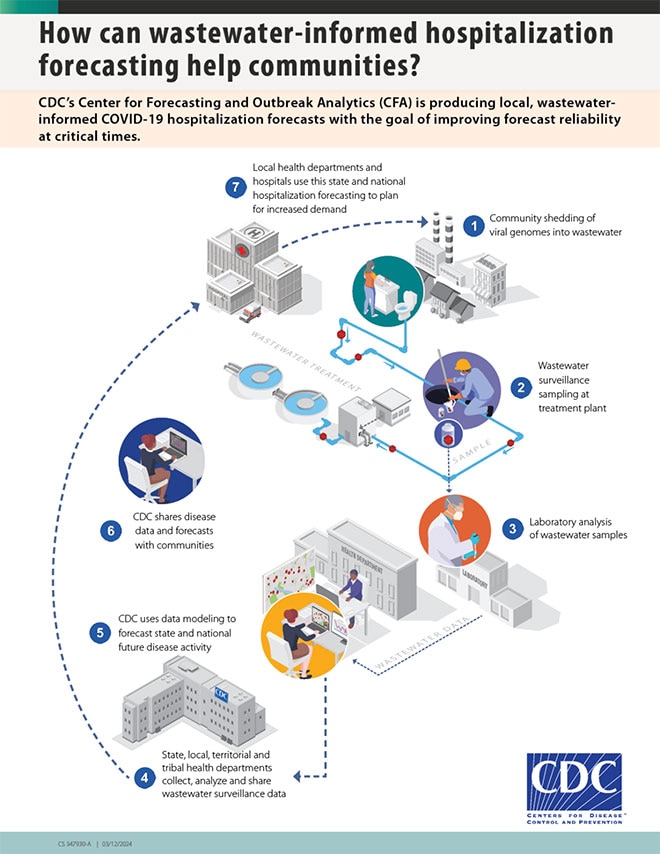
Monitoring pathogens in wastewater can help track community spread of COVID-19 and other diseases (Figure 1). Infected individuals shed viral genomes in wastewater that travel through the sewage system. Samples can be taken from the wastewater and tested in a laboratory for the virus that causes COVID-19. Public health officials can use this data to understand disease transmission in their communities and make informed decisions regarding public health response.
There are multiple advantages to monitoring pathogens in wastewater. Both symptomatic and asymptomatic people infected with COVID-19 can shed virus into wastewater, and people who do not have access to healthcare, or who do not seek healthcare when sick, may also still be captured by monitoring wastewater. In addition, wastewater monitoring can be implemented in many communities since nearly 80 percent of U.S. households are served by municipal wastewater collection systems. Furthermore, wastewater monitoring can detect emerging SARS-CoV-2 variants of concern—and a range of other infectious disease threats—that may be spreading in communities. Read more about the National Wastewater Surveillance System.
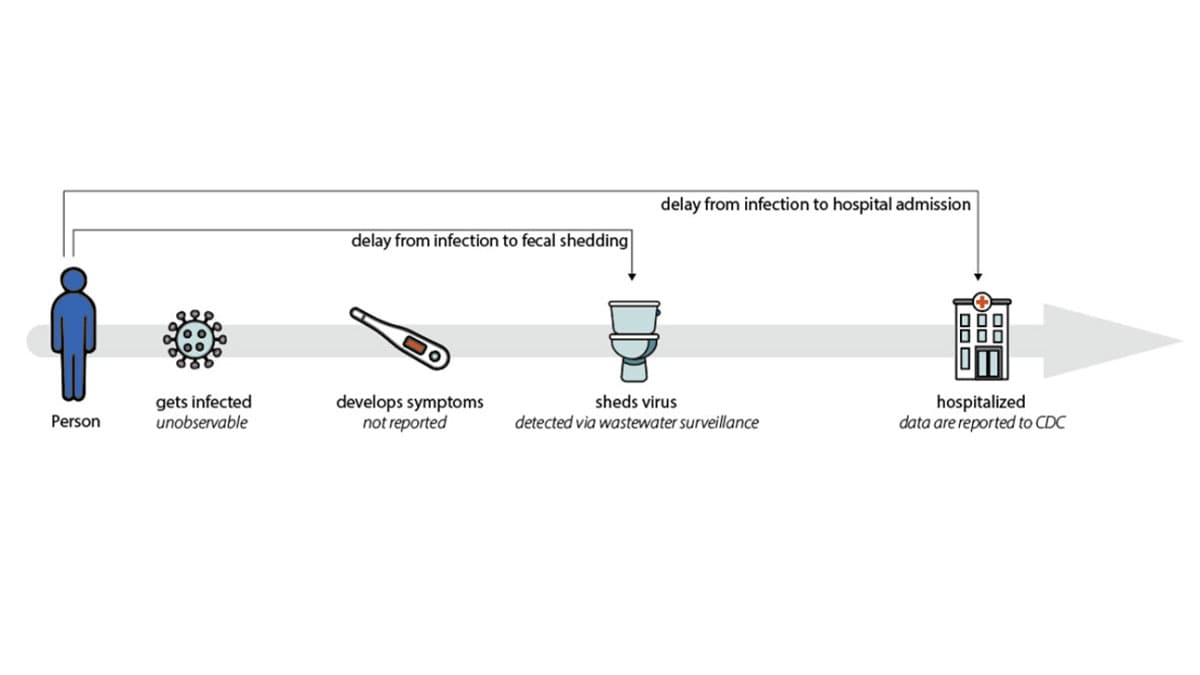
When people become infected with SARS-CoV-2, they usually shed the virus before they become sick enough to be hospitalized. In fact, the amount of virus shed in stool is highest around the time symptoms begin, whereas hospitalization often occurs one to two weeks after symptoms begin. In addition, hospital admissions can take a week or more to be reported to CDC, while wastewater testing data are often available within a week of the samples being collected (Figure 2).
Wastewater data can help us forecast hospital admissions
Data from wastewater monitoring complement existing COVID-19 data systems and are most useful in combination with other types of data used to monitor COVID-19. We are using wastewater data alongside hospital admissions data to forecast COVID-19 hospital admissions at the state and national levels. Forecasts of disease spread help inform public health decision-making by projecting the likely impact of COVID-19 in the next few weeks.
Two key features of these forecasts are:
- Incorporating the complex wastewater data into forecasts of hospital admissions, and
- Combining multiple data sources (in this case, data on COVID-19 hospital admissions and wastewater data) to generate a forecast of a key public health indicator (COVID-19 hospital admissions).
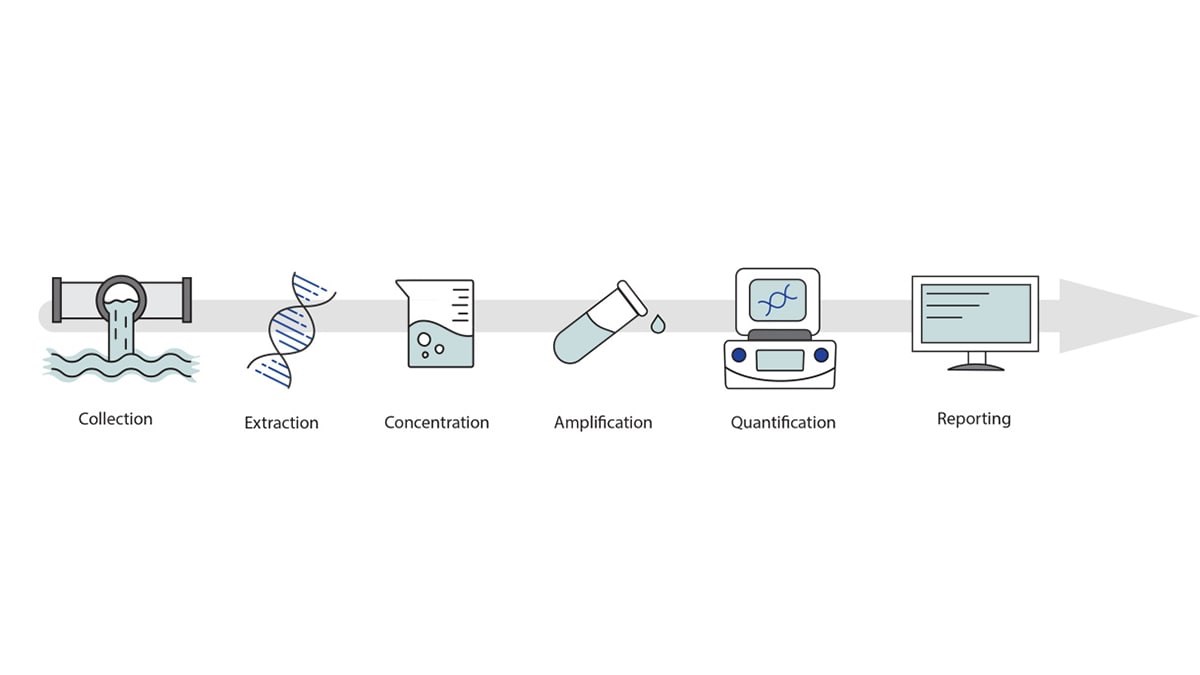
Wastewater monitoring is a rapidly developing field, and wastewater data can be complex to analyze (Figure 3). For example, a wastewater sample might represent just a few thousand people in some parts of the country, while in other areas, more than a million people are represented in the wastewater sample collected from a wastewater treatment plant. Some states and territories sample wastewater from several locations, whereas others sample from one or two. Likewise, some wastewater treatment plants collect several samples per week, whereas others collect less frequently, with the time from sample collection to data reporting varying as well. Lastly, sample collection methods and laboratory techniques to detect and quantify SARS-CoV-2 vary across different facilities.
To generate these forecasts, we use an analytic method that looks back at recent data from a particular site; analyzes the variability in the data and the relationship between the site’s typical concentration values compared with other sites in the same state; and uses these learned relationships to interpret what a recent data point might indicate about underlying disease transmission. This method doesn’t standardize or normalize the data to make different collection methods and lab processing techniques directly comparable, nor are the data “smoothed” to reduce the noise in the data. Instead, the quantity that is directly measured—the viral copies per unit volume, or viral concentration—is modeled for each site and laboratory to generate the expected observations. This approach represents the first time that wastewater data have been incorporated into CDC forecasts, as well as the first time CDC has published COVID-19 hospital admissions forecasts using in-house models.
As humans, we often combine multiple data sources in our heads to understand something we can't directly measure. During the COVID-19 pandemic, health departments routinely reviewed multiple data streams, such as hospital admissions, new cases, test positivity rates, and wastewater data, to assess the level of COVID-19 transmission in their communities.
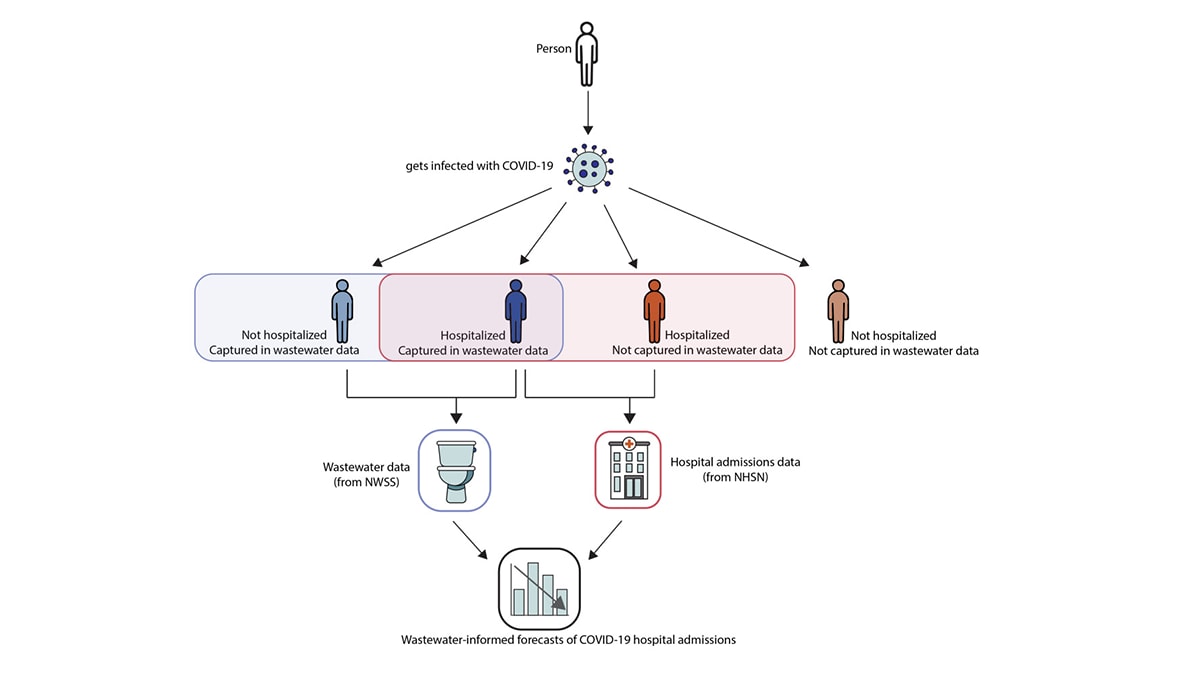
Combining SARS-CoV-2 wastewater data with data from hospital admissions to forecast COVID-19 hospital admissions is somewhat intuitive. Both hospital admissions and SARS-CoV-2 concentrations in wastewater reflect SARS-CoV-2 infections; however, they capture information on different but overlapping populations (Figure 4) and on different timescales. This approach could, in the future, also be used to integrate additional data sources like emergency department visits or test positivity rates. Modeling and forecasting of any disease can be improved by using models that draw upon a variety of data sources, sometimes called signal fusion.
How does CFA produce these forecasts?
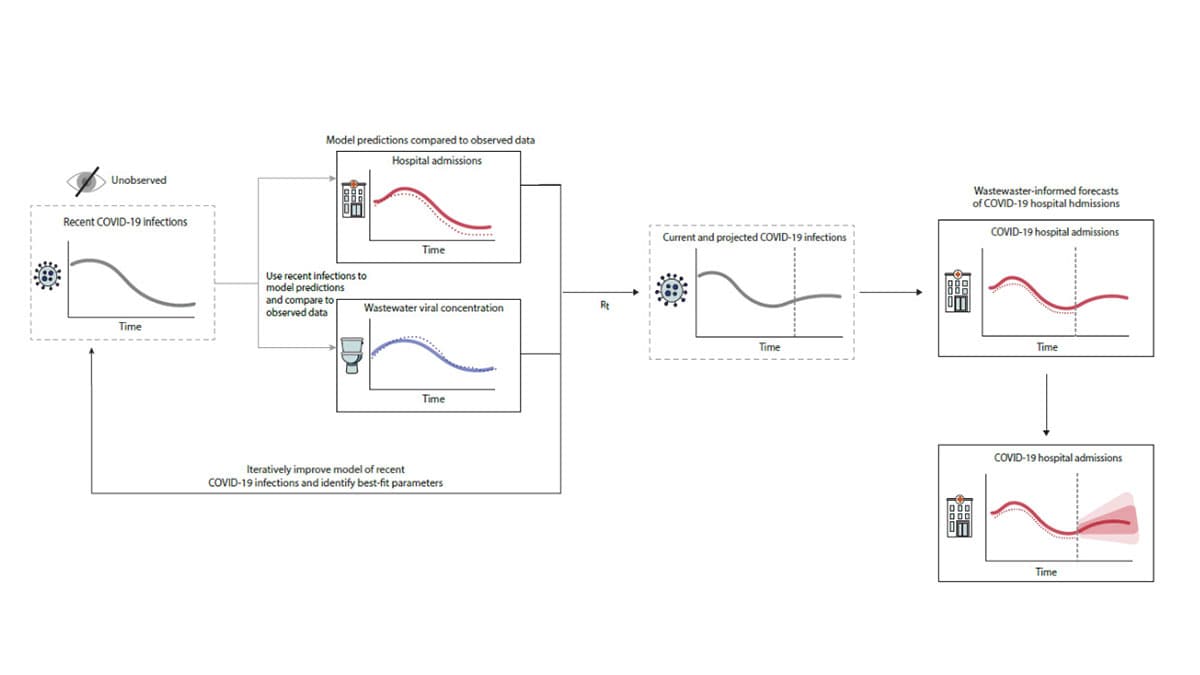
The model produces forecasts of COVID-19 hospital admissions in three steps. First, we estimate the number of recent SARS-CoV-2 infections using available data sources. Next, we use those estimates to anticipate the number of future SARS-CoV-2 infections. Finally, we use these projections to forecast the number of future COVID-19 hospital admissions (Figure 5).
To estimate the number of recent SARS-CoV-2 infections, we use data on SARS-CoV-2 wastewater concentrations and COVID-19 hospital admissions that have already been observed and reported. The data help us make guesses about hundreds of parameters, including how many people were infected on each day in the past, how many people are hospitalized per 1,000 infections, and how numbers of infections relate to the number of viruses in wastewater. Because there are so many parameters, and because we have limited data on most of them, our first guesses have limited accuracy.
The model then uses those initial guesses to generate predictions of what the hospital admissions and wastewater data would have looked like if our initial guesses were correct. It compares those predicted values against observed hospital admissions and wastewater data. If the predicted and observed data match up well, our parameter guesses were more likely to have been accurate; if they don't match up well, our guesses were less likely to have been accurate. The model goes back and forth between the first two steps thousands of times, making guesses about parameters, making predictions, and comparing those predictions against observed data. Using advanced computational techniques, this process is very fast and can find the parameter values that are most likely to give rise to the observed data.
Once the model has inferred trends in past infections, it projects those trends forward in time. Projected future infections lead to projected future hospital admissions in the same way they were inferred in the past data. If you are a public health official or scientist interested in learning more about the computational methods we use, see our documentation on GitHub: Wastewater-informed COVID-19 forecasting models submitted to the COVID-19 Forecast Hub.
How useful and accurate are these forecasts?
This is the first time CDC has published regular COVID-19 forecasts based on an in-house model, as well as the first time CDC has incorporated wastewater data, or data from multiple data sources, into hospital admissions forecasts. We are excited about the potential of these models, which build on prior work to leverage wastewater data for forecasting (including Goldstein et al., Lison, Watson et al, and others). We invite feedback from our scientific and public health collaborators, particularly on how we could improve the model and increase its usefulness for the public health community. In the future, similar models may incorporate additional data sources, such as emergency department reporting, and could expand to generate forecasts at a more local level or for other pathogens. Additionally, when we performed a preliminary analysis using data from the 2022-2023 respiratory virus season and compared these forecasts with the outputs from similar models that did not incorporate wastewater data, our wastewater-informed model was better able to capture changes in transmission trends, such as surges and peaks. This can provide important, timely information for public health decision-makers, particularly regarding hospital capacity and staffing.
Evaluations are underway to assess how this model performs. We are submitting our forecasts to the COVID-19 Forecast Hub, to contribute to the forecast ensemble and see how the model performs in real time compared with other models. Once we complete a full retrospective evaluation of our model, we plan to post a pre-print describing the results and submit the manuscript for peer-review. As we continue to evaluate and improve our forecasts, we welcome feedback from the scientific and public health communities on GitHub and the CFA Contact Us page.