At a glance
Background
Measles—an extremely infectious and potentially severe febrile rash illness—was declared eliminated in the United States in 2000, due to high levels of vaccination with the safe and effective measles-mumps-rubella (MMR) vaccine. However, worldwide, measles cases have increased in recent years. People from the U.S. who are not vaccinated may encounter measles when traveling abroad, then return home infected and spread measles to others. The risk of measles outbreaks in the U.S. population is low because of overall high rates of MMR vaccination. However, at local levels, vaccine coverage rates vary considerably, and pockets of unvaccinated people exist even in places with high vaccination coverage.
What happened in Chicago?
In March 2024, a resident of a large, temporary shelter for migrants in Chicago was diagnosed with measles. The Chicago Department of Public Health (CDPH), leading the response, initiated outbreak control and mitigation measures, including active case-finding, contact tracing, and a mass vaccination campaign at the shelter. In addition, CDPH and the Illinois Department of Public Health (IDPH) requested assistance from CDC to respond to this measles outbreak. Epidemiologists and modelers from NCIRD, CFA, and CDPH worked together to apply modeling and advanced analytics to understand the outbreak in real time. CDC developed three different models to answer five key questions from the CDPH team.
How big can we expect this outbreak to be?
During the measles outbreak among Afghan evacuees in fall of 2021, NCIRD staff created a stochastic compartmental model of measles transmission. In response to CDPH questions, we adjusted the stochastic model with information relevant to the shelter outbreak in Chicago.
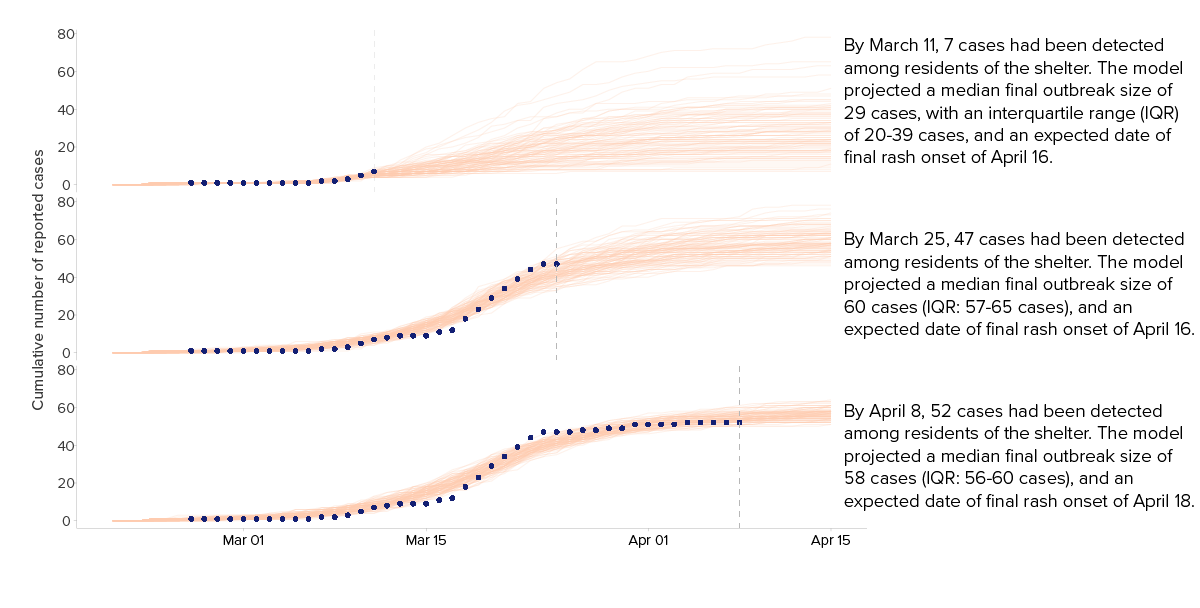
The model indicated the shelter had very high transmission rates. In the early days of the outbreak, we forecasted that the outbreak would continue to grow. Accounting for the age and vaccination status of the population, we estimated the outbreak was likely to reach between 50 and 65 cases within a month.The earliest projections provided an estimate of outbreak size, and accuracy improved as more data was reported, helping to allocate resources and plan for continued public health response.
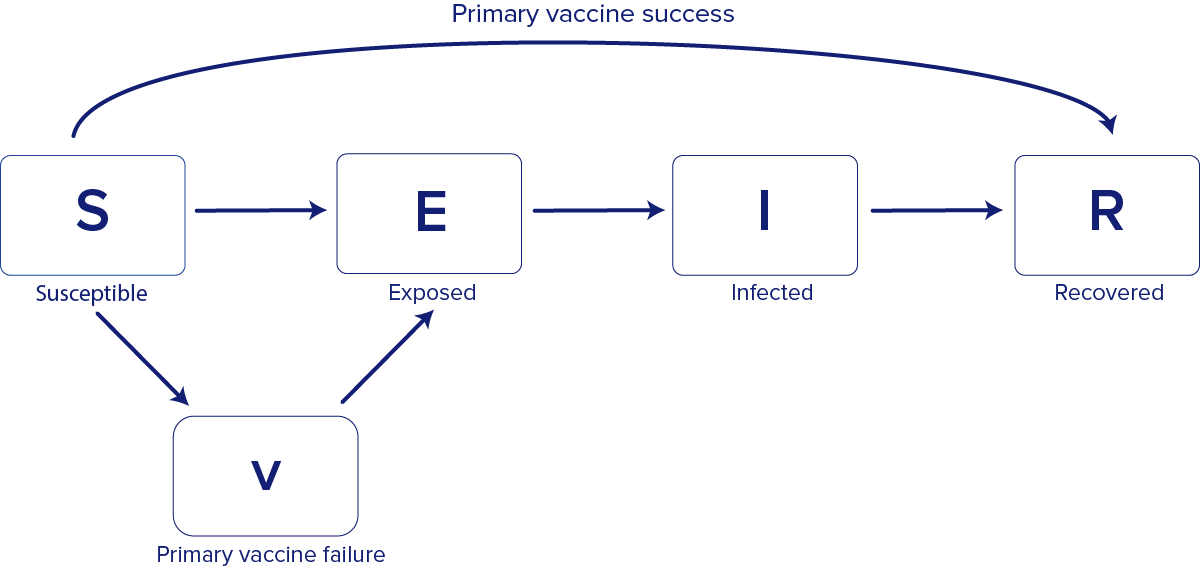
The model is "compartmental" because it groups people into compartments based on their disease state—susceptible (S), exposed (E), infected (I), and recovered (R)— these models are also sometimes called SEIR models (Figure 1). The model is "stochastic" because it accounts for variability in the way people interact with each other and how their infection statuses change over time. Because the model is stochastic, each simulation represents one potential outcome, and the model is run many times to produce a range of possible outcomes.
We updated the model to modify the rules of how movement between compartment occurred and how long the infectious period was as new information became available from CDPH about vaccinations and active case-finding.
For the model in this setting, we assumed a mean pre-infectious period of 8 days, a mean infectious period of 5 days, and a reporting delay of 2.5 days, to reflect the average time between symptom and rash onset. Using approximate Bayesian computation, we fit a basic reproductive number (R0) of 25.
Model simulation was set to 365 days, with 10,000 simulations per scenario. We selected the 100 simulations that most closely matched the observed data to create forecasts of outbreak size, which were updated as new case data became available.
Have we missed any cases?
Using the same compartmental model, we tested different assumptions about the timing of the index case. We initially assumed the first detected case was the index case. As more cases were reported, case numbers grew along the trajectory the model had projected, which supported this assumption.
We also ran the same model with earlier dates for the index case to assess the likelihood that measles had been spreading in the shelter before this case was detected. These alternative results were a poorer fit to the data. Because the model did not strongly point toward an earlier index case, we were more confident that the first detected case in early March was the index case.
How effective was our public health response?
CDPH's early vaccination campaign had a large impact on limiting the size and duration of the outbreak. Using the same compartmental model, we simulated counterfactual, or alternative, scenarios with different interventions. These simulations showed that prompt mass vaccination and active case-finding reduced the chance of a large outbreak (>100 cases)—from 69% with no vaccination to 1% with immediate vaccination. Our results indicated that even delaying vaccination by one week would have increased the risk of a large outbreak by eightfold (from 1% to 8%), compared to CDPH's immediate vaccination. Without vaccination, the modeling results showed the median outbreak size would have been more than 200 cases. With vaccination, the outbreak was limited to 57 people.
Active case-finding was also an effective mitigation tool. Our compartmental model suggested these efforts reduced the time an individual with measles was infectious, as those identified with potential measles symptoms were removed from the shelter, thus reducing the risk of a large outbreak.
How confident are you in these results?
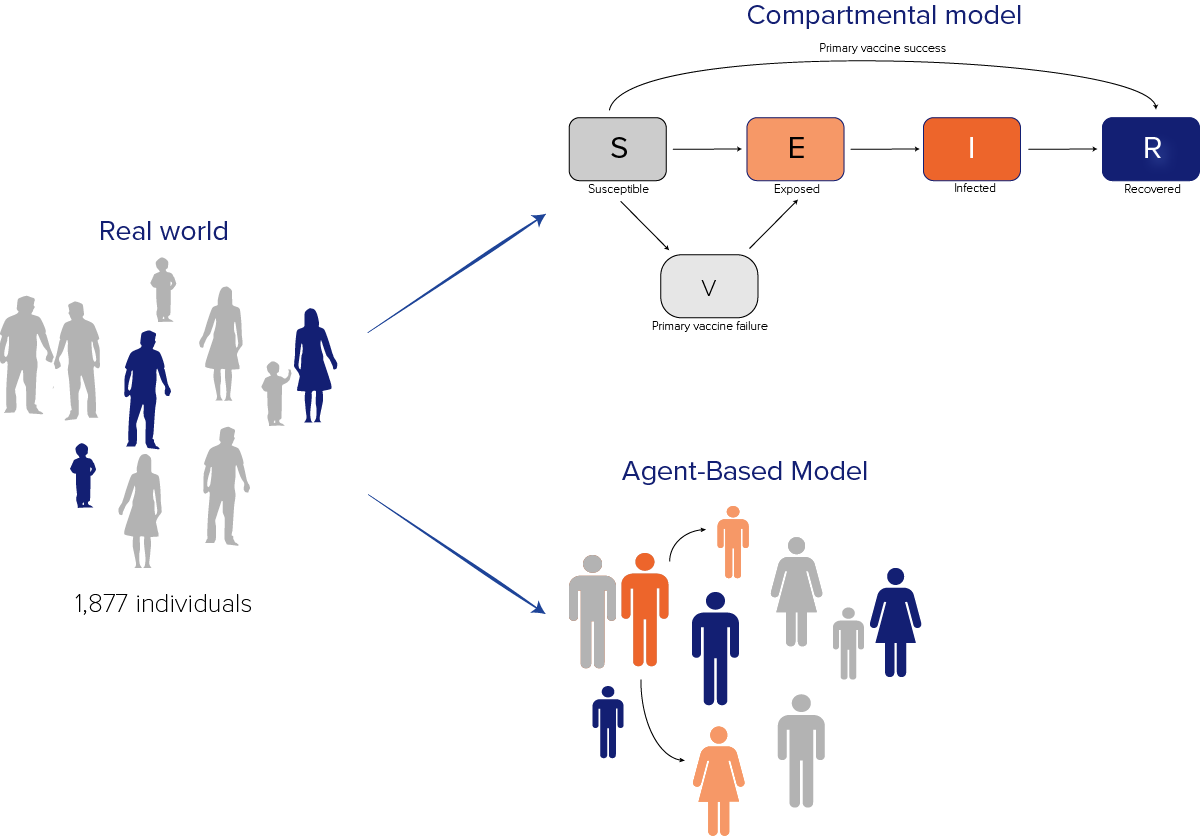
To assess whether the compartmental model was implemented correctly and build our future capability to ask additional questions, we developed an agent-based model (ABM) of measles transmission in the Chicago outbreak. We found this model projected similar case counts as the compartmental model and increased our confidence in results.
Unlike compartmental models, which group people into compartments, agent-based models (ABMs) explicitly simulate individuals or "agents" (Figure 3). ABMs can model individual-level characteristics, such as the movement of individuals and family units, or the specific duration of time for which a particular individual might be infectious. ABMs are often more complex than compartmental models, take longer to develop, use more computational resources, and require more data. These models can offer some advantages over simpler approaches, including more closely reflecting some real-world situations.
ABMs consist of three key components: simulated individuals that make up the population; assumptions defining how the disease spreads between people, similar to the compartmental model; and details about the interventions modeled.
The model included 1,877 agents, representing 1,877 individuals in the shelter on March 8, and each agent in the ABM matched the age group, vaccination status, and disease state of a real individual. We were able to model how the status of the model agents changed over time and use this to estimate what might happen in the real world.
As with the compartmental model, we started with one infected person and updated the model as new data became available. Unlike the compartmental model, we were able to model how that individual interacted with others in the shelter, and simulate infectious periods, vaccine efficacy, and the effect of mass vaccination campaigns at the individual level.
The ABM projected case counts that were similar to the compartmental model, providing confidence in the original prediction. Overall, the ABM estimated a peak incidence of 24.5 (90% CI 17.45-28) cases compared to 22.5 (90% CI 18-29.65) cases estimated from the compartmental model.
If we detect a measles case in a hotel-style migrant shelter, how large could the outbreak grow?
We developed a branching process model to assess the potential impact of a measles introduction in the hotel-style shelter, where families were housed primarily in separate rooms. Our results indicated that in an optimistic vaccination scenario (92% vaccinated), a large outbreak was unlikely to occur, but in a more conservative vaccination scenario (76% vaccination coverage), an outbreak of >50 cases was more likely.
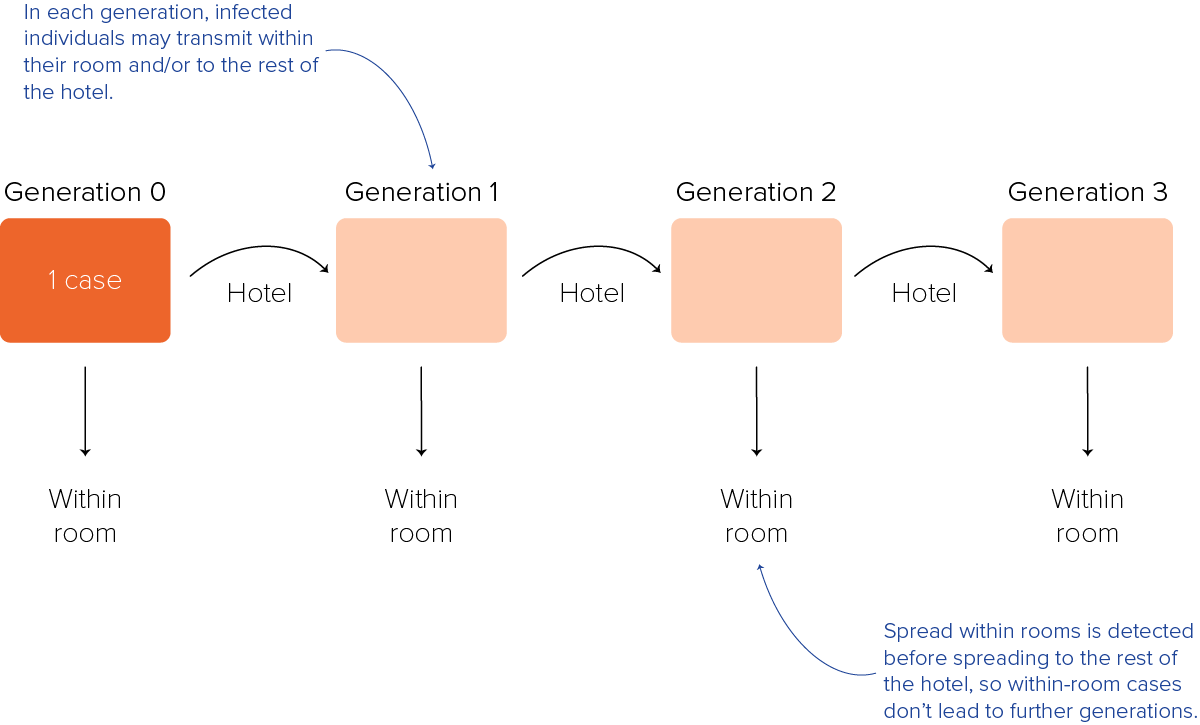
Branching process models can account for initial uncertainty in disease spread and are a relatively simple modeling approach that require fewer computational resources. Standard branching process models just have one input – the distribution of secondary cases caused by each infectious person. In this model, this was parameterized by R0 and k, the dispersion parameter, which is a measure of variability in infectiousness. In this model, we used two separate distributions: one with a lower R0 for transmission within the hotel, and one with a higher R0 for transmission for families staying in individual rooms. We estimated both using measles-specific parameters from the literature as well as vaccination coverage and assumed contact rates.
We assumed any index case could infect family members within their room and/or the wider hotel population, but that within-room spread would be detected early because of close monitoring of known contacts, thus preventing spread to other areas of the hotel (Figure 4).
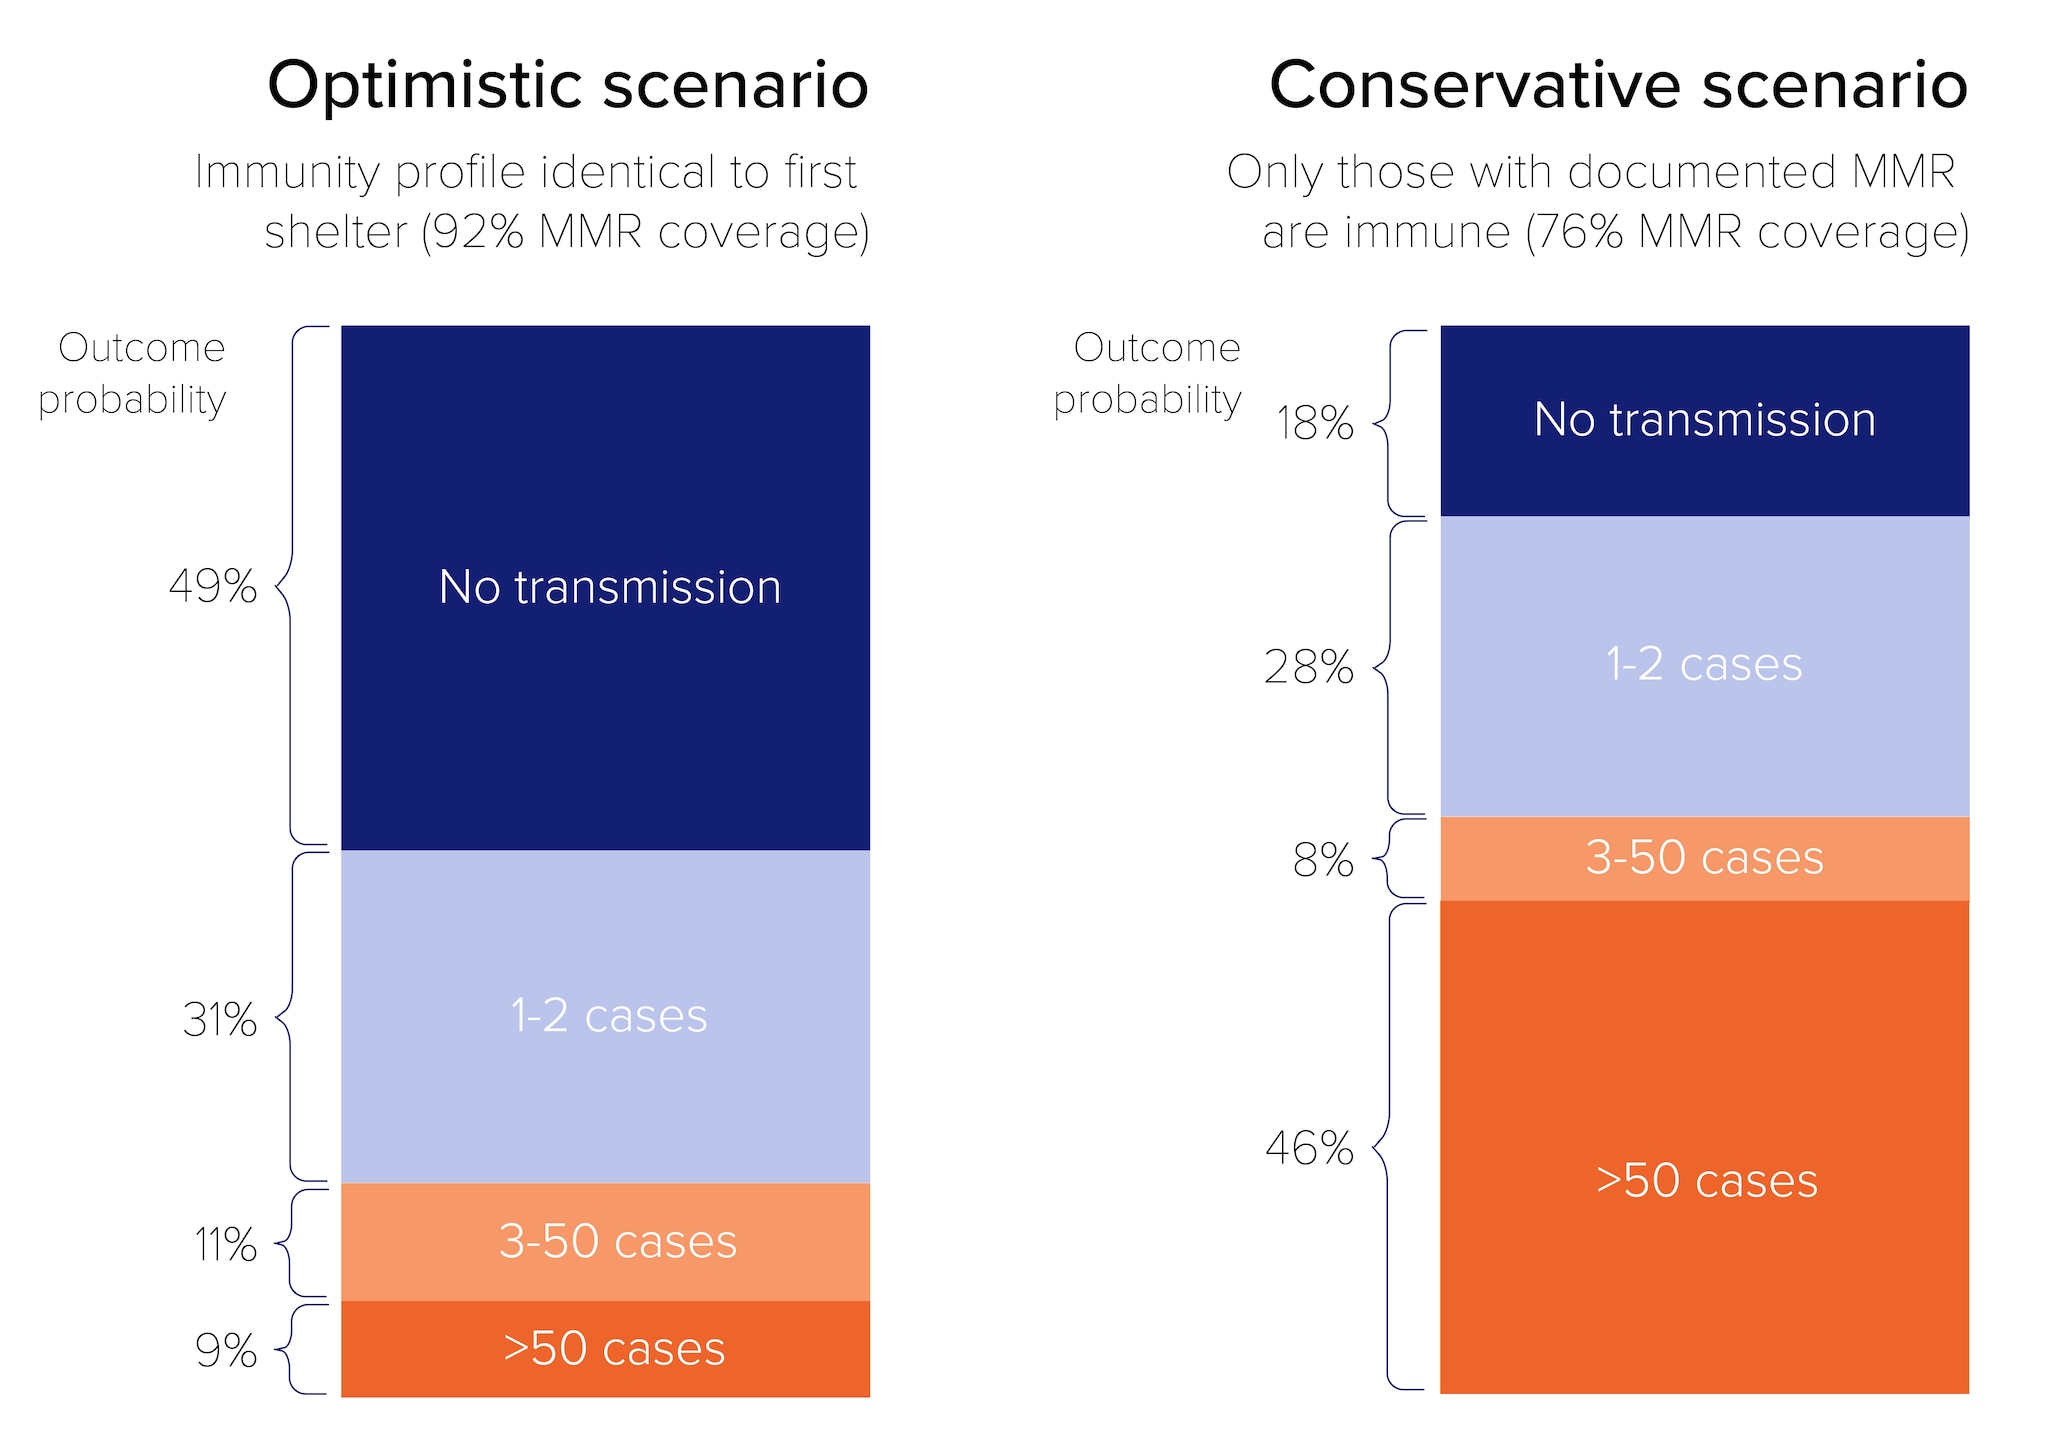
We modeled two vaccination coverage scenarios: an optimistic scenario that assumed the hotel had the same immunity profile as the original shelter (92% vaccine coverage with at least one dose MMR), and a second, more conservative scenario assuming only those with documented MMR records were immune (76% vaccine coverage). We ran the model until there were no cases and the outbreak ended, or until the number of total cases reached the estimated number of unvaccinated individuals in the hotel.
In the optimistic vaccination scenario, if one index case entered the hotel, assuming an R0 of 15 and moderate variability in individual contagiousness, a large outbreak was unlikely to occur. In the more conservative vaccination scenario, an outbreak of more than 50 cases was the most likely outcome (Figure 5).
Conclusions
During this outbreak in Chicago, CDPH, NCIRD, and CFA collaborated to develop and refine models of measles transmission in real-time. CDC applied different modeling approaches to answer different public health questions from CDPH decision-makers. The models helped forecast the expected size and duration of the outbreak and helped CDPH plan the public health response—including the allocation of appropriate resources, and evaluation of the impact of the public health response. "The models and forecasts developed by CDC were instrumental for our local measles response," CDPH decision-makers said. "Among other things, they helped us to manage expectations about the likely scale of the outbreak and to appropriately allocate resources across CDPH, other city agencies, and the Chicago community. Our collaboration with CDC, including the team that deployed to Chicago and the modelers that worked with us remotely, demonstrated how public health is a team sport."
This outbreak response demonstrates the value of collaboration between public health officials at the STLT levels and disease-specific and modeling experts at CDC. We have made the code used to produce some of the analyses in this report available, including the compartmental model. If you have feedback on the modeling approaches discussed above, please contact CFA.
Acknowledgements
- NCIRD works to prevent disease, disability, and death through immunization and by surveillance and control of respiratory and related diseases.
- CFA aims to use data, modeling, and analytics to respond to outbreaks in real time to inform effective decision-making.
- CDPH works with communities and partners to create an equitable, safe, resilient and Healthy Chicago.