At a glance
CDC has updated its respiratory isolation guidance, and we estimated the potential impact of this change for an individual’s COVID-19 transmission potential. Our analysis found little difference on average for the likelihood that someone with COVID-19 would spread it to others under the updated isolation guidance compared with the previous guidance.
Differences between the updated and previous guidance
The updated guidance applies to all respiratory viruses—not just COVID-19, as the previous guidance did. There is now no minimum duration of isolation since this period depends on fever and symptom improvement. The updated guidance recommends that everyone with a respiratory virus take post-isolation precautions for 5 days.
The previous guidance recommended a minimum duration of isolation from symptom onset—5 days for most people—even if symptoms improved rapidly. The recommended duration of post-isolation precautions then varied depending on how long the person was in isolation; isolation and post-isolation measures also depended on test results.
Overview of methods
We modeled infectiousness over time using detailed data—COVID-19 test results and symptoms—to estimate how an individual's COVID-19 transmission potential could change under the previous versus updated guidance.
We used data from people with mild to moderate COVID-19 who participated in two CDC studies. In these studies, people were tested daily or near daily and asked about symptoms. The test results were used to estimate how much virus was present, or "viral load." Informed by these data, we simulated individuals with COVID-19 to understand how their estimated viral load changed over time relative to when symptoms began and subsequently improved. We assumed that higher estimated viral loads resulted in greater potential to transmit the virus, all else being equal. We then estimated how transmission potential changed over the course of infection.
We further assumed that when people isolated, their potential to transmit the virus decreased by 90% and that while taking post-isolation precautions, their potential to transmit the virus decreased by 50%. For each individual, we modeled how much transmission potential was prevented if they followed the updated guidance versus the previous guidance.
We focused our analysis on transmission potential for infected individuals. Our results cannot be extrapolated to predict changes in the total amount of transmission at the population level. One reason for this is that transmission depends on whether contacts are susceptible to infection. We did not model how many people are susceptible over time. For more details on our data and methods, see below.
Results: How does transmission potential change under the updated guidance?
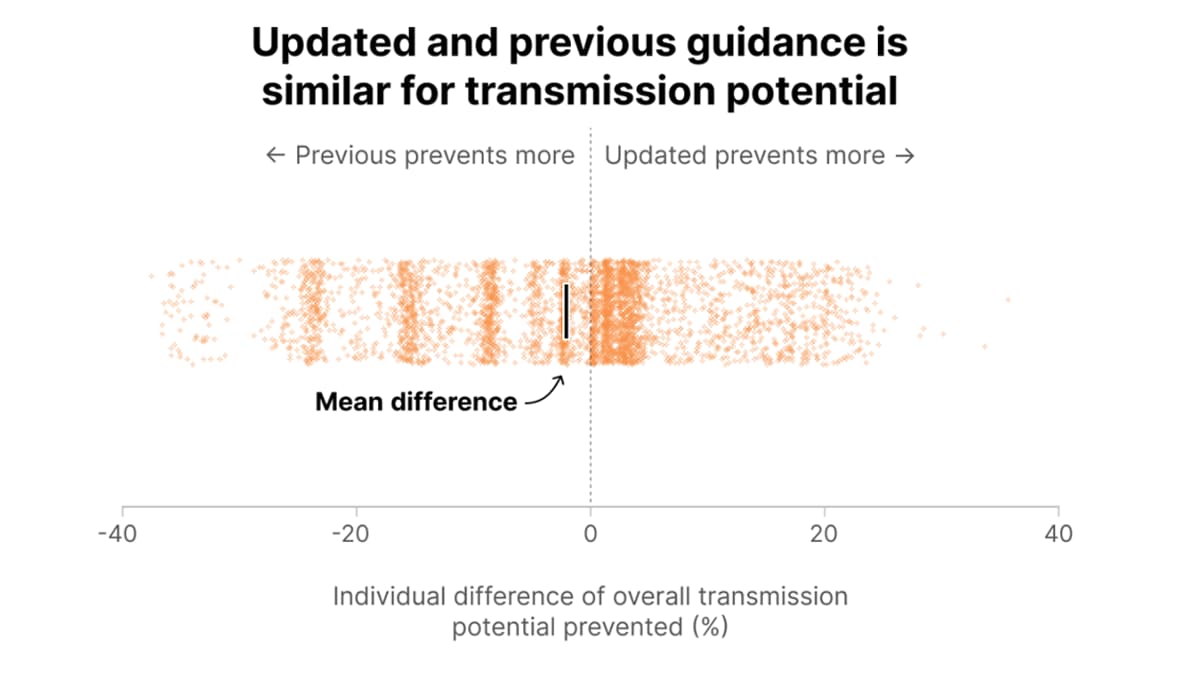
We found little difference in the average potential for transmission by following the updated guidance compared with the previous guidance (Figure 1). We estimated that the previous guidance would prevent 2.3 more percentage points of overall transmission potential than the updated guidance. However, the impact of the updated guidance varies from person to person depending on their symptom severity and individual time to symptom improvement.
The main reasons for our conclusions are the following:
- Time in isolation is unchanged for many people under the updated guidance because time from symptom onset to symptom improvement is often 5 days or longer.
- People following the updated guidance would often spend more time engaging in post-isolation precautions compared with the previous guidance.
- In the updated guidance, post-isolation precautions are recommended for a minimum of 5 days, regardless of how quickly symptoms improve; in the previous guidance, post-isolation precautions may be fewer than 5 days, depending on the duration of isolation.
- Under the updated guidance, everyone who develops symptoms is advised to follow post-isolation precautions; under the previous guidance, this recommendation was driven by test results. Some people with COVID-19 have false-negative test results and therefore would not be expected to engage in post-isolation precautions.
- In the updated guidance, post-isolation precautions are recommended for a minimum of 5 days, regardless of how quickly symptoms improve; in the previous guidance, post-isolation precautions may be fewer than 5 days, depending on the duration of isolation.
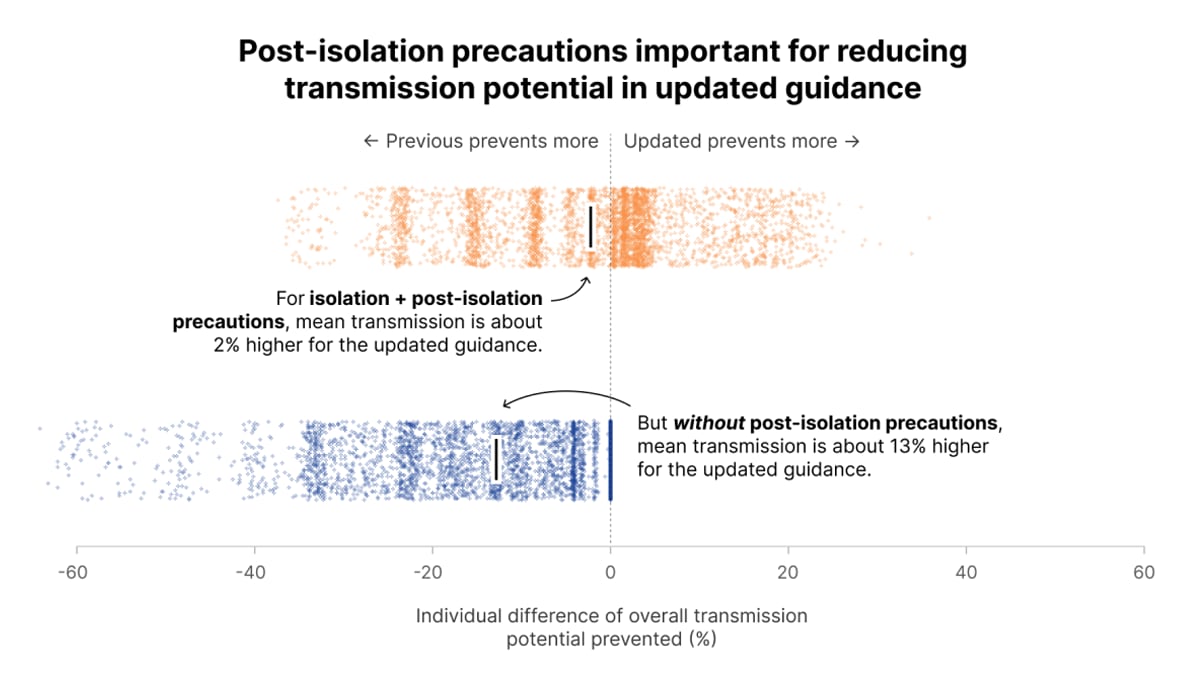
Results: How do post-isolation precautions affect COVID-19 transmission potential?
Post-isolation precautions—measures to prevent infection spread after isolation has ended—are a key feature of the updated guidance. If post-isolation precautions are not effective or people do not follow them, the previous guidance could prevent approximately 13 more percentage points of transmission potential than the updated guidance (Figure 2).
Our data and methods
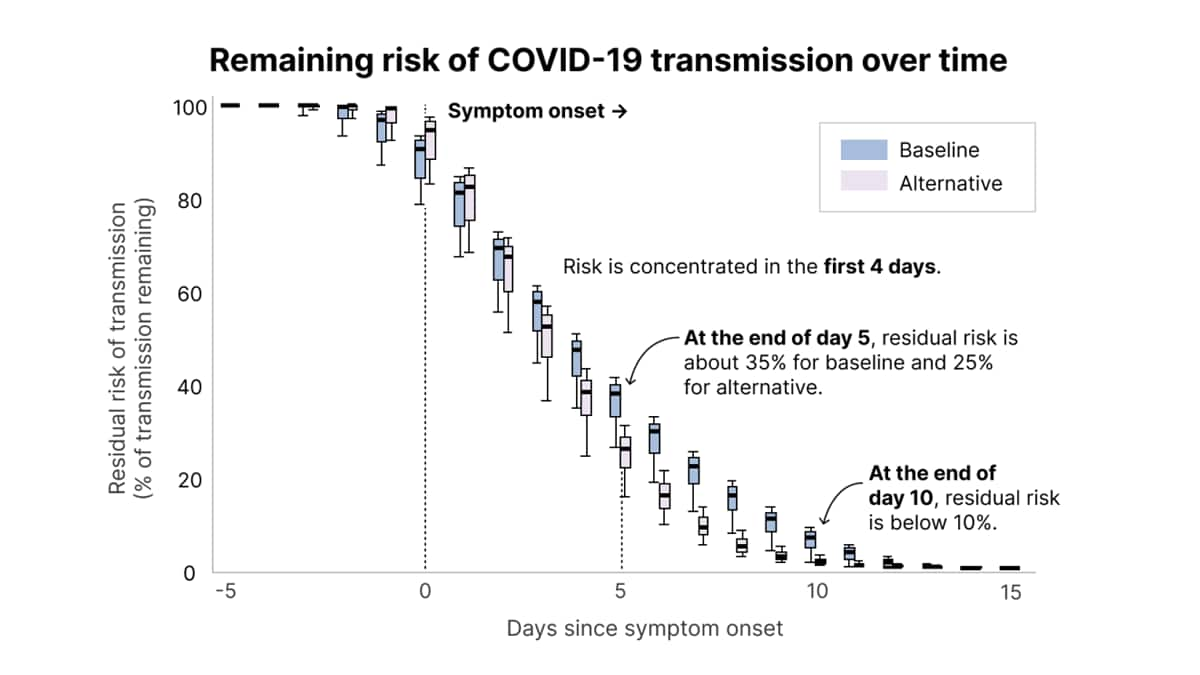
We used viral load measurements from persons with COVID-19 who participated in one of two CDC studies (discussed below) to infer individual transmission potential by day since symptom onset, based on two different assumptions for how testing data translates to transmission potential (Figure 3). The baseline assumption—where transmission potential is proportional to the log of viral load—assumed that people were able to transmit the virus for longer. The alternative assumption—where transmission potential is proportional to the probability of testing positive using an antigen test—assumed that transmission potential had a shorter duration and declines faster after symptoms have started. In other words, in the baseline assumption, transmission potential was spread out over the entirety of an individual's infection whereas in the alternative assumption, transmission potential was more concentrated shortly after symptom onset. Because transmission potential decreased more slowly following symptom onset under the baseline assumption, there was more remaining transmission potential (Figure 3).
Our model showed that most of the risk for potential transmission occurred in the first four days after symptom onset under both assumptions. Under the baseline assumption, approximately 35% of transmission potential remained at the end of day five following symptom onset whereas this value was 25% under the alternative assumption. This means that if a person with COVID-19 came into contact with susceptible people at a constant rate over the course of their infection (i.e., they did not isolate or take precautions), then on average 35% of the onward transmission events from that person would occur after day five. This does not mean that 35% of contacts would be infected; we did not model the number or proportion of contacts who are infected. Rather, our analysis is about how transmission potential is distributed over the course of an infection. We also estimated that the remaining risk of transmission potential is below 10% starting at ten days after symptom onset under both assumptions.
To conduct this analysis, CDC used daily or near-daily COVID-19 testing and symptom data from approximately 600 infected symptomatic individuals, a subset of individuals from the two CDC studies described below. We note that asymptomatic individuals were not included in this analysis because we had no way to define symptom improvement for these cases.
- RVTN1—the Respiratory Virus Transmission Network, a CDC-funded, case-ascertained household transmission study that recruited and enrolled confirmed COVID-19 cases and their household contacts through seven academic and clinical institutions in the United States from 2021 to 2023. We used data from 602 household contacts who developed COVID-19.
- INHERENT2—the Nursing Home Public Health Response Network, where CDC funded eight academic institutions in the United States partnering with 24 nursing homes to study COVID-19 cases in nursing homes. Data collection began in 2023 and is ongoing. We used data from 21 nursing home staff members who tested positive for SARS-CoV-2.
The COVID-19 cases included in this analysis were found by actively testing study participants, as opposed to only including those who sought out medical care. Consequently, mild infections are well-represented in the analysis, making our findings more directly applicable to general community settings.
We inferred symptom improvement times from daily symptom histories. These data sources did not directly collect data on when symptom improvement occurred. Instead, the data reported the occurrence of symptoms on specific days. We used these data to create the following four categories of disease severity and associated definitions of symptom improvement:
- Moderate: Persons who ever reported shortness of breath (18.8% of persons in analysis). We assumed that symptom improvement for these persons occurred when shortness of breath was no longer reported and once fever-free for at least one day.
- Mild with fever or body aches: Persons who ever reported fever or body aches but never shortness of breath (54.7% of persons in analysis). These persons may or may not have also reported respiratory symptoms. We assumed that symptom improvement occurred for these people when body aches were no longer reported and once fever-free for at least one day.
- Mild respiratory symptoms without fever or body aches: Persons who ever reported a respiratory symptom such as cough or runny nose, but never reported a fever, body aches, or shortness of breath (25.2% of persons in analysis). We assumed that symptom improvement for these people occurred once they were past their peak number of reported symptoms.
- Mild with non-specific symptoms: Persons who reported non-specific symptoms such as fatigue or headache and did not fall into any of the previous categories (1.3% of persons in analysis). We assumed that symptom improvement for these people occurred once they were past their peak number of reported symptoms.
Informed by the observed data, we simulated individuals with COVID-19. Each simulated individual had a viral load that varied over time relative to symptom onset, a time-varying probability of testing positive on an antigen test, and a time indicating how long after symptom onset it took for their symptoms to improve and to be 24 hours fever-free. For each simulated individual, we estimated how much onward transmission would be prevented by the updated guidance compared to the previous guidance. The two guidance scenarios were modeled as follows:
(1) Updated respiratory isolation guidance (modeled here for COVID-19): Individuals isolated once symptoms started and remained in isolation until fever-free for at least 24 hours and symptoms had improved. Isolation was followed by five days of post-isolation precautions to reduce onward transmission, including actions such as masking and distancing.
(2) Previous COVID-19 isolation guidance: We assumed individuals began isolating and took an antigen test upon symptom onset, and a second test 2 days later if the first was negative and if symptom improvement had not already occurred. Probability of testing positive on an antigen test depended on viral load and the antigen test's limit of detection. Individuals who tested positive isolated for a fixed period (5 days for those with mild symptoms, 10 days for those with moderate symptoms) OR until symptoms had improved and they were fever-free for 24 hours, whichever was longer. People who left isolation before day ten following symptom onset took post-isolation precautions through day 10. People who isolated through day 10 did not take any post-isolation precautions. We assumed that people who did not test positive isolated until symptom improvement and they were fever-free for 24 hours, but that they did not take any post-isolation precautions.
For both the updated and previous guidance, we assumed that when people are isolating, they are 90% less likely to transmit the virus, and that when people take post-isolation precautions, they are 50% less likely to transmit3.
Our conclusions rest on some key assumptions and could change if these assumptions are incorrect.
We assumed that viral load is a proxy for infectiousness. We tested different assumptions that related viral load to infectiousness, so that we could ensure our results did not depend on one particular relationship. We erred toward estimating that infectiousness lasted longer after-symptom improvement to best quantify the impact of potentially reduced isolation times on onward transmission potential. Should we include additional data on infectiousness—such as viral culture measurements that determine whether an individual is actively transmitting live virus—indicating the duration of infectiousness is reduced, then both the updated and previous guidance would be more protective than we estimated.
Our results are sensitive to testing practices. If, under the previous guidance, people only test one time when their symptoms start, rather than taking two tests two days apart as we assumed, then the updated guidance might prevent approximately 9 more percentage points of overall transmission potential than the previous guidance. This is because many people with COVID-19 get a false negative result if they only take one antigen test immediately after symptoms start, and thus do not take post-isolation precautions.
We used data on which symptoms study participants had each day to infer when symptom improvement occurred, but study participants were not asked directly whether they felt symptoms were improving. If people with COVID-19 feel better sooner than we estimated, then there would be a larger difference between the updated and previous guidance; this generally would make the updated guidance less protective than we estimated.
Two distinctions between the updated and previous guidance are not captured in our analysis. The updated guidance calls for isolation to continue until symptoms have been improving for 24 hours; the previous guidance referred to whether "symptoms are improving" without specifying any minimum duration of improvement. If captured in the analysis, these differences could make the updated guidance more protective than we estimated.
Additionally, the previous guidance gave more specific recommendations than the updated guidance about what actions to take in the post-isolation period. This may make the updated guidance less protective than we estimated.
Finally, our analysis focused on modeling the consequences of the updated guidance versus the previous guidance, assuming people are equally likely to follow the updated versus previous guidance and that isolation and post-isolation precautions are equally effective under both sets of guidance. We did not model changes in the extent to which people follow COVID-19 isolation and post-isolation guidance. We also did not compare the updated and previous guidance for respiratory diseases other than COVID-19.
Few study participants included in this analysis developed symptoms severe enough to seek medical care. The transmission potential of hospitalized COVID-19 patients is outside the scope of this analysis. The updated guidance applies only to community settings, not to other settings such as healthcare settings.