What to know
Overview
The U.S. Cancer Statistics surveillance system is the nation's comprehensive source for detailed cancer data. It includes information on cancer-related deaths and new cases of cancer.
Data sources
Information about new cancer cases (incidence) comes from CDC's National Program of Cancer Registries (NPCR) and the National Cancer Institute's Surveillance, Epidemiology, and End Results (SEER) Program. CDC evaluates these data for quality, completeness, and timeliness for inclusion in U.S. Cancer Statistics data products, including the Data Visualizations tool and public use database. Information about cancer deaths (mortality) comes from CDC's National Center for Health Statistics National Vital Statistics System.
Age adjustment
U.S. Cancer Statistics uses the 2000 U.S. standard population to calculate age-adjusted cancer rates (the number of new cases relative to the population) for consistency and comparability across geographic areas and between datasets.
County of residence
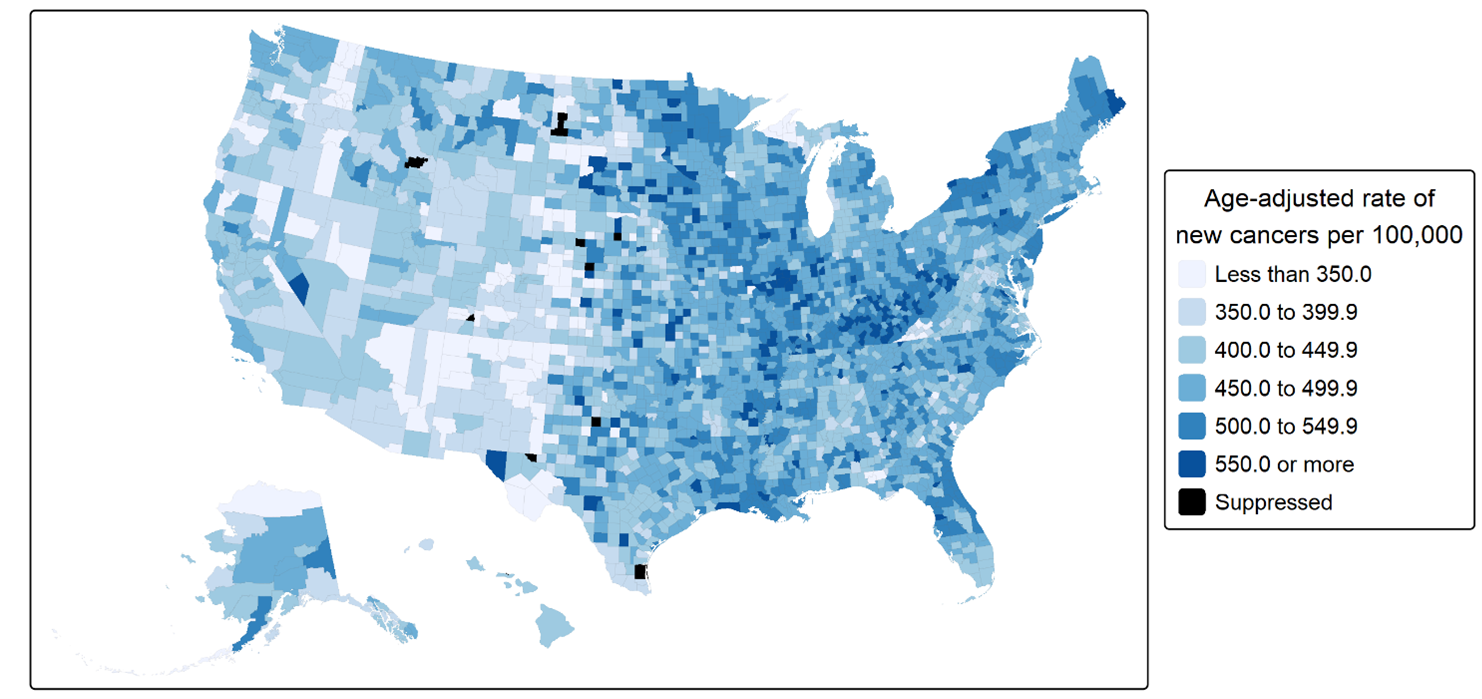
U.S. Cancer Statistics achieved 100% coverage of the county of residence data for new cancers reported in all 50 states and the District of Columbia during 2003 to 2023. County of residence and county urbanicity data allow researchers to examine how geographic location may affect cancer incidence and mortality. Comprehensive county-level data on cancer incidence can improve our understanding of geographic, environmental, and contextual factors that influence cancer prevention, treatment, survival, and survivorship care. National county incidence rates for all new cancers combined are presented in Figure 1.
Figure 1. 5-year age-adjusted incidence rate of all new cancers combined, by county of residence at diagnosis, 2019–2023
Note: Counties reporting fewer than 16 new cancer cases during this period have been suppressed for reliability and confidentiality in accordance with suppression criteria.
Urbanicity
The U.S. Cancer Statistics public use database and Data Visualizations tool use a two-tier aggregated rural-urban continuum code based on the 2023 Rural-Urban Continuum Codes from the U.S. Department of Agriculture.A This variable allows rates of new cancers to be compared across metropolitan and non-metropolitan (rural) counties.
Using data from the most recent 5-year period (2019–2023), we examined differences in cancer incidence by county and county-level urbanicity. During this period:
- The age-adjusted incidence rate of all new cancers combined was 453.4 cases per 100,000 overall (95% confidence interval [CI]: 453.1–453.7).
- The rate was 450.9 cases per 100,000 in metropolitan counties (95% CI: 450.6–451.2) and 466.6 cases per 100,000 in non-metropolitan counties (95% CI: 465.9–467.4).
The incidence rates by age, sex and race and ethnicity are shown in Table 1. Incidence rates were generally higher in non-metropolitan counties than in metropolitan counties.
Table 1. 5-year age-adjusted incidence rate of all new cancers combined and 95% confidence intervals, by demographic characteristics and county-level urbanicity, 2019–2023
| All counties | County-level urbanicitya | ||
|---|---|---|---|
| Characteristic | Total | Metropolitan counties | Non-metropolitan counties |
| Overall | 453.4 (453.1–453.7) | 450.9 (450.6–451.2) | 466.6 (465.9–467.4) |
| Sex | |||
| Male | 490.4 (490.0–490.9) | 487.2 (486.7–487.7) | 506.6 (505.5–507.8) |
| Female | 428.9 (428.5–429.3) | 427.3 (426.9–427.8) | 437.5 (436.5–438.6) |
| Age at diagnosis (years) | |||
| Younger than 15 | 16.4 (16.3–16.6) | 16.5 (16.4–16.7) | 15.9 (15.5–16.3) |
| 15 to 39 | 76.7 (76.5–77.0) | 76.5 (76.3–76.8) | 78.1 (77.4–78.7) |
| 40 to 64 | 548.6 (548.0–549.3) | 543.0 (542.4–543.7) | 580.5 (578.9–582.2) |
| 65 to 74 | 1795.1 (1793.0–1797.1) | 1782.3 (1780.0–1784.5) | 1854.4 (1849.3–1859.5) |
| 75 and older | 2276.5 (2273.7–2279.3) | 2277.6 (2274.6–2280.7) | 2263.6 (2256.8–2270.3) |
| Race and ethnicity | |||
| American Indian and Alaska Native, non-Hispanic | 424.3 (420.9–427.8) | 420.5 (416.1–424.9) | 429.9 (424.3–435.6) |
| Asian and Pacific Islander, non-Hispanic | 303.8 (302.8–304.8) | 304.4 (303.4–305.5) | 284.0 (278.4–289.7) |
| Black, non-Hispanic | 458.1 (457.2–459.0) | 457.8 (456.9–458.8) | 458.7 (455.8–461.6) |
| Hispanic | 362.0 (361.2–362.8) | 363.6 (362.8–364.4) | 337.4 (334.3–340.4) |
| White, non-Hispanic | 471.8 (471.4–472.1) | 471.2 (470.8–471.6) | 473.6 (472.8–474.5) |
Footnote
a County-level urbanicity was based on 2023 Rural-Urban Continuum Codes from the U.S. Department of Agriculture and categorized into two groups: metropolitan counties (codes 1–3) and non-metropolitan counties (codes 4–9).
Data source
Data in this brief come from U.S. Cancer Statistics, the official federal cancer statistics. U.S. Cancer Statistics incidence data are from population-based registries that participate in CDC's National Program of Cancer Registries (NPCR), the National Cancer Institute's Surveillance, Epidemiology, and End Results (SEER) Program, or both programs. Data submitted in 2025 that met publication criteria during 2003 to 2023 period covered 100% of the U.S. population in all 50 states and the District of Columbia.
- County-level urbanicity was based on 2023 Rural-Urban Continuum Codes from the U.S. Department of Agriculture and categorized into two groups: metropolitan counties (codes 1–3) and non-metropolitan counties (codes 4–9).