STDs increased during the first year of the COVID-19 pandemic
April 12, 2022 – STDs in the U.S. continued to increase in 2020
Reported cases of sexually transmitted diseases (STDs) in the United States decreased during the early months of the COVID-19 pandemic, but most resurged by the end of that year. Reported cases of gonorrhea, syphilis, and congenital syphilis surpassed 2019 levels, while chlamydia declined (likely due to decreased STD screening and underdiagnosis during the pandemic). The data provide the clearest picture yet of COVID-19’s impact on the U.S. STD epidemic.
-
- Press Release: New data suggest STDs in the U.S. continued to increase during the first year of the COVID-19 pandemic
- Comunicado de Prensa: Nuevos datos parecen indicar que las ETS siguieron aumentando durante el primer año de la pandemia de COVID-19
- Full Report: Sexually Transmitted Disease Surveillance Report, 2020
Graphics | Gráficos
These high-resolution, public domain images are ready to download and print in your publication. Click on a graphic to see it in high-resolution. These images are in the public domain and are thus free of any copyright restrictions. As a matter of courtesy, we ask that the content provider be credited and notified of any public or private usage of an image.
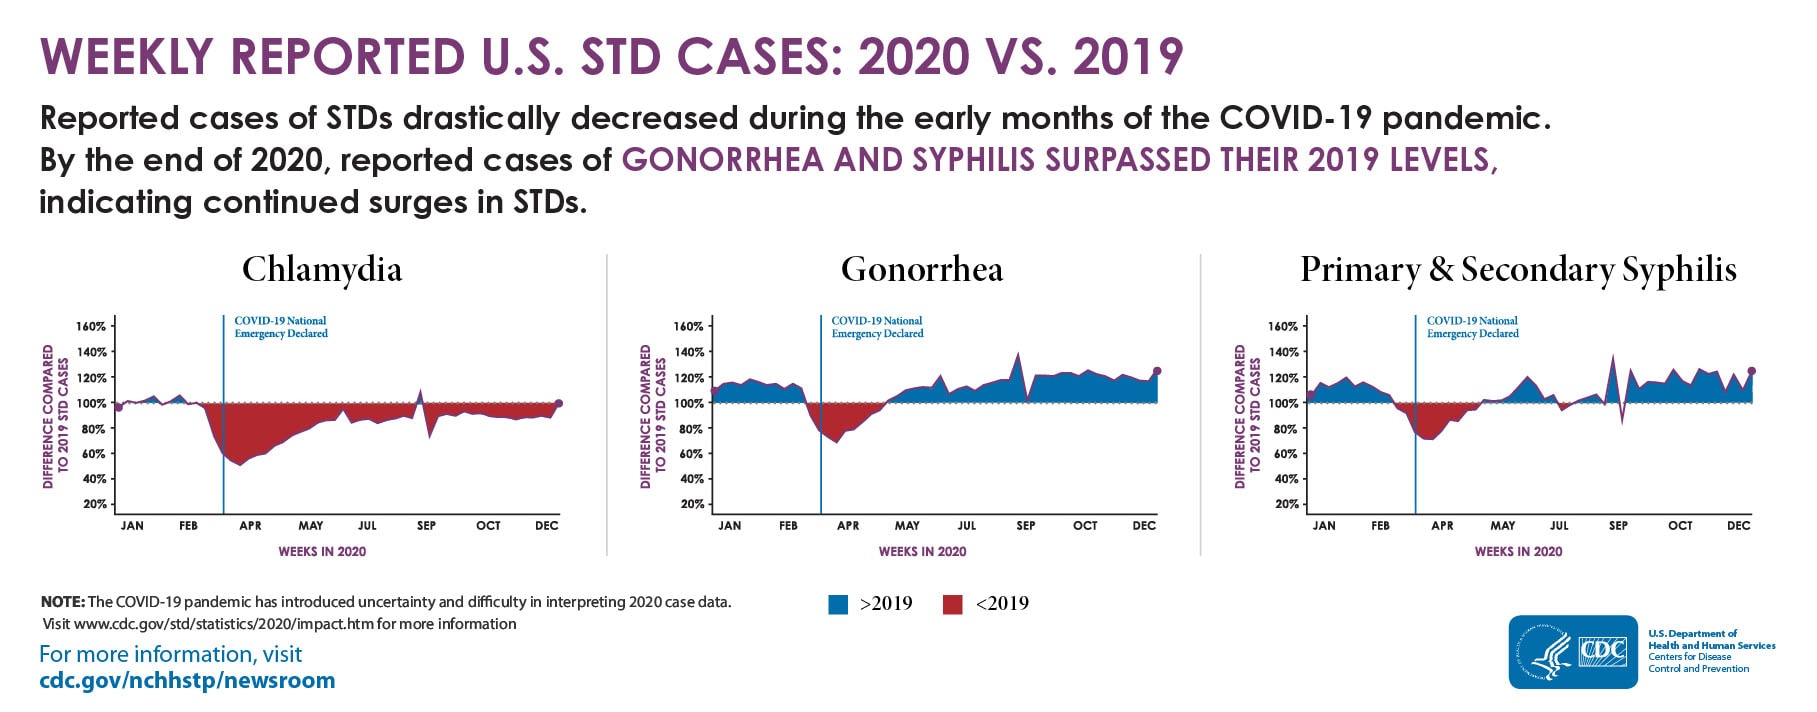
This graphic compares the number of weekly reported U.S. STD cases between 2020 and 2019. It contains three graphs, the first for chlamydia, the second for gonorrhea, and the third for primary and secondary syphilis.
For chlamydia, the graphic shows that reported cases were greater from January through February 2020 than during the same time in 2019. From the end of February 2020 through the end of December 2020, reported cases were lower than in 2019. Overall reported cases were lower in 2020 than in 2019.
For gonorrhea, the graphic shows that reported cases were greater in January until the end of February 2020 than during the same time in 2019. From the end of February through May 2020 cases declined and then resurged through the end of December 2020. Overall reported cases were higher in 2020 than in 2019.
For primary and secondary syphilis, the graphic shows that reported cases were greater in January until the end of February 2020 than during the same period in 2019. Cases declined from the end of February 2020 through the end of April, then increased from May through June, briefly declined in July, and resurged again through December 2020. Overall reported cases were higher in 2020 than in 2019.
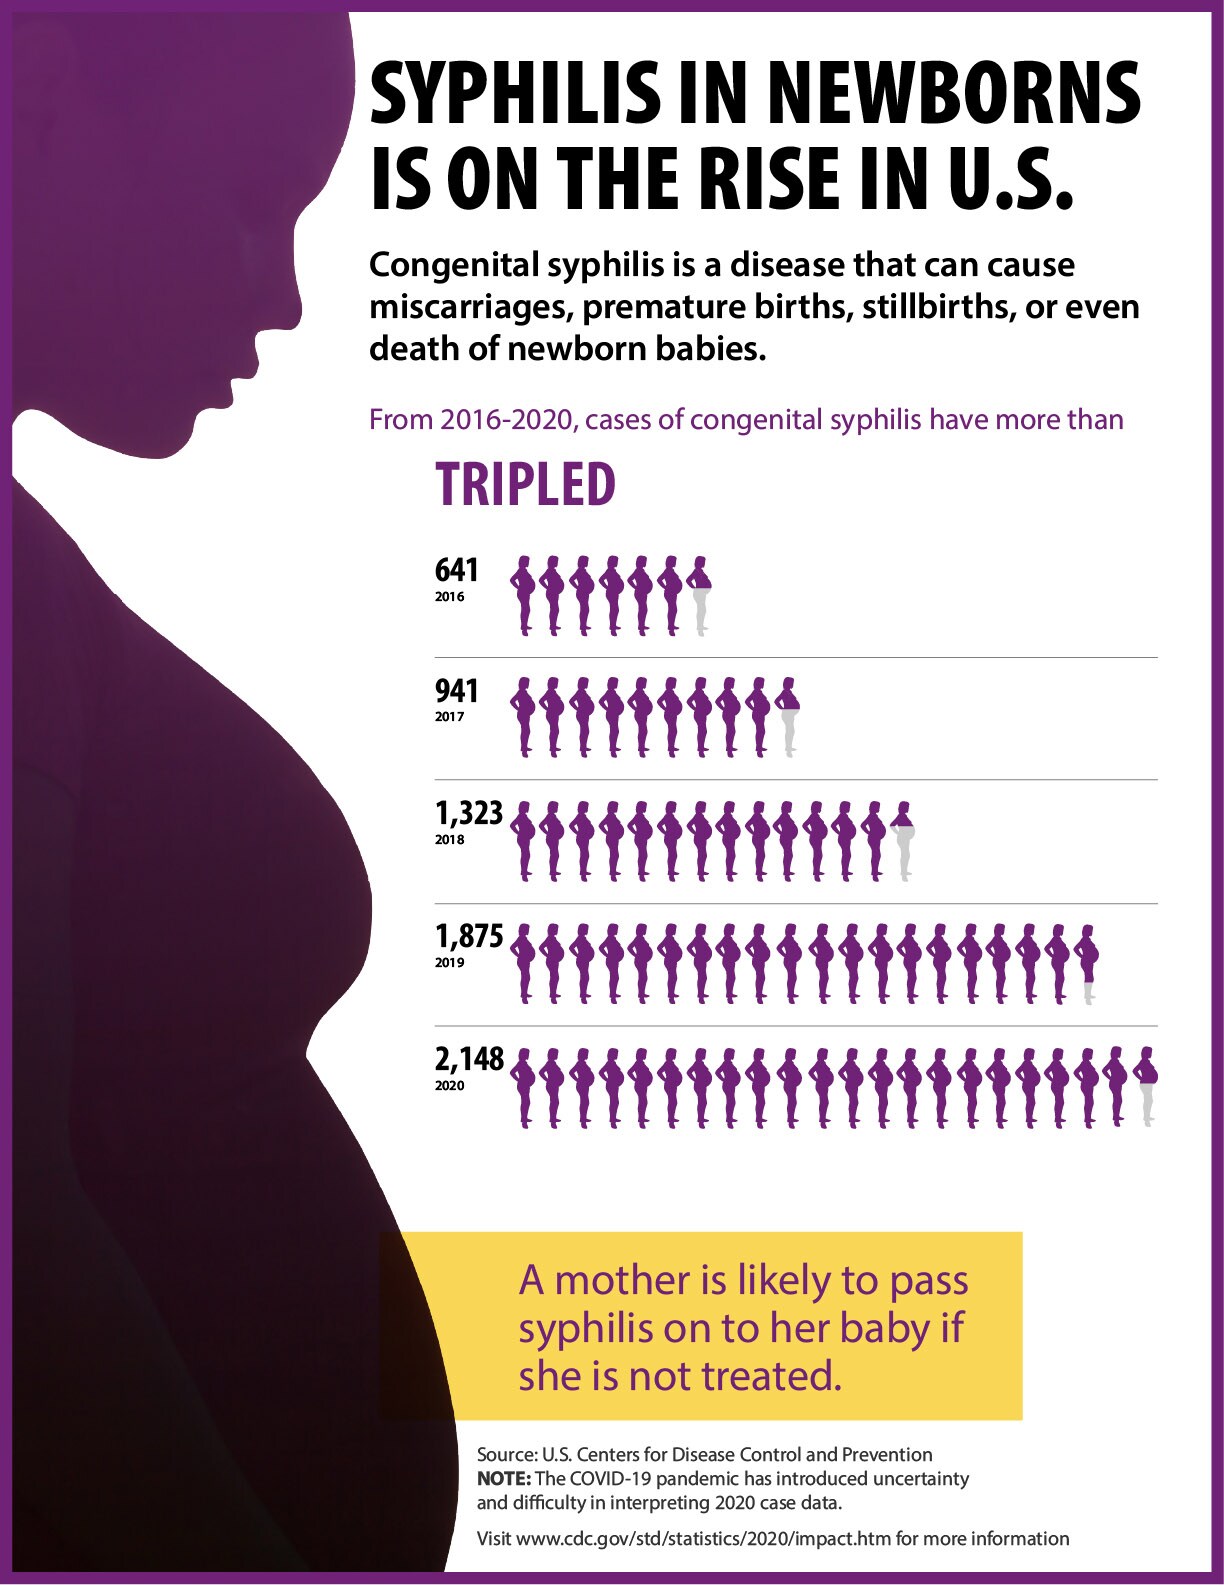
This graphic includes 5 rows of data depicting the increasing number of congenital syphilis cases between 2016 and 2020. In 2016, there were 641 cases of congenital syphilis, in 2017, there were 941 cases, in 2018, there were 1,323 cases, in 2019, there were 1,875 cases, and in 2020, there were 2,148 cases.
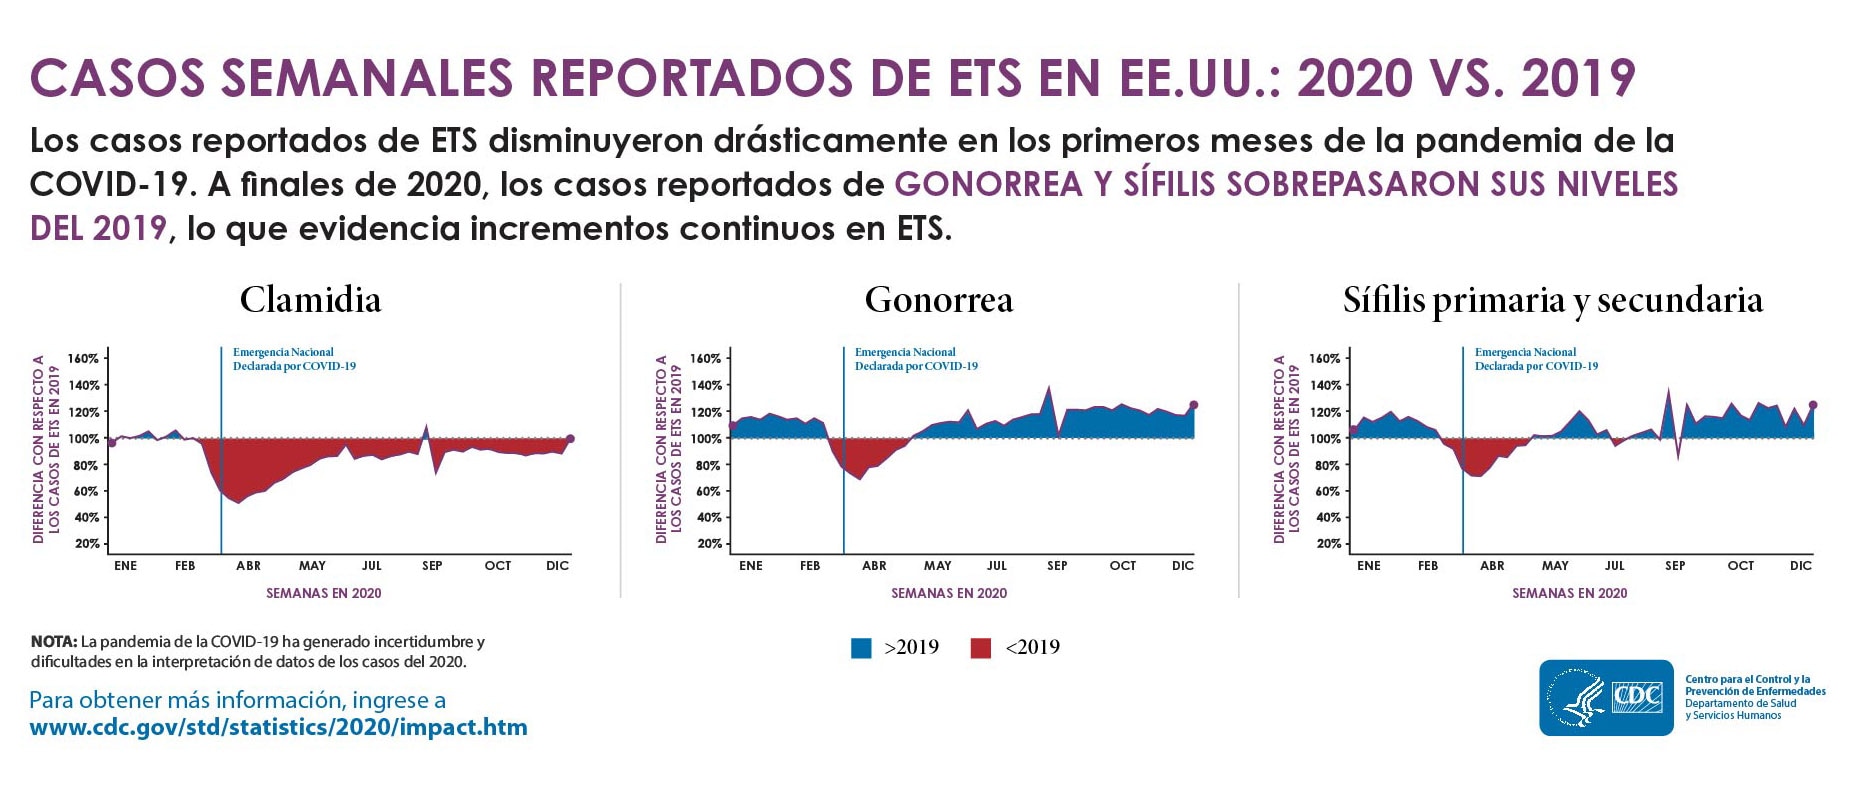
Esta imagen compara el numero de casos de ETS reportados a la semana en los Estados Unidos entre el año 2020 y el 2019. Contiene tres imágenes, el primero para la clamidia, el segundo para la gonorrea, y el tercero para la sífilis primaria y secundaria.
Para la clamidia, la imagen muestra que los casos reportados desde enero a febrero del 2020 fueron mayores que esos reportados en el mismo periodo en el 2019. Desde el final de febrero 2020 al final de diciembre 2020, casos reportados fueron menos que esos reportados en el 2019. En resumen, menos casos fueron reportado en el año 2020 que en el 2019.
Para la gonorrea, la imagen muestra que los casos reportados en enero hasta el final de febrero 2020 fueron mayores que esos reportados en el mismo periodo en el 2019. Desde el final de febrero hasta mayo del 2020, casos disminuyeron y después aumentaron hasta el final de diciembre 2020. En resumen, más cases fueron reportados en el año 2020 que en el 2019.
Para la sífilis primaria y secundaria, la imagen muestra que los casos reportados en enero hasta el final de febrero 2020 fueron mayores que esos reportados en el mismo periodo en el 2019. Casos disminuyeron desde el final de febrero 2020 hasta el final de abril, después aumentaron de mayo a junio, disminuyeron brevemente en julio, y aumentaron otra vez hasta diciembre 2020. En resumen, más casos fueron reportados en el año 2020 que en el 2019.
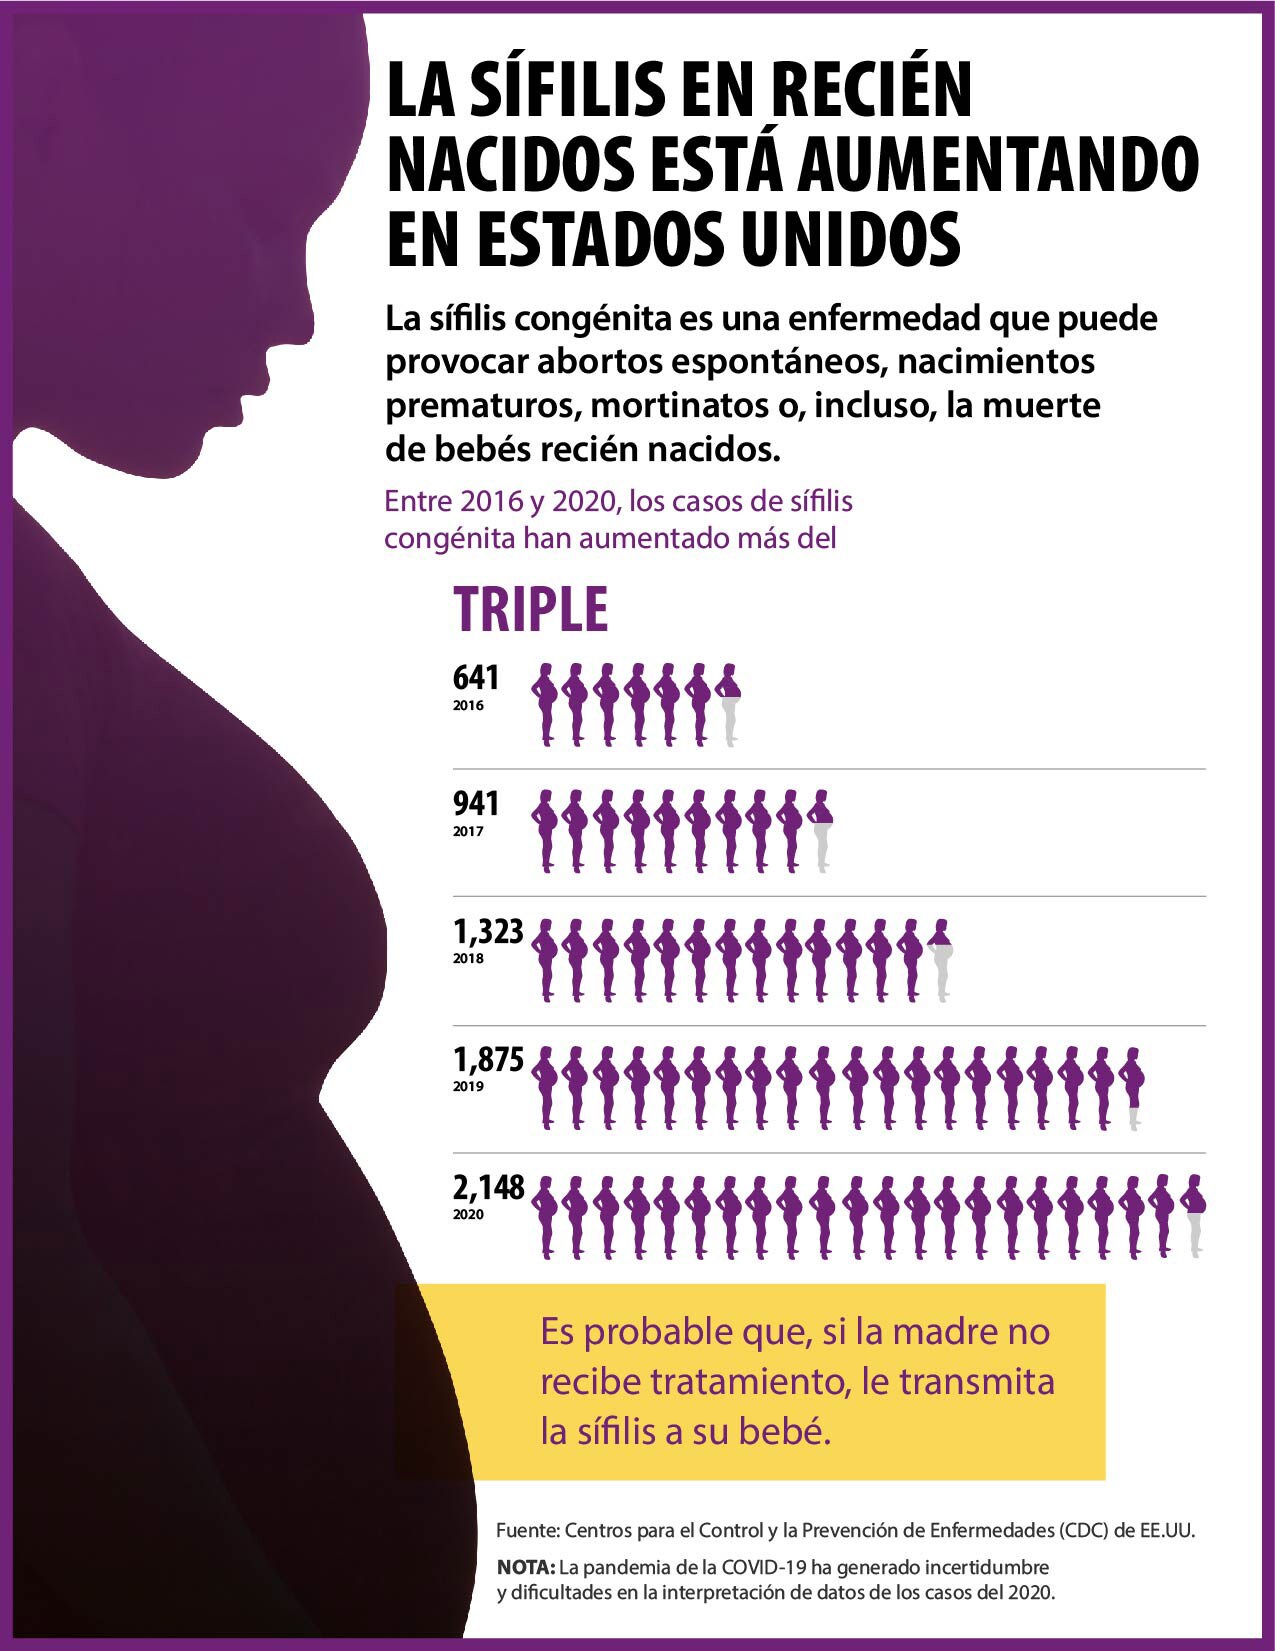
Esta imagen incluye 5 filas de datos representando el aumento en el número de casos de sífilis congénita entre los años 2016 al 2020. In el 2016, hubieron 641 cases de sífilis congénito, en el 2017 hubieron 941 casos, in el 2018 hubieron 1,323 casos, en el 2019 hubieron 1,875 cases, y en el 2020, hubieron 2,148 casos.


