At a glance
Social determinants of health (SDOH) refer to the nonmedical factors that impact health outcomes. The data in this report highlight differences in HIV burden and selected care outcomes by sex, age, race/ethnicity, and transmission category in the United States and Puerto Rico by using 6 SDOH indicators: federal poverty status, median household income, education level, health insurance coverage, cost-burdened households, and residential instability.
Download the data
Key findings
National overview
This report provides data on social determinants of health (SDOH) and selected care outcomes by using data from the National HIV Surveillance System (NHSS) for persons with HIV diagnosed during 2023 in the United States and Puerto Rico. SDOH refers to the conditions in the environments where people are born, live, learn, work, play, worship, and age. These conditions affect a wide range of health outcomes and risks.
Examination of HIV surveillance data has revealed differences in HIV burden and selected care outcomes in the United States and Puerto Rico based on demographic factors, such as sex, age, race/ethnicity, and transmission category. Factors beyond demographics, such as SDOH, may provide a deeper understanding of the disparities in HIV burden and selected care outcomes. SDOH data contribute to program planning and help inform broader efforts to achieve U.S. national prevention and care goals such as those outlined in Healthy People 2030 and the Ending the HIV Epidemic in the U.S. (EHE) initiative. This overview summarizes the national data presented in this report.
SDOH domains
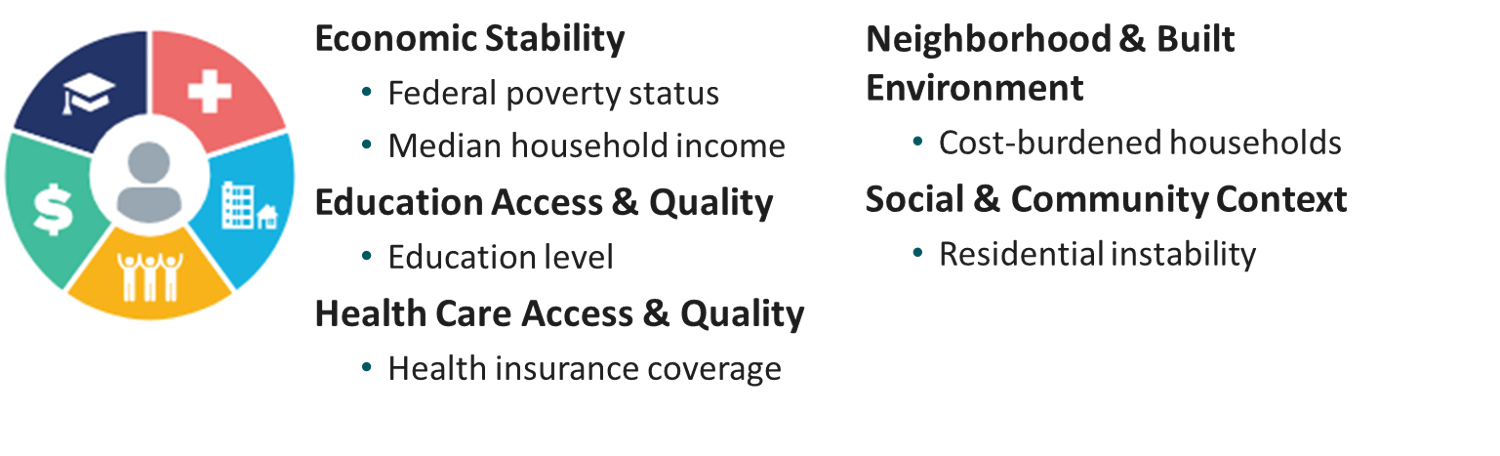
Healthy People 2030 identifies 5 key domains of SDOH: economic stability, education access and quality, healthcare access and quality, neighborhood and built environment, and social and community context. For this report, we selected at least 1 indicator from each SDOH domain, which includes: federal poverty status, median household income, education level, health insurance coverage, cost-burdened household, and residential instability.
Important notes
- HIV surveillance data are based on case information for adults aged ≥ 18 years with HIV diagnosed during 2023 in the United States and Puerto Rico and reported to CDC's NHSS as of January 2025.
- Data on linkage to HIV medical care within 1 month and viral suppression within 6 months of HIV diagnosis are based on data from the United States.
- Data are presented for geocoded HIV surveillance data that have been linked with SDOH indicator variables from the U.S. Census Bureau's 2019–2023 American Community Survey (ACS). HIV surveillance data are geocoded to the county level by address of residence at the time of diagnosis and linked to county-level SDOH data from the ACS.
- HIV surveillance data were limited to adults aged ≥ 18 years at diagnosis to align with the ACS population.
- The statements in the Overview, unless otherwise indicated, are based on 12 or more diagnoses. Small numbers, and percentages based on these numbers, should be interpreted with caution.
- All rates are per 100,000 population.
- The population denominators used to compute the HIV diagnosis rates for the United States and Puerto Rico were based on the U.S. Census Bureau's 2023 Vintage postcensal estimates file.
- Highlighted data are a snapshot of the environment in which people lived at the time of HIV diagnosis, and some SDOH indicators and selected characteristics may be correlated.
- All data presented are considered provisional and subject to change as additional information is submitted for HIV cases and as HIV surveillance data quality improves with routine evaluation of the surveillance system and data repository.
- Refer to the report's slide deck for figures and to the tables for additional data and stratifications. General SDOH data can also be accessed through NCHHSTP AtlasPlus.
- See Technical Notes for information on definitions and data specifications.
Overview
In 2023 in the United States and Puerto Rico, 38,805 adults aged ≥ 18 years received an HIV diagnosis and had residential address information that was sufficient for geocoding to the county level.
- Overall rate—14.8 (males: 24.6; females: 5.5).
Linkage to HIV medical care and viral suppression were based on data for adults with HIV diagnosed during 2023 in the United States who had residential address information in NHSS that was sufficient for geocoding to the county level. Of the 38,416 adults with HIV diagnosed during 2023 in the United States:
- Linked to HIV medical care within 1 month of diagnosis—82.7% (31,781).
- Suppressed viral load within 6 months of diagnosis—70.7% (27,149).
SDOH categories
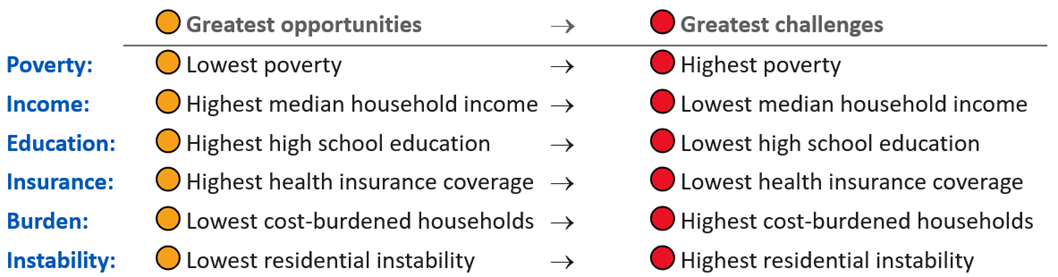
SDOH indicator variables were categorized by using empirically derived quartiles—ranging from counties with the greatest economic and social opportunities (denoted with orange circles) to counties with the greatest economic and social challenges (denoted with red circles):
SDOH report cards
This section presents data for adults with HIV diagnosed during 2023, by selected SDOH indicators. Each report card focuses on one SDOH indicator and identifies the groups living in counties with the greatest economic and social challenges who had the least favorable outcomes:
- the highest HIV diagnosis rates or percentages (HIV diagnoses),
- the lowest percentages of adults linked to HIV medical care within 1 month of receiving a diagnosis (Linked to care [1 month]), and
- the lowest percentages of adults with suppressed viral load within 6 months of receiving an HIV diagnosis (Suppressed VL [6 months]).
Federal poverty status
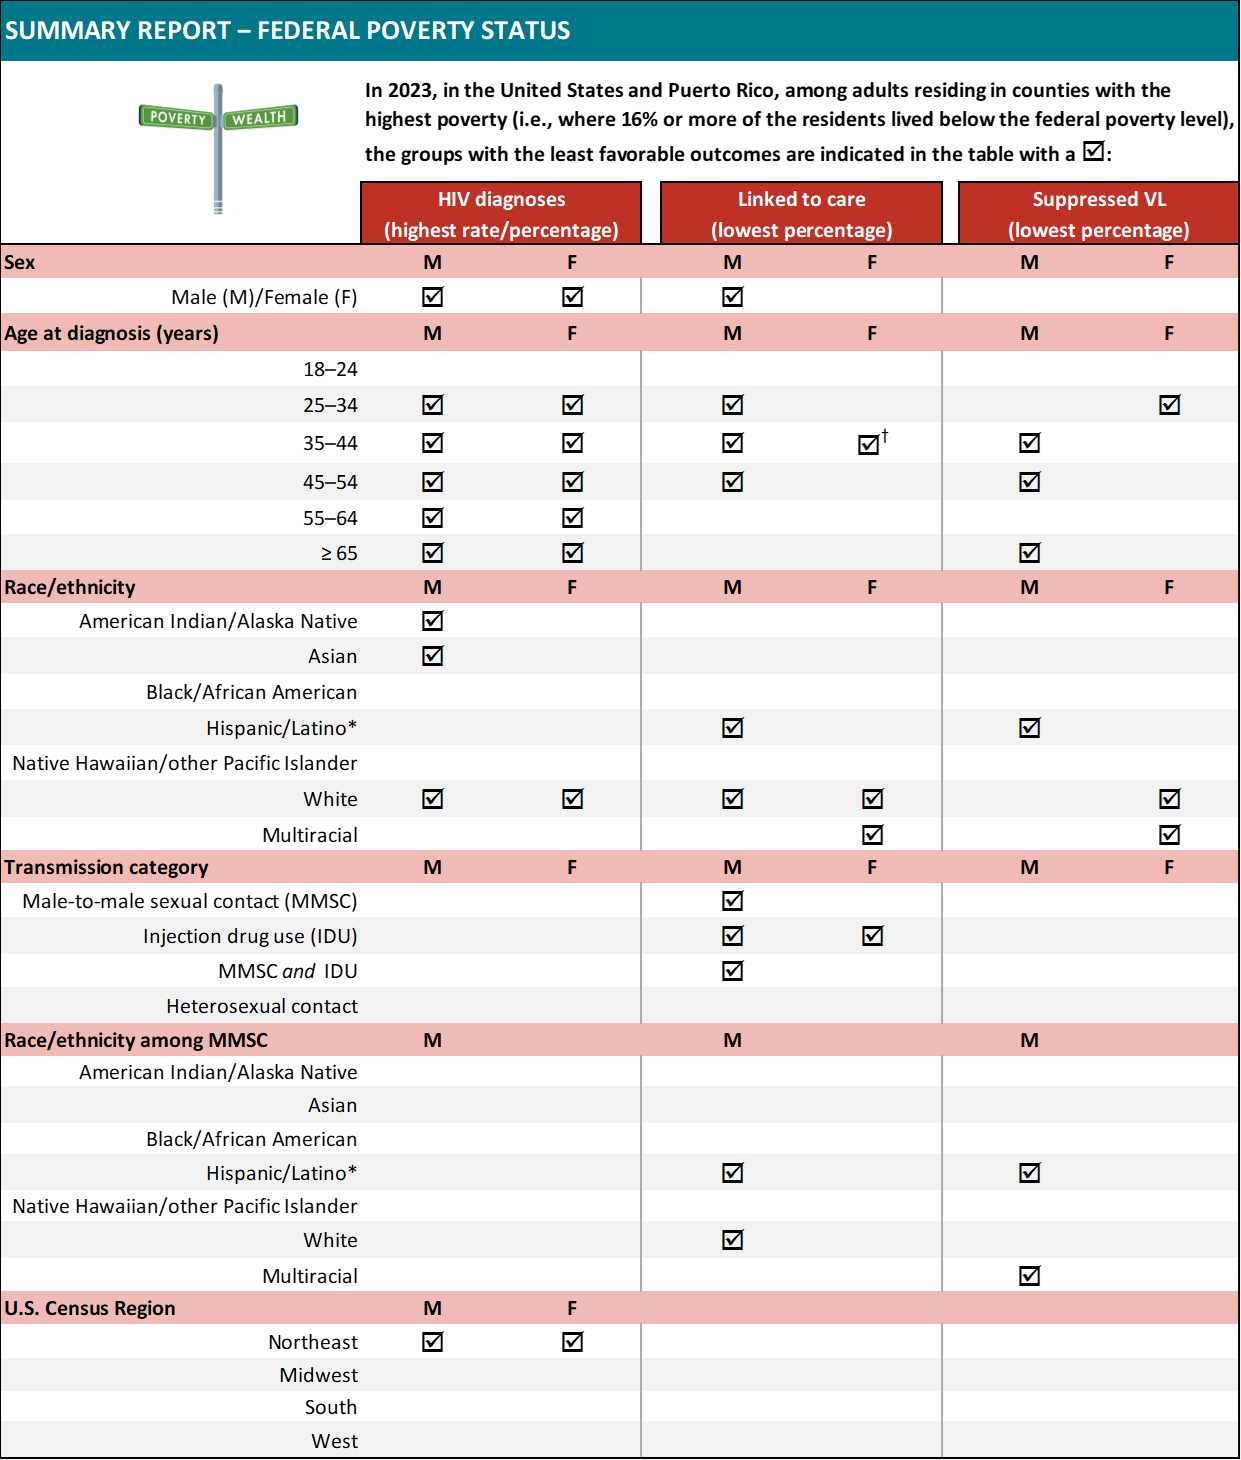
Abbreviation: VL, viral load.
Note. Rates are per 100,000 population. For linkage to care and viral suppression, focus on SDOH extremes only (e.g., highest poverty, lowest insured) and not the overall values unless otherwise indicated. Some data are not provided because populations are small or data are not available. Racial groups may include persons who are also Hispanic/Latino due to how the data are reported in the American Community Survey. Refer to Technical Notes for details.
† The highest diagnosis rate or percentage, lowest percentage linked to care within 1 month of receiving a diagnosis, or lowest percentage with suppressed viral load within 6 months of receiving a diagnosis was observed in the highest poverty quartile and in one or more additional quartiles.
* Hispanic/Latino persons can be of any race.
Median household income
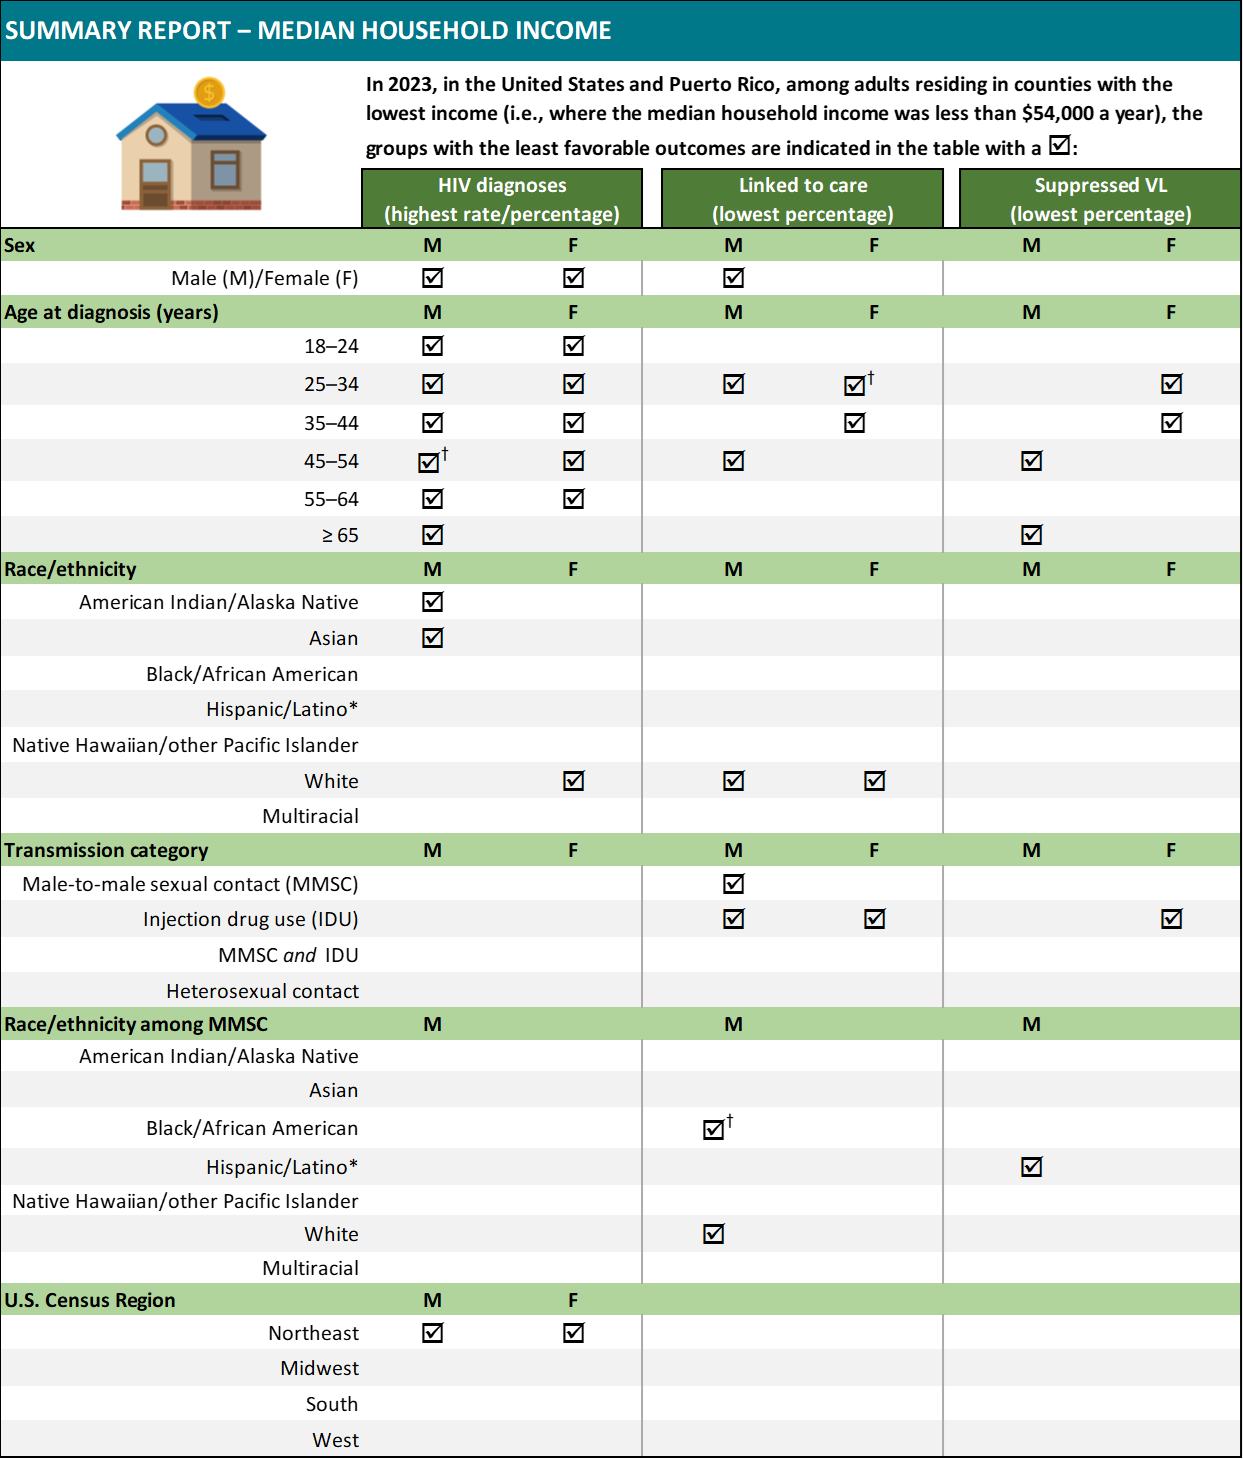
Abbreviation: VL, viral load.
Note. Rates are per 100,000 population. For linkage to care and viral suppression, focus on SDOH extremes only (e.g., highest poverty, lowest insured) and not the overall values unless otherwise indicated. Some data are not provided because populations are small or data are not available. Racial groups may include persons who are also Hispanic/Latino due to how the data are reported in the American Community Survey. Refer to Technical Notes for details.
† The highest diagnosis rate or percentage, lowest percentage linked to care within 1 month of receiving a diagnosis, or lowest percentage with suppressed viral load within 6 months of receiving a diagnosis was observed in the lowest income quartile and in one or more additional quartiles.
* Hispanic/Latino persons can be of any race.
Education level
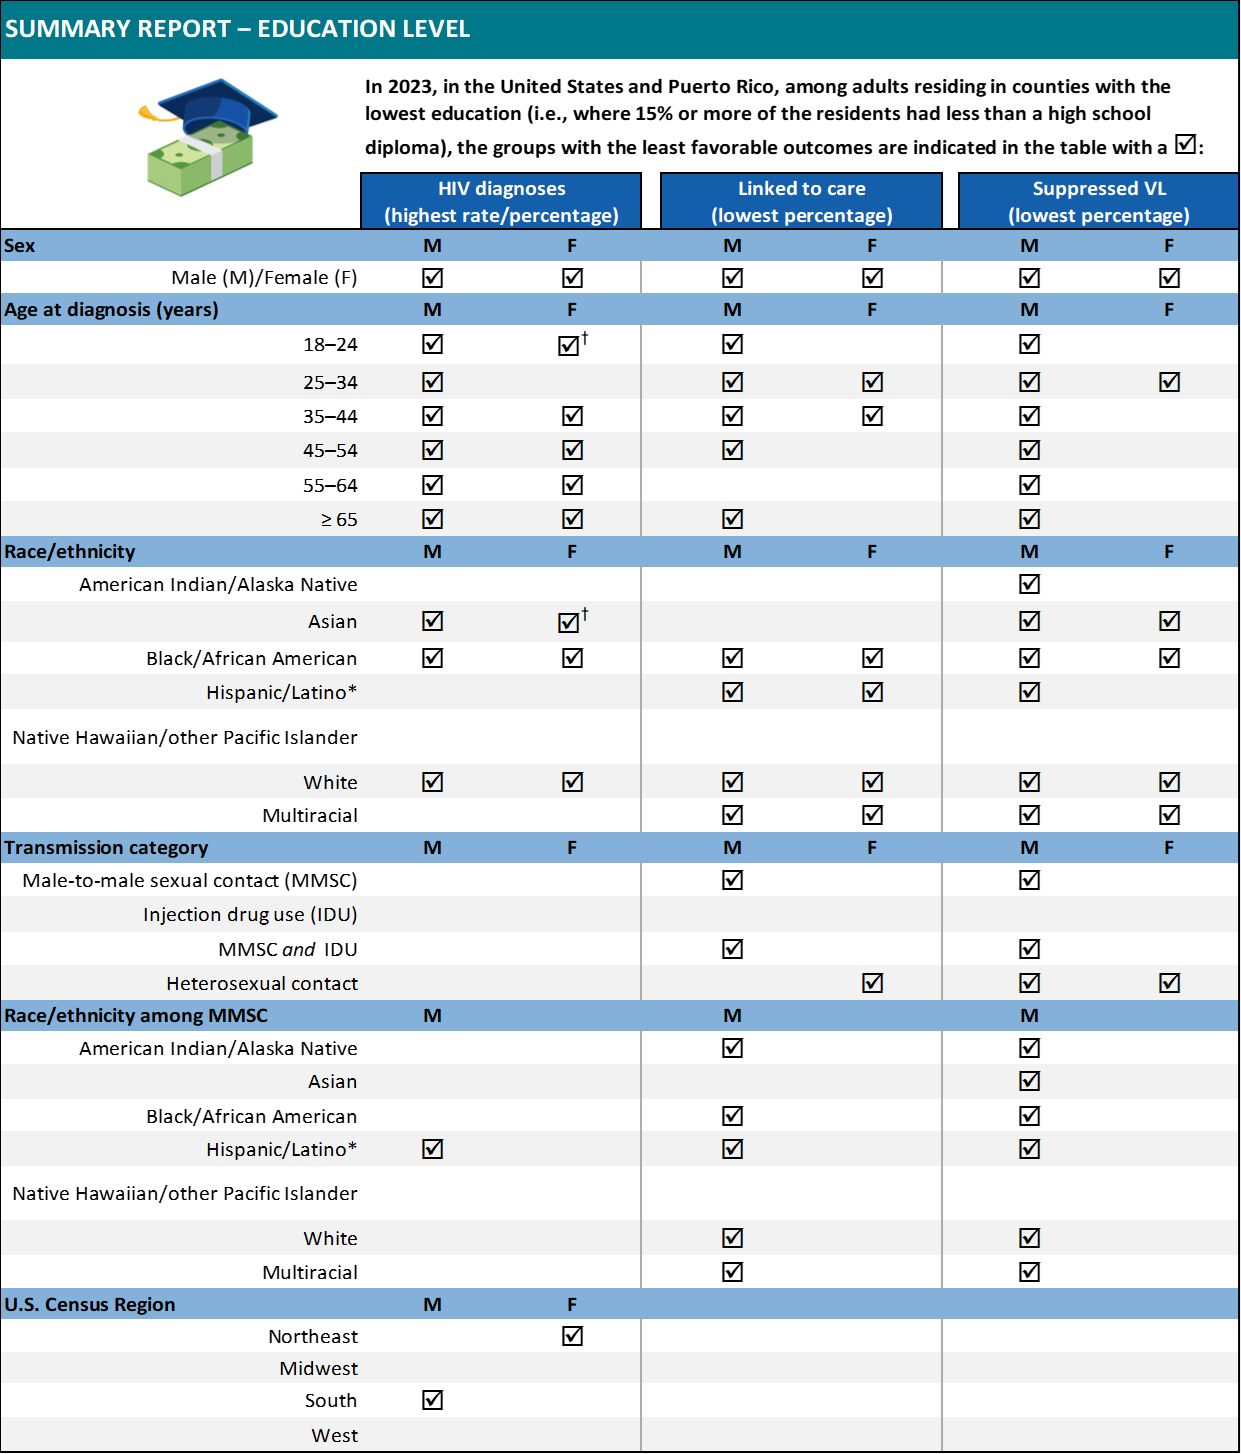
Abbreviation: VL, viral load.
Note. Rates are per 100,000 population. For linkage to care and viral suppression, focus on SDOH extremes only (e.g., highest poverty, lowest insured) and not the overall values unless otherwise indicated. Some data are not provided because populations are small or data are not available. Racial groups may include persons who are also Hispanic/Latino due to how the data are reported in the American Community Survey. Refer to Technical Notes for details.
† The highest diagnosis rate or percentage, lowest percentage linked to care within 1 month of receiving a diagnosis, or lowest percentage with suppressed viral load within 6 months of receiving a diagnosis was observed in the lowest education quartile and in one or more additional quartiles.
* Hispanic/Latino persons can be of any race.
Health insurance coverage
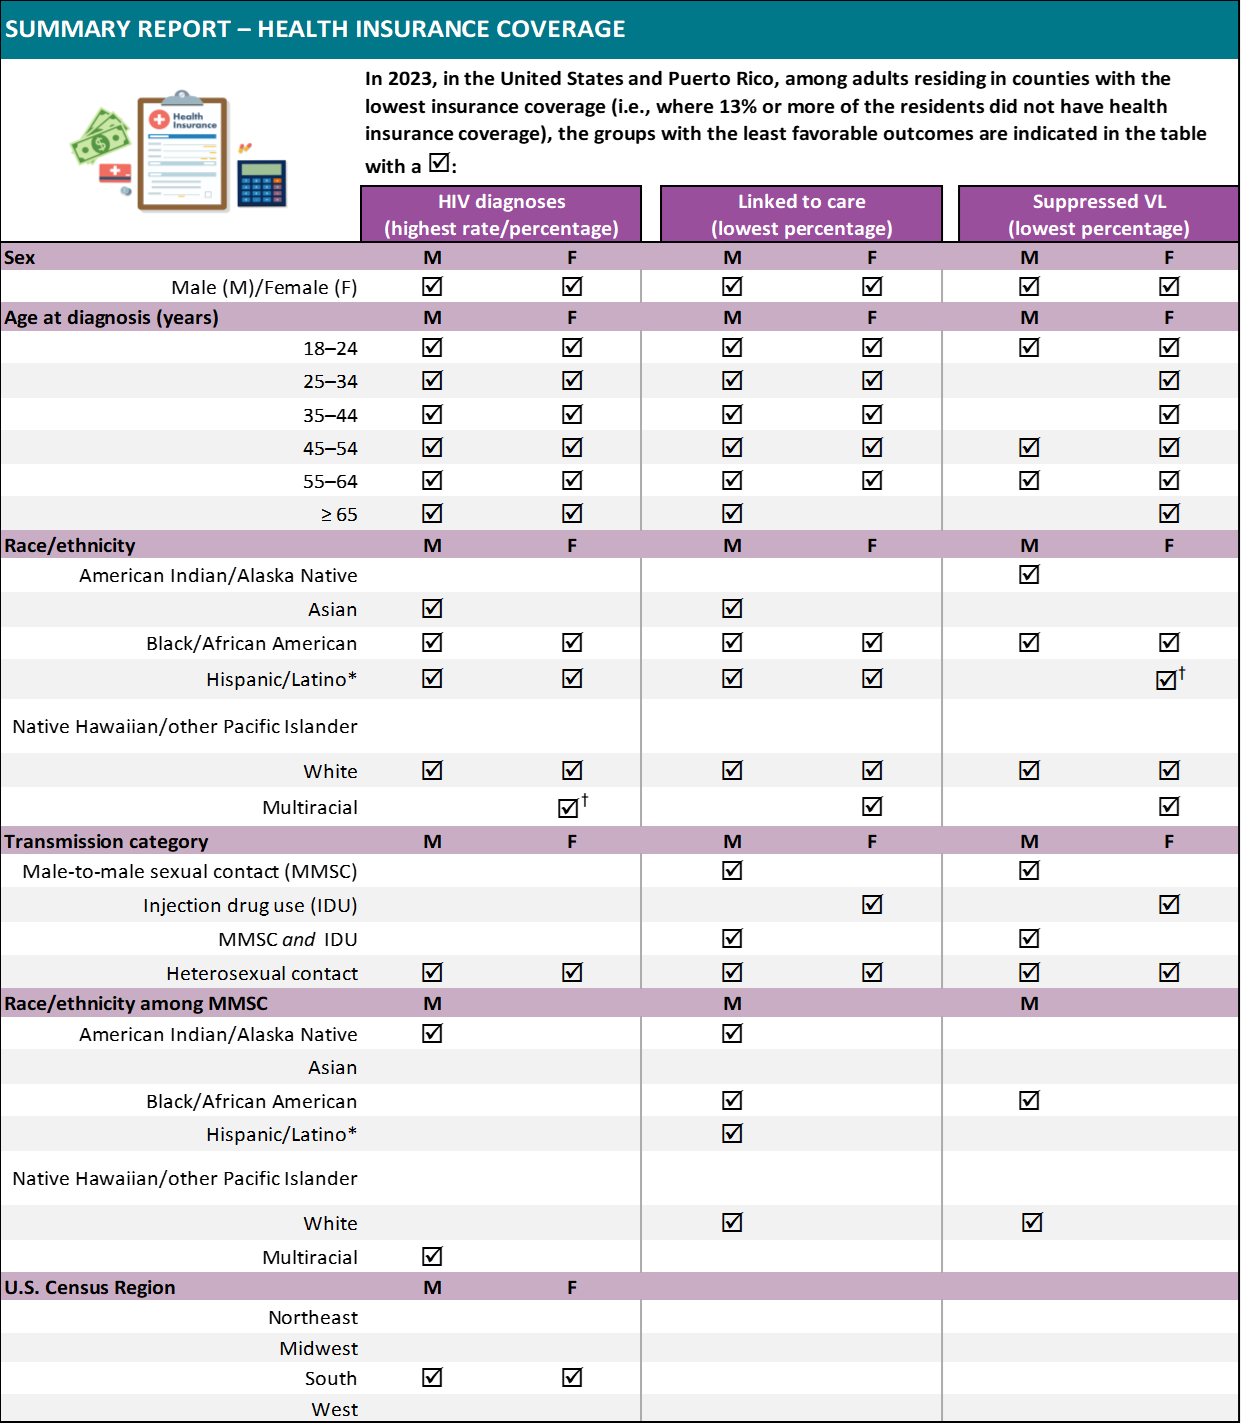
Abbreviation: VL, viral load.
Note. Rates are per 100,000 population. For linkage to care and viral suppression, focus on SDOH extremes only (e.g., highest poverty, lowest insured) and not the overall values unless otherwise indicated. Some data are not provided because populations are small or data are not available. Racial groups may include persons who are also Hispanic/Latino due to how the data are reported in the American Community Survey. Refer to Technical Notes for details.
† The highest diagnosis rate or percentage, lowest percentage linked to care within 1 month of receiving a diagnosis, or lowest percentage with suppressed viral load within 6 months of receiving a diagnosis was observed in the lowest insurance coverage quartile and in one or more additional quartiles.
* Hispanic/Latino persons can be of any race.
Cost-burdened household
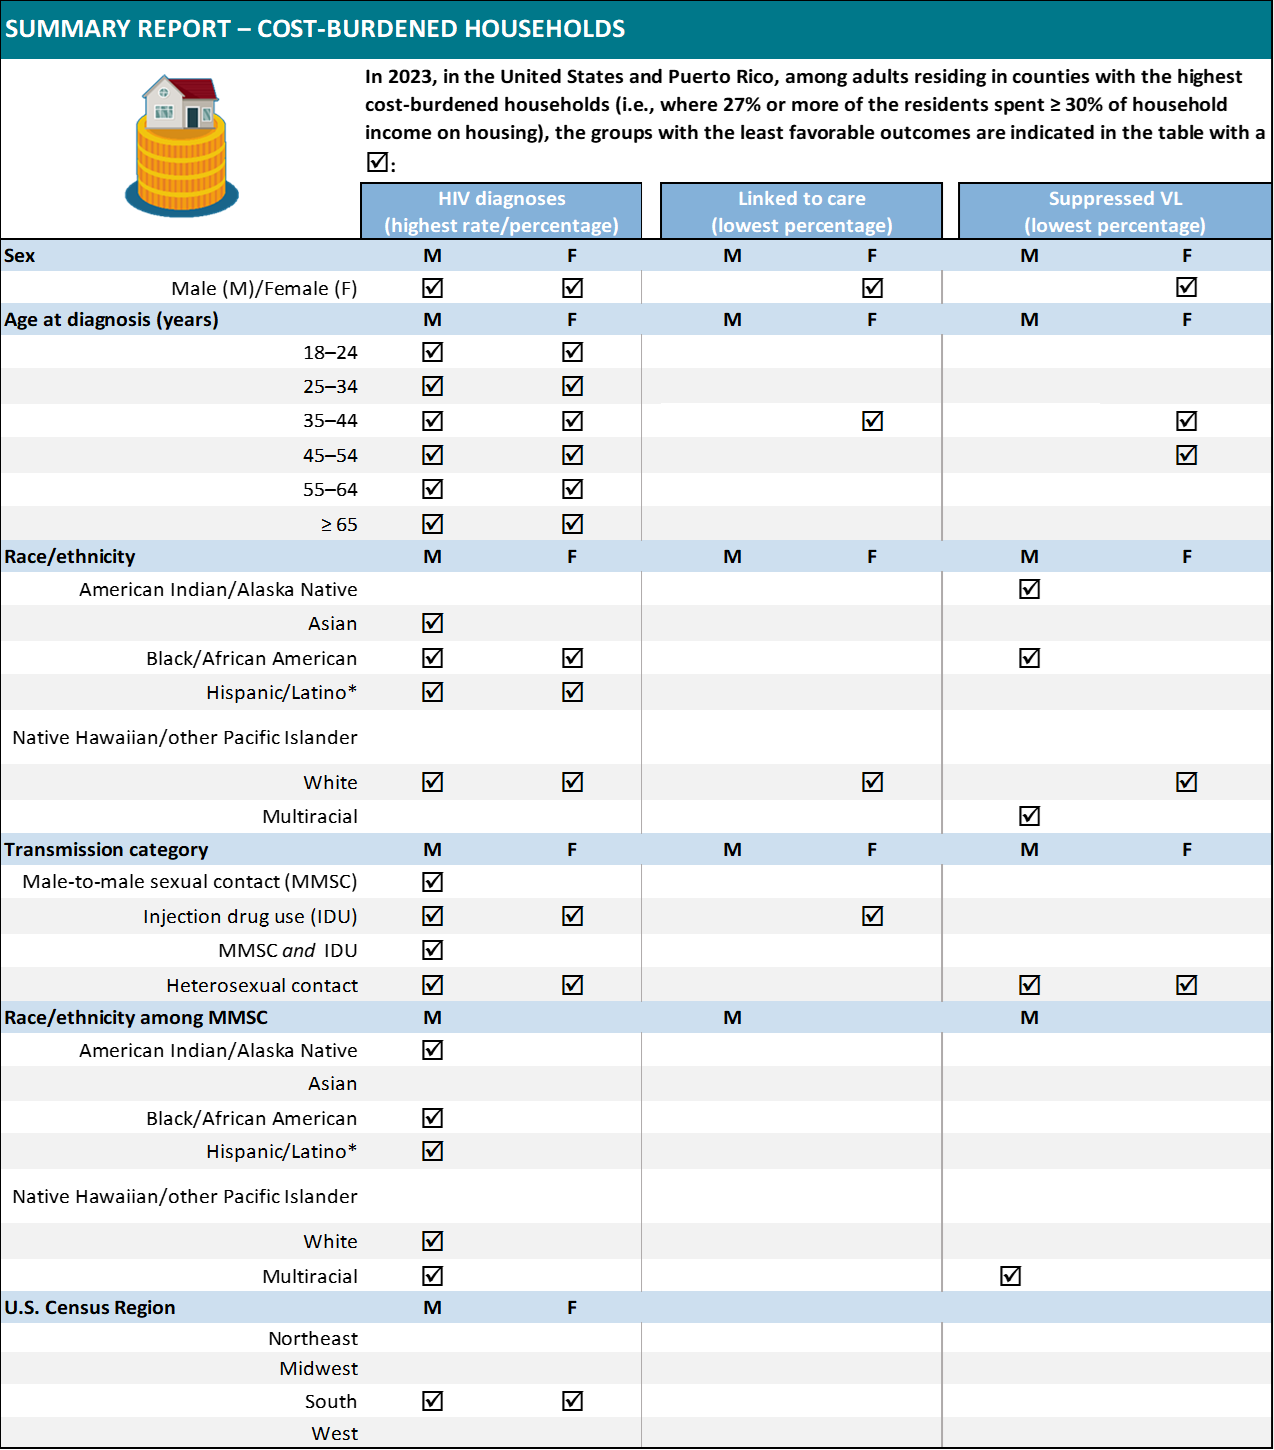
Abbreviation: VL, viral load
Note. Rates are per 100,000 population. For linkage to care and viral suppression, focus on SDOH extremes only (e.g., highest poverty, lowest insured) and not the overall values unless otherwise indicated. Some data are not provided because populations are small or data are not available. Racial groups may include persons who are also Hispanic/Latino due to how the data are reported in the American Community Survey. Refer to Technical Notes for details.
† The highest diagnosis rate or percentage, lowest percentage linked to care within 1 month of receiving a diagnosis, or lowest percentage with suppressed viral load within 6 months of receiving a diagnosis was observed in the highest cost-burdened households quartile and in one or more additional quartiles.
* Hispanic/Latino persons can be of any race.
Residential instability
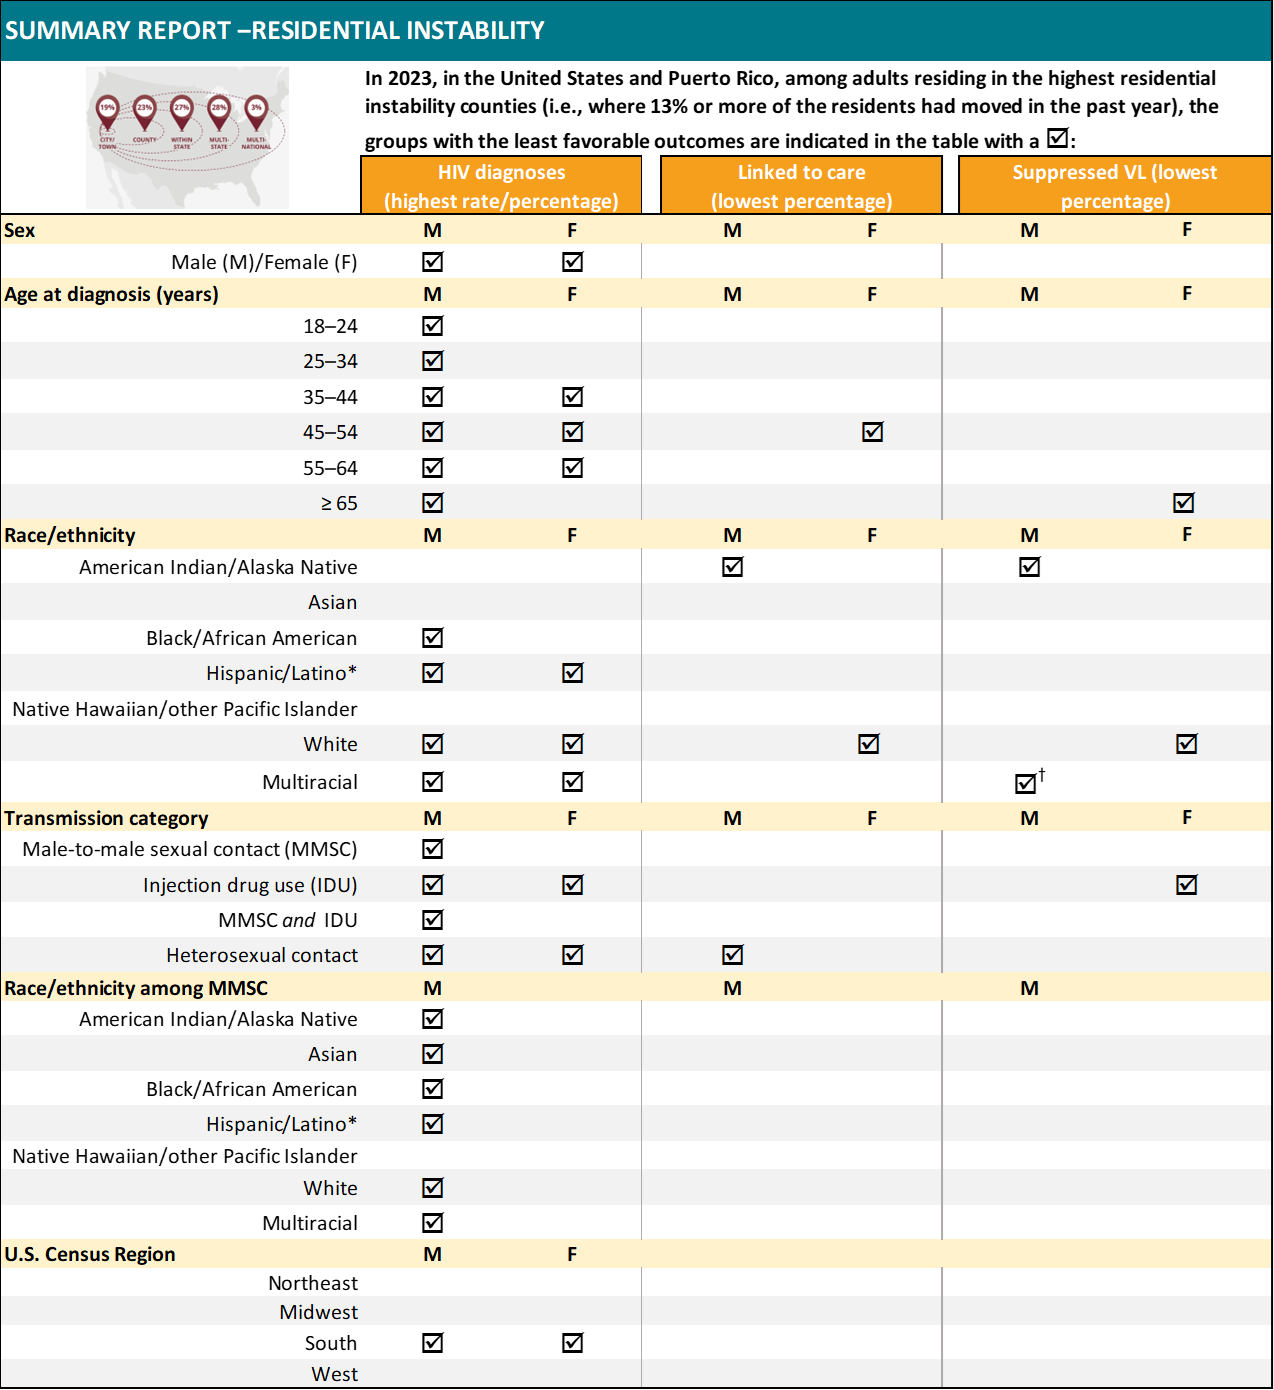
Abbreviation: VL, viral load.
Note. Rates are per 100,000 population. For linkage to care and viral suppression, focus on SDOH extremes only (e.g., highest poverty, lowest insured) and not the overall values unless otherwise indicated. Some data are not provided because populations are small or data are not available. Racial groups may include persons who are also Hispanic/Latino due to how the data are reported in the American Community Survey. Refer to Technical Notes for details.
† The highest diagnosis rate or percentage, lowest percentage linked to care within 1 month of receiving a diagnosis, or lowest percentage with suppressed viral load within 6 months of receiving a diagnosis was observed in the highest residential instability quartile and in one or more additional quartiles.
* Hispanic/Latino persons can be of any race.
Technical notes
Data presented in Social Determinants of Health and Selected Care Outcomes among Adults with HIV Diagnosed during 2023 in the United States and Puerto Rico are based on cases reports from 50 states, the District of Columbia, and Puerto Rico. HIV surveillance data are geocoded to the county level by address of residence at the time of diagnosis and linked to county-level SDOH data from the ACS. For 2023 data, approximately 8% of these geocoded addresses are non-residential. Cases were excluded if a county could not be associated with the case. Counties were excluded if SDOH information was not available for the county, or the assigned county could not be matched to a county provided by the ACS. Although HIV diagnosis data associated with these exclusions were not included in all SDOH subpopulation totals, they were included in the overall subtotals stratified by sex. Consequently, all tables display varying denominators for SDOH subpopulation categories.
Information on HIV surveillance in the United States, including protocols for presentation of data by sex, race/ethnicity, transmission category, and regional data, can be found in the Technical Notes for the National HIV Surveillance System (NHSS).
SDOH variables and definitions
For this report, the SDOH indicator variables were categorized by using empirically derived quartiles (dataset divided into 4 equal parts), and each quartile cutpoint was rounded to the nearest integer. The quartile cutpoints were determined by using data from all counties in the United States and Puerto Rico and not just from the data applicable to persons with an HIV diagnosis. Information on county data can be found at Counties (and equivalents). This report presents 6 SDOH indicator variables from the 5-year ACS estimates: federal poverty status, median household income, education level, health insurance coverage, cost-burdened household, and residential instability.
|
SDOH Variable |
Definition |
ACS Variable |
Subject Definition |
| Federal poverty status | proportion of residents in the county who were living below the U.S. poverty level (i.e., below a specified threshold) during the 12 months before the survey response (individuals aged ≥ 18 years) | B17001: Poverty status in the past 12 months by sex and age | Poverty Status in the Past 12 Months |
| Median household income | median income for a household within the county during the 12 months before the survey response | B19013: Median household income in the past 12 months (in 2023 inflation-adjusted dollars) | Median Income |
| Education level | proportion of residents in the county with less than a high school diploma (individuals aged ≥ 18 years) | B15001: Sex by age by educational attainment for population aged 18 years and over | Educational Attainment |
| Health insurance coverage | proportion of residents in the county without health insurance or health coverage plan (individuals aged ≥ 18 years) | B27001: Health insurance coverage status by sex by age | Health Insurance Coverage |
| Cost-burdened household | proportion of households within the county that spend more than 30% of their income on housing costs, which includes rent, mortgage, utilities, taxes, and insurance | B25091: Mortgage status by selected monthly owner costs as a percentage of household income in the past 12 months
B25070: Gross rent as a percentage of household income in the past 12 months |
Mortgage Status |
| Residential instability | proportion of people who moved in the past year | B07003: Geographical mobility in the past year by sex for current residence in the United States | Residence 1 Year Ago |
Tabulation and presentation of data
1. Definitions and Data Specifications
1.1 Diagnoses
The term diagnosis of HIV infection is defined as a diagnosis of HIV regardless of the stage of disease (stage 0, 1, 2, 3 [AIDS], or unknown).
More information on counting HIV diagnoses can be found in the Technical Notes of the latest HIV Diagnoses, Deaths, and Prevalence Surveillance Report.
1.2 Linkage to HIV medical care and viral suppression
The data on linkage to HIV medical care were based on persons with HIV diagnosed during the specified year. Linkage to HIV medical care within 1 month of HIV diagnosis was measured by documentation of ≥ 1 CD4 (count or percentage) or viral load tests performed within ≤ 1 month of HIV diagnosis, including tests performed on the same date as the date of diagnosis.
Viral suppression within 6 months of diagnosis was measured for persons with HIV diagnosed during the specified year. Viral suppression was defined as a viral load result of < 200 copies/mL at any viral load test within 6 months of an HIV diagnosis made during the specified year.
More information on calculating linkage to HIV medical care and viral suppression can be found in the Technical Notes of the latest Monitoring selected national HIV prevention and care objectives by using HIV surveillance data—United States and 6 territories and freely associated states Supplemental Report
2. Rates
Rates per 100,000 population were calculated for the numbers of HIV diagnoses. The population denominators used to compute these rates for the 50 states, the District of Columbia, and Puerto Rico were based on the 5-year ACS estimated total population for those areas. The denominators used for calculating age-, sex-, and race/ethnicity-specific rates were computed by applying the 5-year estimates for age, sex, and race/ethnicity for these areas. Small numbers, and rates and percentages based on these numbers, should be interpreted with caution.
Subpopulation stratifications of race data by age group and sex from the 5-year ACS estimates may include Hispanic/Latino persons for racial groups other than White persons. As a result, there may be overlap in populations for these racial groups and Hispanic/Latino persons and, therefore, diagnosis rates by race/ethnicity should be interpreted with caution. Of the denominator population from the ACS data in this report, for American Indian/Alaska Native persons, 40.2% were Hispanic/Latino (40.1% when Puerto Rico is excluded); for Asian persons, 1.3% were Hispanic/Latino (1.3% when Puerto Rico is excluded); for Black/African American persons, 3.2% were Hispanic/Latino (2.7% when Puerto Rico is excluded); and for Native Hawaiian/other Pacific Islander persons, 10.1% were Hispanic/Latino (10.1% when Puerto Rico is excluded).Finally, the denominator population from the ACS is based on the entire population aged ≥ 18 years; the numerator population is limited to persons whose HIV had been diagnosed and reported, with complete residential address, to the NHSS. Because the ACS uses predetermined age categories and varying criteria for SDOH variables, the denominators differ for some SDOH variables.
Acknowledgements
HIV Surveillance Branch
Division of HIV Prevention
National Center for HIV, Viral Hepatitis, STD, and TB Prevention
Centers for Disease Control and Prevention
Publication of this report would not have been possible without the contributions of the state and territorial health departments and the HIV surveillance programs that provided surveillance data to CDC.
Suggested citation
All material contained in this report is in the public domain and may be used and reprinted without special permission; however, citation of the source is appreciated.
Social Determinants of Health and Selected Care Outcomes among Adults with HIV Diagnosed during 2023 in the United States and Puerto Rico. Centers for Disease Control and Prevention. Published September 30, 2025. Accessed [date]. https://www.cdc.gov/hiv-data/nhss/sdoh-hiv-diagnoses-and-selected-care-outcomes-2025.html.