What to know
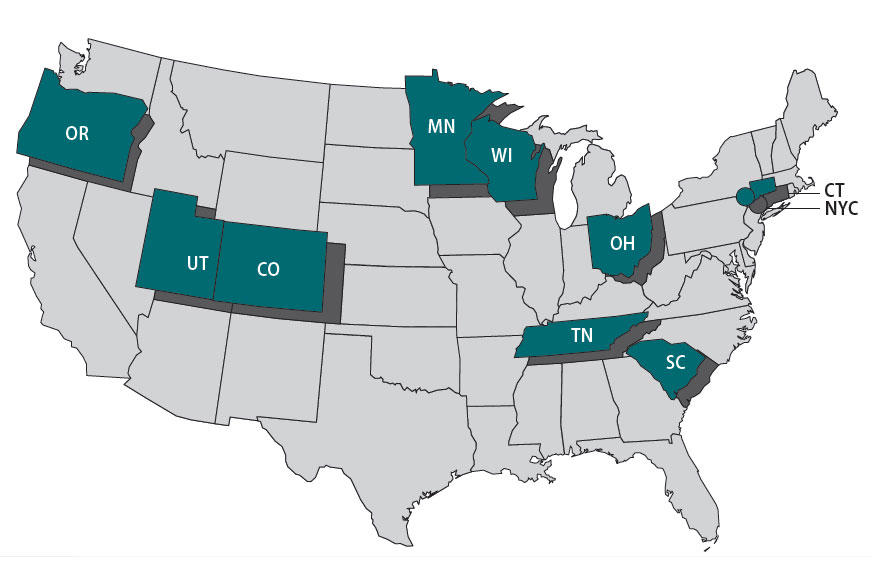
The Foodborne Diseases Centers for Outbreak Response Enhancement (FoodCORE) program addresses gaps in foodborne disease response through enhanced capacity in laboratory, epidemiology, and environmental health to improve timeliness and completeness of outbreak response activities. The FoodCORE centers during Year 12 (January 1, 2022–December 31, 2022) were Colorado, Connecticut, Minnesota, New York City, Ohio, Oregon, South Carolina, Tennessee, Utah, and Wisconsin.
Highlights
In 2022, FoodCORE staff remained deployed to emergency responses, including the rapidly growing monkeypox response, and, to a lesser extent, COVID-19. After their deployments, FoodCORE staff faced a new set of challenges as they transitioned back to their enteric disease roles. Many public health workers left the workforce citing burnout, negative mental and physical outcomes, wages, and limited opportunities for job growth. The gap in the workforce was felt at all levels of organization. For those that were able to fill vacant positions, onboarding, training, and getting staff up-to-speed was time-consuming and resource intensive.
Facing major workforce gaps, local health departments continued to lean on their state counterparts for enteric disease investigation and interview support. Student teams at FoodCORE centers were invaluable in adding capacity for case follow-up, data entry, enhanced surveillance activities, and investigations. Post-response, student teams continue to support enteric investigation and response capacity for single- and multi-state clusters and outbreaks.
Progress still occurred in other areas. More efficient approaches and processes were implemented, like moving from paper to electronic forms and transitioning to online data systems. Through their deployments, health department staff forged stronger relationships with their epidemiology, laboratory, and environmental health counterparts. Close communication and collaboration among these three disciplines is critical for timely and effective outbreak investigation and response.
In 2022, a success story was drafted recognizing Colorado's successful efforts to stop a multistate Salmonella outbreak linked to seafood. FoodCORE success stories document how centers advance public health and increase the safety of people's food, water and environment. FoodCORE centers detect and respond to outbreaks, train professionals, and strengthen systems.
Four FoodCORE model practices have been published to share FoodCORE centers' successes so that others can learn from their experiences. In 2022, FoodCORE centers resumed their revisions to the Laboratory Timeliness and Completeness Model Practice; progress had paused due to the COVID-19 pandemic and reprioritization of staff and resources.
Each year, FoodCORE staff at CDC and in FoodCORE centers share progress and updates at national meetings and conferences; this includes the Council of State and Territorial Epidemiologists (CSTE) conference and the Integrated Foodborne Outbreak Response and Management (InFORM) conference. In 2022, FoodCORE staff attended the in-person CSTE annual conference in Salt Lake City, Utah and the virtual 2022 InFORM conference.
Program performance
Centers report metrics once a year to document changes resulting from targeted FoodCORE resources. Metrics for Salmonella, Shiga toxin-producing Escherichia coli (STEC), and Listeria (SSL) have been collected since late 2010. Metrics for norovirus, other etiologies, and unknown etiology (NOU) investigations have been collected since 2012. The metrics collected by FoodCORE centers are revised as needed to best meet program goals.
Graphs for selected metrics – Year Twelve
The average number of Salmonella and STEC primary isolates/isolate-yielding specimens submitted to or recovered at the public health laboratory (PHL) continued to increase in Year 12; Listeria was consistent with the pre-COVID (Year 9) average.

Related In Year 12, centers conducted 45 SSL and 144 NOUA environmental health assessments as part of investigations where there was a link to a common location of exposures. This represents a 43% increase in NOU investigations conducted in Year 12 than compared to the year before (n=101). The number of SSL environmental health assessments remained the same from Year 11 to Year 12.
In Year 12, it took centers 1 day to attempt an interview and 2 days to complete an interview for confirmed, probable, and suspected SSL cases. This turnaround time (TAT)B is an improvement from Year 11, when centers took 2 days to attempt an interview and 3 days to complete an interview.
The expansion of culture-independent diagnostic tests (CIDTs) without reflex culture in clinical laboratories has placed a greater burden of isolate recovery on public health laboratories (PHLs). Since Year 7, the number of specimens or samples submitted to the PHLs has increased while the mean proportion of STEC, Shigella, and Campylobacter specimens or samples that were isolate-yielding decreased.

In Year 12, centers maintained a high proportion of primary Salmonella, STEC, and Listeria isolates with WGS results: 95%, 90%, and 98%, respectively. The TATB from receipt or recovery at the whole genome sequencing (WGS) laboratory to the sequence being shared with the national database was 6 days, 8 days, and 6 days, respectively.
- Only foodborne and point-source investigations are reported for NOU metrics
- Time in median days
- Baseline (Y0) =Oct 2010 – Mar 2011
- Year 1 (Y1) =Oct 2010 – Sept 2011
- Year 2 (Y2) =Oct 2011 – Dec 2012
- Year 3 (Y3) =Jan 2013 – Dec 2013
- Year 4 (Y4) =Jan 2014 – Dec 2014
- Year 5 (Y5) =Jan 2015 – Dec 2015
- Year 6 (Y6) =Jan 2016 – Dec 2016
- Year 7 (Y7) =Jan 2017 – Dec 2017
- Year 8 (Y8) =Jan 2018 – Dec 2018
- Year 9 (Y9) =Jan 2019 – Dec 2019
- Year 10 (Y10) =Jan 2020 – Dec 2020
- Year 11 (Y11) =Jan 2021 – Dec 2021
- Year 12 (Y12) =Jan 2022 – Dec 2022