What to know
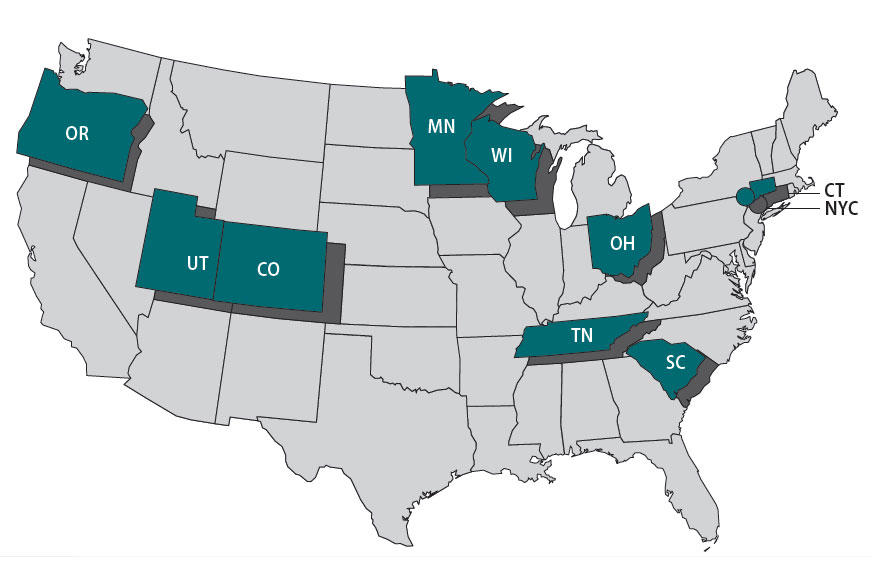
Foodborne Diseases Centers for Outbreak Response Enhancement (FoodCORE) centers address gaps in foodborne disease response through enhanced capacity in laboratory, epidemiology, and environmental health to improve timeliness and completeness of outbreak response activities. The FoodCORE centers during Year Nine (January 1, 2019 – December 31, 2019) were Colorado, Connecticut, Minnesota, New York City, Ohio, Oregon, South Carolina, Tennessee, Utah, and Wisconsin.

Highlights
In 2019, a new cooperative agreement cycle launched to reduce illnesses and deaths caused by infectious diseases. As part of the new cycle, the Foodborne, Waterborne, Enteric, and Environmentally Transmitted Diseases section was restructured. The section includes three tiers covering the prevention and control of disease, disability, and death caused by enteric infections. FoodCORE activities were included under Tier 2 for expanded surveillance, investigation, and response capacity.
FoodCORE success stories document how centers advance public health and increase the safety of people's food, water and environment. FoodCORE centers detect and respond to outbreaks, train professionals, and strengthen systems. In Year Nine, Minnesota, Utah, and Tennessee contributed to a story on foodborne illness complaint systems as a tool for surveillance.
FoodCORE model practices share the successes of FoodCORE centers so that others can learn from their experiences. To date, four model practices have been written, and the model practice on laboratory timeliness and completeness is currently undergoing revision. Revision ensures that model practices remain accurate as methods and technologies advance.
In 2019, whole genome sequencing (WGS) became the standard subtyping method for Escherichia coli, Shigella, and Salmonella following Listeria in 2018. FoodCORE metrics captured this transition and the impact of WGS on the timeliness and completeness of subtyping and outbreak detection. To share these and other activities, FoodCORE staff at CDC and FoodCORE centers presented at meetings and conferences; this included American Public Health Association Annual Meeting, Council of State and Territorial Epidemiologists Annual Conference, and PulseNet/OutbreakNet regional meetings.
Program performance
Centers report metrics twice a year to document changes resulting from targeted FoodCORE resources. Metrics for Salmonella, Shiga toxin-producing Escherichia coli (STEC), and Listeria (SSL) have been collected since late 2010. Metrics for norovirus, other etiologies, and unknown etiology (NOU) investigations have been collected since 2012. The metrics collected by FoodCORE centers are revised as needed to best meet program goals.
Graphs for selected metrics – Year Nine
Since Year 6, FoodCORE centers have increased the proportion of Salmonella, STEC, and Listeria primary isolates with WGS results.
To evaluate the timeliness and completeness of WGS, FoodCORE centers pilot-tested a set of expanded SSL metrics in Year 6. Centers reported on the expanded metrics in Year 6 and in following years.

In Year 9, centers conducted 64 SSL and 194 NOU environmental health assessments as part of investigations where there was a link to a common location of exposures. Environmental health assessments provide information needed to recommend effective short and long-term interventions that stop ongoing foodborne outbreaks and prevent them in the future.
From Year 8 to Year 9, FoodCORE centers decreased the timeA from receipt (or recovery) at WGS laboratory to sequence being shared with national database.

In Year 9, the timeA to attempt and complete interviews for Salmonella, STEC, and Listeria was under 2 days and 4 days, respectively.

The average proportion of Salmonella, STEC, and Listeria confirmed cases with an attempted interview with exposure history obtained was 84%, 90%, and 87%, respectively.
Summary
- Time in median days
- Baseline (Y0) =Oct 2010 – Mar 2011
- Year 1 (Y1) =Oct 2010 – Sept 2011
- Year 2 (Y2) =Oct 2011 – Dec 2012
- Year 3 (Y3) =Jan 2013 – Dec 2013
- Year 4 (Y4) =Jan 2014 – Dec 2014
- Year 5 (Y5) =Jan 2015 – Dec 2015
- Year 6 (Y6) =Jan 2016 – Dec 2016
- Year 7 (Y7) =Jan 2017 – Dec 2017
- Year 8 (Y8) =Jan 2018 – Dec 2018
- Year 9 (Y9) =Jan 2019 – Dec 2019
- Only foodborne and point-source investigations are reported for NOU metrics.
