What to know
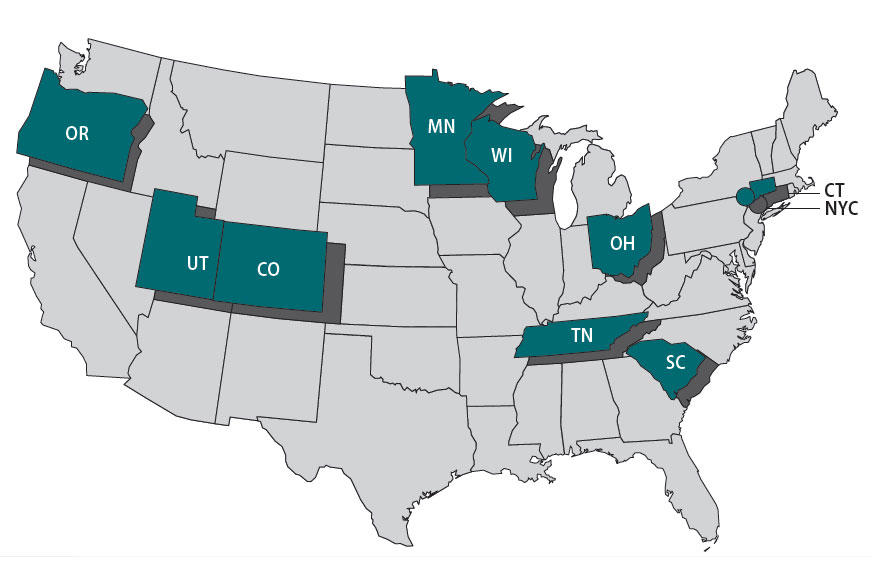
The Foodborne Diseases Centers for Outbreak Response Enhancement (FoodCORE) program addresses gaps in foodborne disease response through enhanced capacity in laboratory, epidemiology, and environmental health to improve timeliness and completeness of outbreak response activities. The FoodCORE centers during Year 11 (January 1, 2021–December 31, 2021) were Colorado, Connecticut, Minnesota, New York City, Ohio, Oregon, South Carolina, Tennessee, Utah, and Wisconsin.
Highlights
In 2021, public health agencies continued their fight against the ongoing COVID-19 pandemic. While they slowly transitioned back to their regular duties, FoodCORE centers still had limited epidemiology, laboratory, and environmental staff. This limited their capacity to investigate foodborne and enteric outbreaks and conduct routine surveillance. Staff often supported enteric disease and pandemic response work concurrently. FoodCORE centers continued to identify innovative solutions, leverage their enhanced capacity, and adapt their workflows to maintain enteric work.
FoodCORE student teams provided significant support to health departments that had limited capacity to conduct enteric disease investigations. Compared with 2020, the volume of enteric disease cases increased in 2021. As enteric caseloads returned to pre-pandemic levels, students provided the capacity for case follow-up, data entry, surveillance activities, and investigations.
During the pandemic, FoodCORE centers revised their investigation protocols and systems to improve efficiency and function in a remote work environment. By 2021, centers adopted practices that were beneficial in improving data quality and efficiency in surveillance activities. For example, more centers transitioned their paper interview forms to Research Electronic Data Capture (REDCap). REDCap is a free, secure web application for surveys and databases that helped streamline workflows and reduce reporting burden on staff.
Some FoodCORE activities remained paused during 2021, including the revision of model practices. To date, four FoodCORE model practices have been published so that others can learn from FooCORE centers' experiences.
Despite the strain of the COVID-19 pandemic, FoodCORE centers and OutbreakNet Enhanced sites were able to maintain some enteric disease work. They leveraged their existing resources to maximize support for enteric disease investigations while simultaneously responding to the COVID-19 pandemic. This was documented as a success story.
Each year, FoodCORE staff at CDC and in FoodCORE centers share progress and updates at national meetings and conferences. In 2021, many meetings and conferences that were held virtually. This included the Council of State and Territorial Epidemiologists (CSTE) conference and Integrated Foodborne Outbreak Response and Management (InFORM) regional meetings.
Program performance
Centers report metrics once a year to document changes resulting from targeted FoodCORE resources. Metrics for Salmonella, Shiga toxin-producing Escherichia coli (STEC), and Listeria (SSL) have been collected since late 2010. Metrics for norovirus, other etiologies, and unknown etiology (NOU) investigations have been collected since 2012. The metrics collected by FoodCORE centers are revised as needed to best meet program goals.
While FoodCORE centers maintained most of their core activities in 2021, some metrics capture the impacts of COVID-19 on enteric disease.
Graphs for selected metrics - Year Eleven
After a decrease from Year 9 to Year 10, the average number of Salmonella, STEC, and Listeria primary isolates/isolate-yielding specimens submitted to or recovered at public health labs increased from Year 10 to Year 11.

The average number of laboratory-confirmed cases reported to epidemiology staff increased from Year 10 to Year 11. In Year 10, each center reported an average of 825 SSL cases (679, 131, and 15 cases for Salmonella, STEC, and Listeria, respectively) compared to an average of 902 SSL cases (712, 169, and 21 cases for Salmonella, STEC, and Listeria, respectively) in Year 11.
In Year 11, it took centers 2 days to attempt an interview and 3 days to complete an interview for confirmed, probable, and suspected SSL cases. This turnaround time (TAT)A is comparable to that for Year 10.
Since Year 6, centers have reduced the TATA from receipt or recovery at the whole genome sequencing (WGS) laboratory to the sequence being shared with the national database. TAT slightly increased in Year 11 as centers had limited staff capacity available for enteric sequencing.

In Year 11, centers conducted 45 SSL and 101 NOU Benvironmental health assessments as part of investigations where there was a link to a common location of exposures. Environmental health assessments provide information needed to recommend effective short- and long-term interventions that stop ongoing foodborne outbreaks and prevent them in the future.
In Year 11, centers maintained a high proportion of primary Salmonella, STEC, and Listeria isolates with WGS results: 97%, 94%, and 98%, respectively.
From Year 10 to Year 11, the average proportion of confirmed Salmonella, STEC, and Listeria cases reported to epidemiology staff with WGS information increased.

Summary
- Time in median days
- Only foodborne and point-source investigations are reported for NOU metrics.
- Baseline (Y0) =Oct 2010 – Mar 2011
- Year 1 (Y1) =Oct 2010 – Sept 2011
- Year 2 (Y2) =Oct 2011 – Dec 2012
- Year 3 (Y3) =Jan 2013 – Dec 2013
- Year 4 (Y4) =Jan 2014 – Dec 2014
- Year 5 (Y5) =Jan 2015 – Dec 2015
- Year 6 (Y6) =Jan 2016 – Dec 2016
- Year 7 (Y7) =Jan 2017 – Dec 2017
- Year 8 (Y8) =Jan 2018 – Dec 2018
- Year 9 (Y9) =Jan 2019 – Dec 2019
- Year 10 (Y10) =Jan 2020 – Dec 2020
- Year 11 (Y11) =Jan 2021 – Dec 2021