What to know
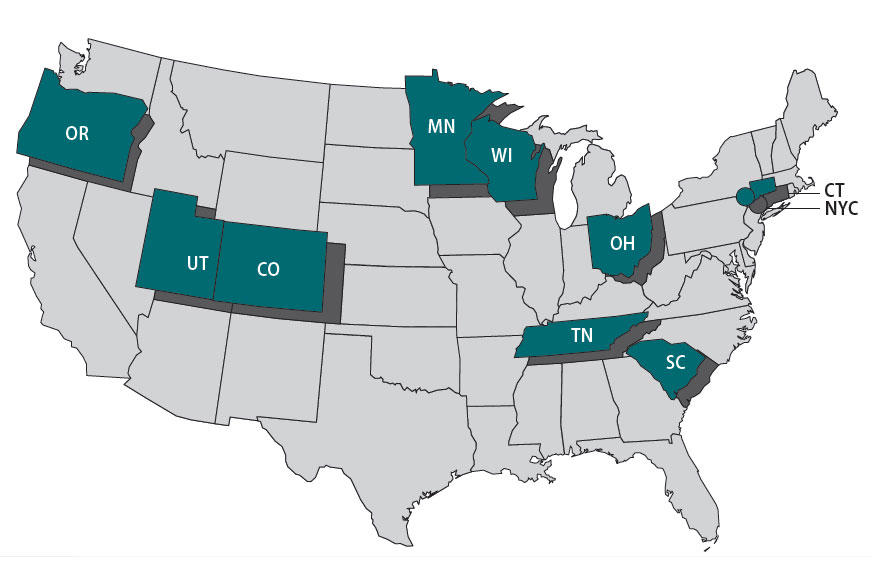
Foodborne Diseases Centers for Outbreak Response Enhancement (FoodCORE) centers address gaps in foodborne disease response through enhanced capacity in laboratory, epidemiology, and environmental health to improve timeliness and completeness of outbreak response activities. The FoodCORE centers during Year Eight (January 1, 2018 – December 31, 2018) were Colorado, Connecticut, Minnesota, New York City, Ohio, Oregon, South Carolina, Tennessee, Utah, and Wisconsin.
Highlights
In Year Eight, the FoodCORE centers revised the Initial Case-patient Interviewing Model Practice. This model practice, originally written in 2014, describes methods used to gather detailed exposure histories from case-patients. Since 2014, new investigation methods have emerged. The update expanded the section on reaching case-patients to include texting and online questionnaires. Using the methods in the model practice, FoodCORE centers attempt interviews with nearly all case-patients and fewer are lost to follow.
Though they primarily focus on foodborne outbreaks, FoodCORE centers' enhanced capacity has aided in responses to outbreaks related to other sources. One success story highlighted two zoonotic outbreaks – a turtle-associated outbreak in Ohio and a goat-associated outbreak in Connecticut. Another success story highlighted Colorado, New York City, Ohio, and Utah all supporting non-foodborne outbreaks. They investigated outbreaks spread by animals, sexual contact, and throughout a community that included individuals experiencing homelessness.
In January 2018, whole genome sequencing (WGS) became the standard subtyping method for Listeria. FoodCORE centers prepared for the transition and sequenced 100% of their Listeria isolates in 2018. In 2019, WGS will become the standard subtyping method for Escherichia coli, Shigella, and Salmonella. FoodCORE metrics will measure this transition and its impact on laboratory timeliness and completeness as well as cluster and outbreak detection.
To share these successes, FoodCORE staff at CDC and FoodCORE centers presented at several meetings and conferences. This included the International Conference on Emerging Infectious Diseases (ICEID) and the Council for State and Territorial Epidemiologists (CSTE) Annual Conference.
Program performance
Centers report metrics twice a year to document changes resulting from targeted FoodCORE resources. Metrics for Salmonella, Shiga toxin-producing Escherichia coli (STEC), and Listeria (SSL) have been collected since late 2010. Metrics for norovirus, other etiologies, and unknown etiology (NOU) investigations have been collected since 2012. The metrics collected by FoodCORE centers are revised as needed to best meet program goals. See below for figures and graphs for selected metrics.
Graphs for selected metrics – Year Eight
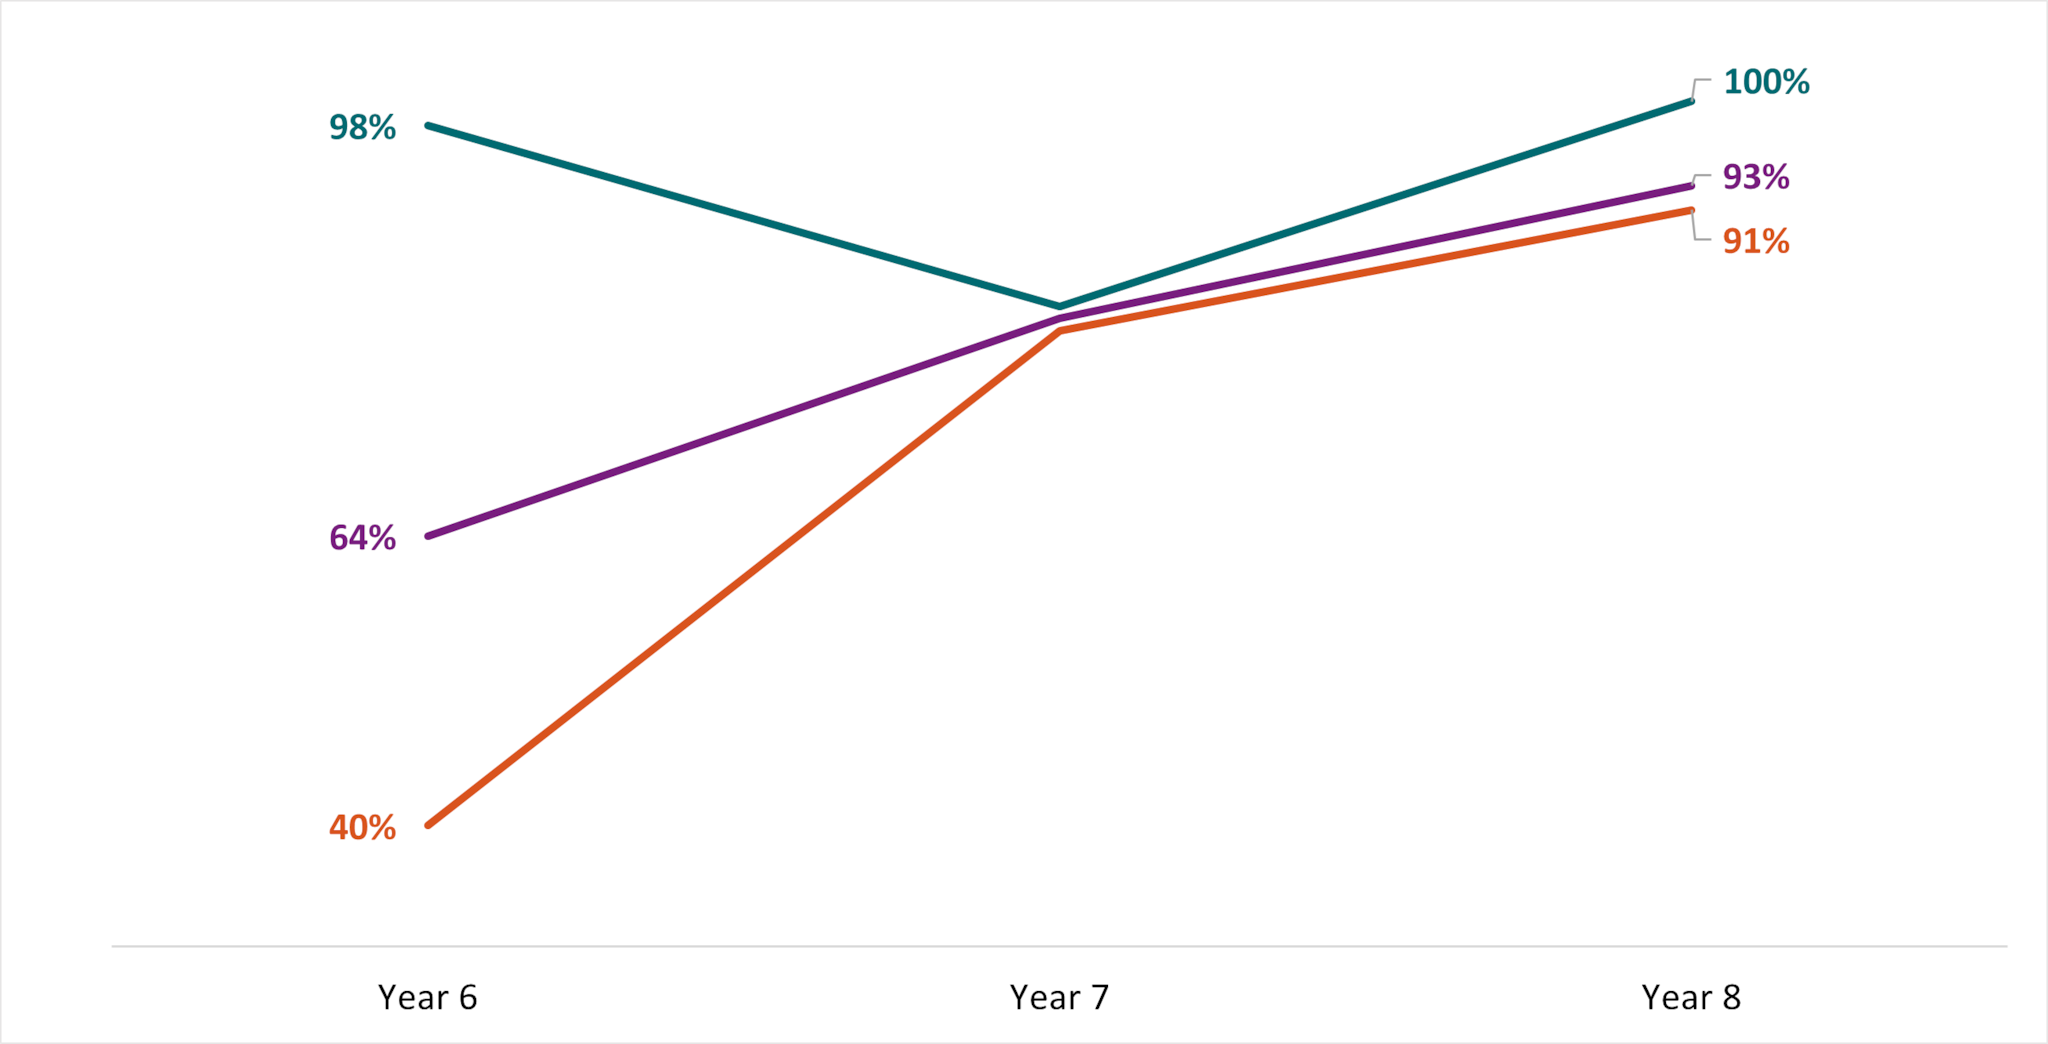
Since Year 6, FoodCORE centers have increased the proportion of Salmonella, STEC, and Listeria primary isolates with WGS results.
To evaluate the timeliness and completeness of WGS, FoodCORE centers pilot-tested a set of expanded SSL metrics in Year 6. Centers reported on the expanded metrics in Year 6 and in following years.
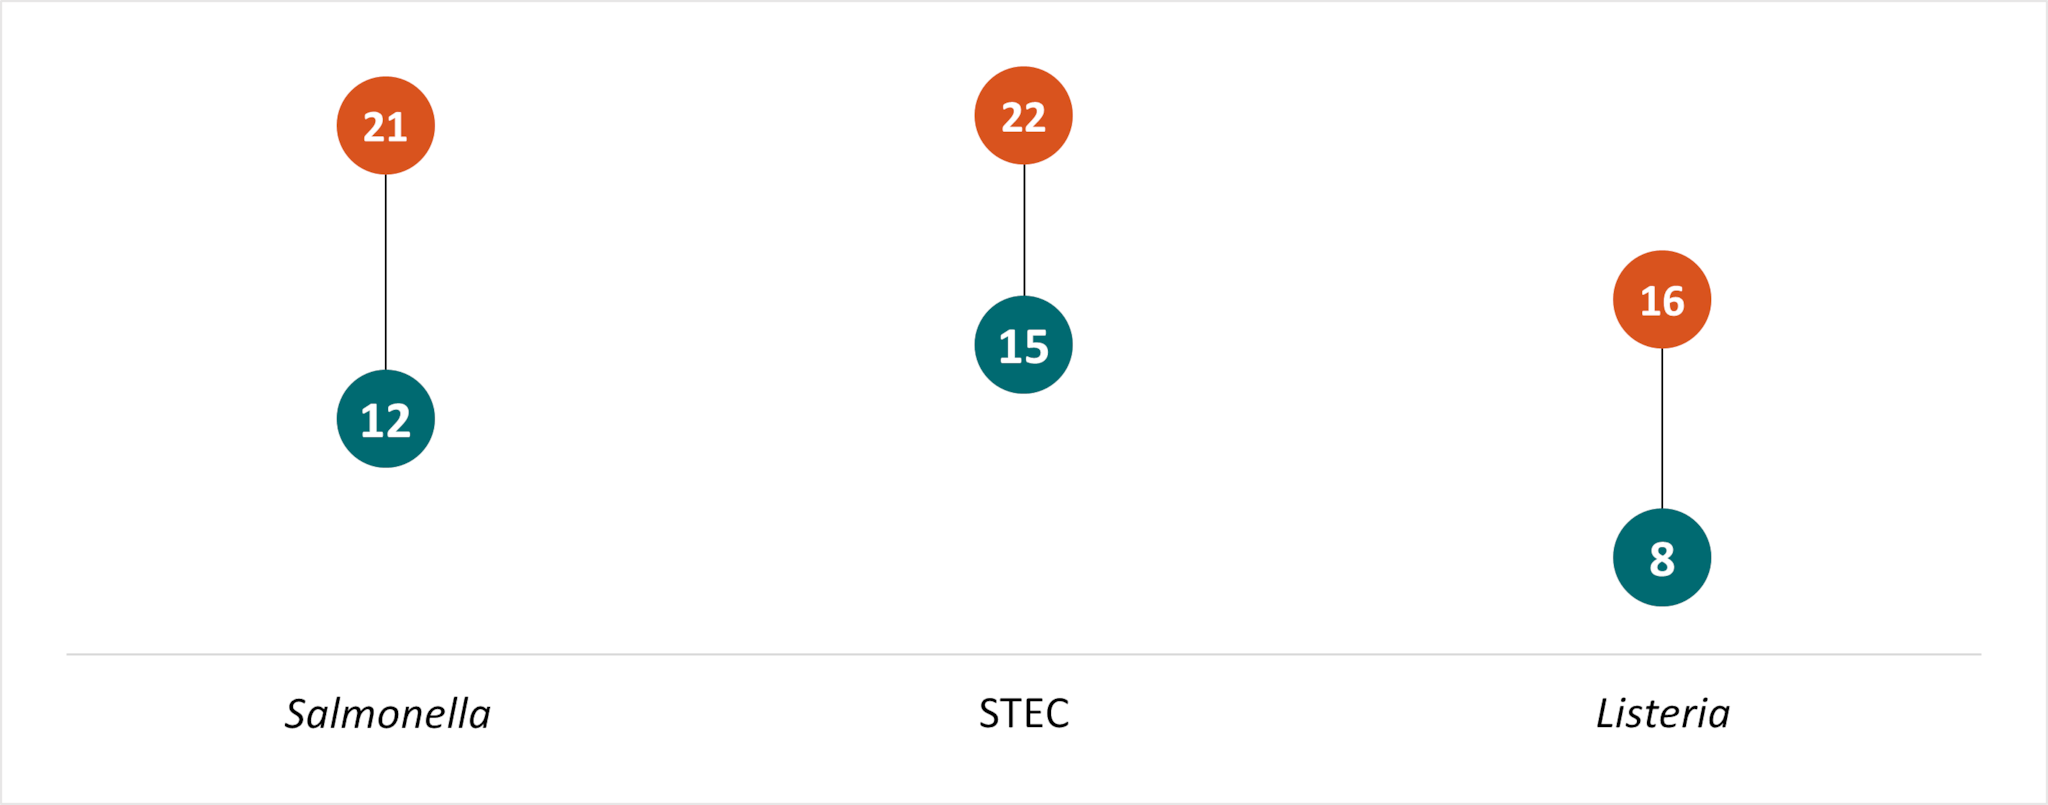
From Year 7 to Year 8, FoodCORE centers reduced the timeA from Salmonella, STEC, and Listeria isolate receipt (or recovery) at the public health lab to WGS sequence being shared with the national database.
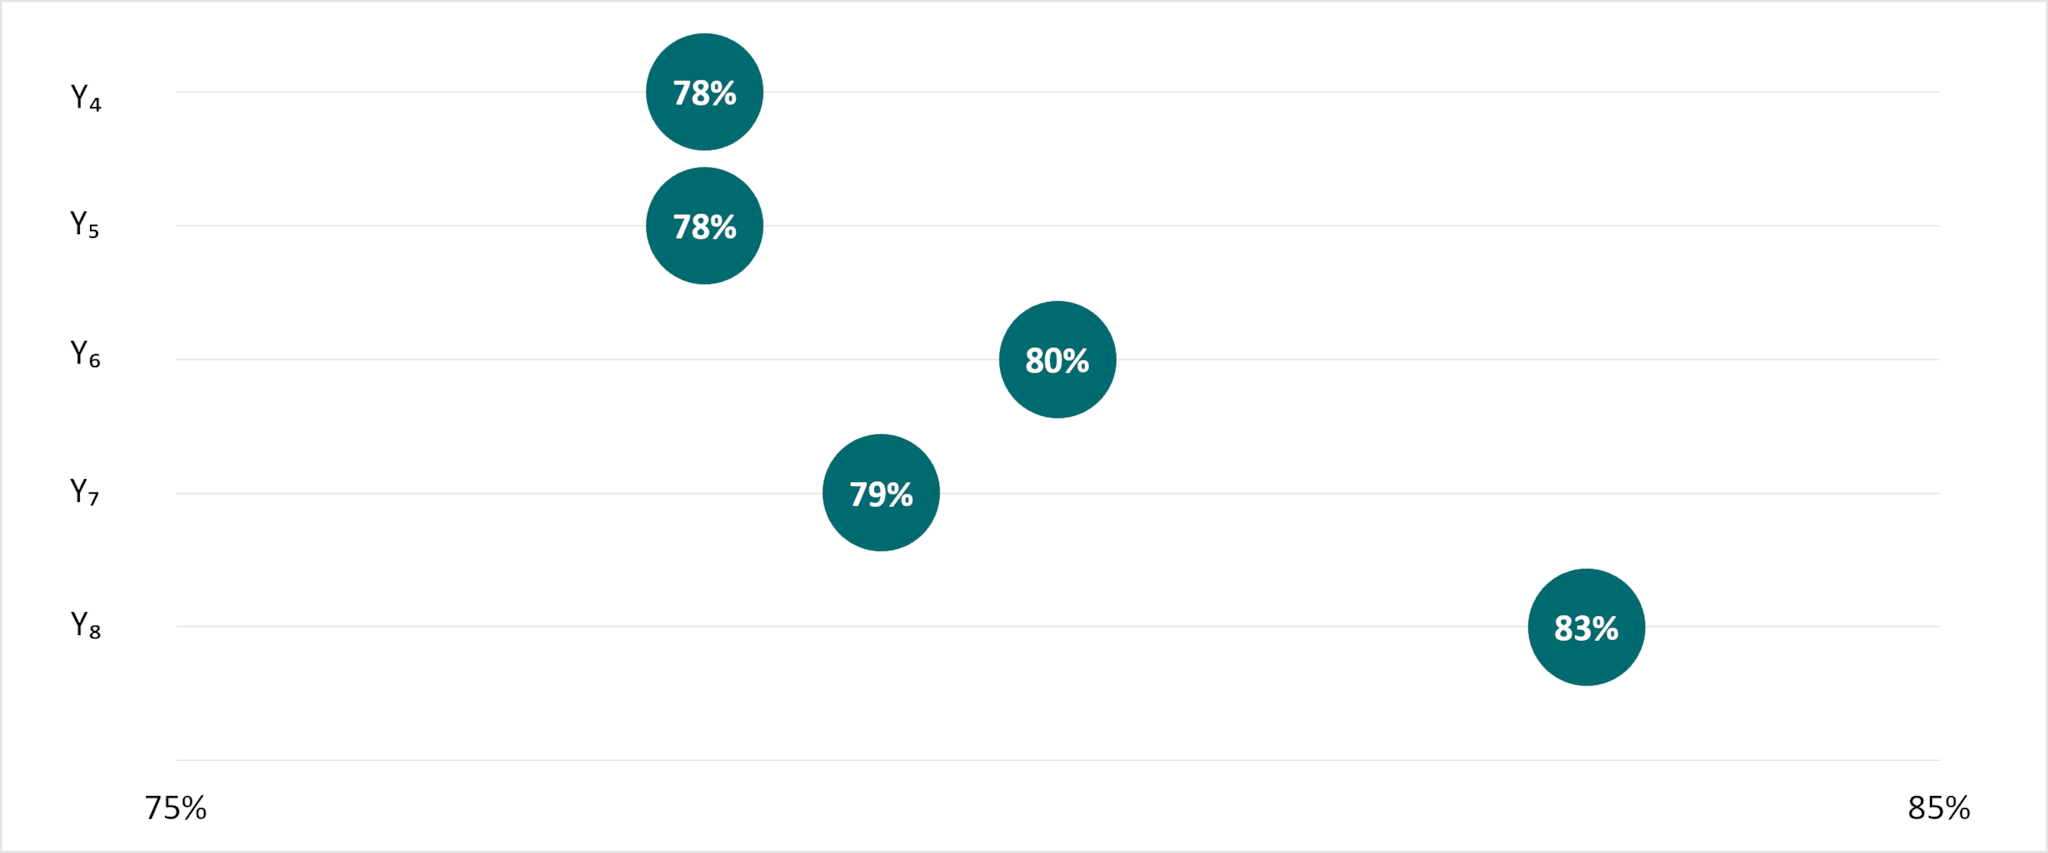
FoodCORE centers contacted a greater proportion of environmental health, agriculture, regulatory, consumer protection, or food safety program staff for foodborne or point-source investigations in Year 8 than in previous years.
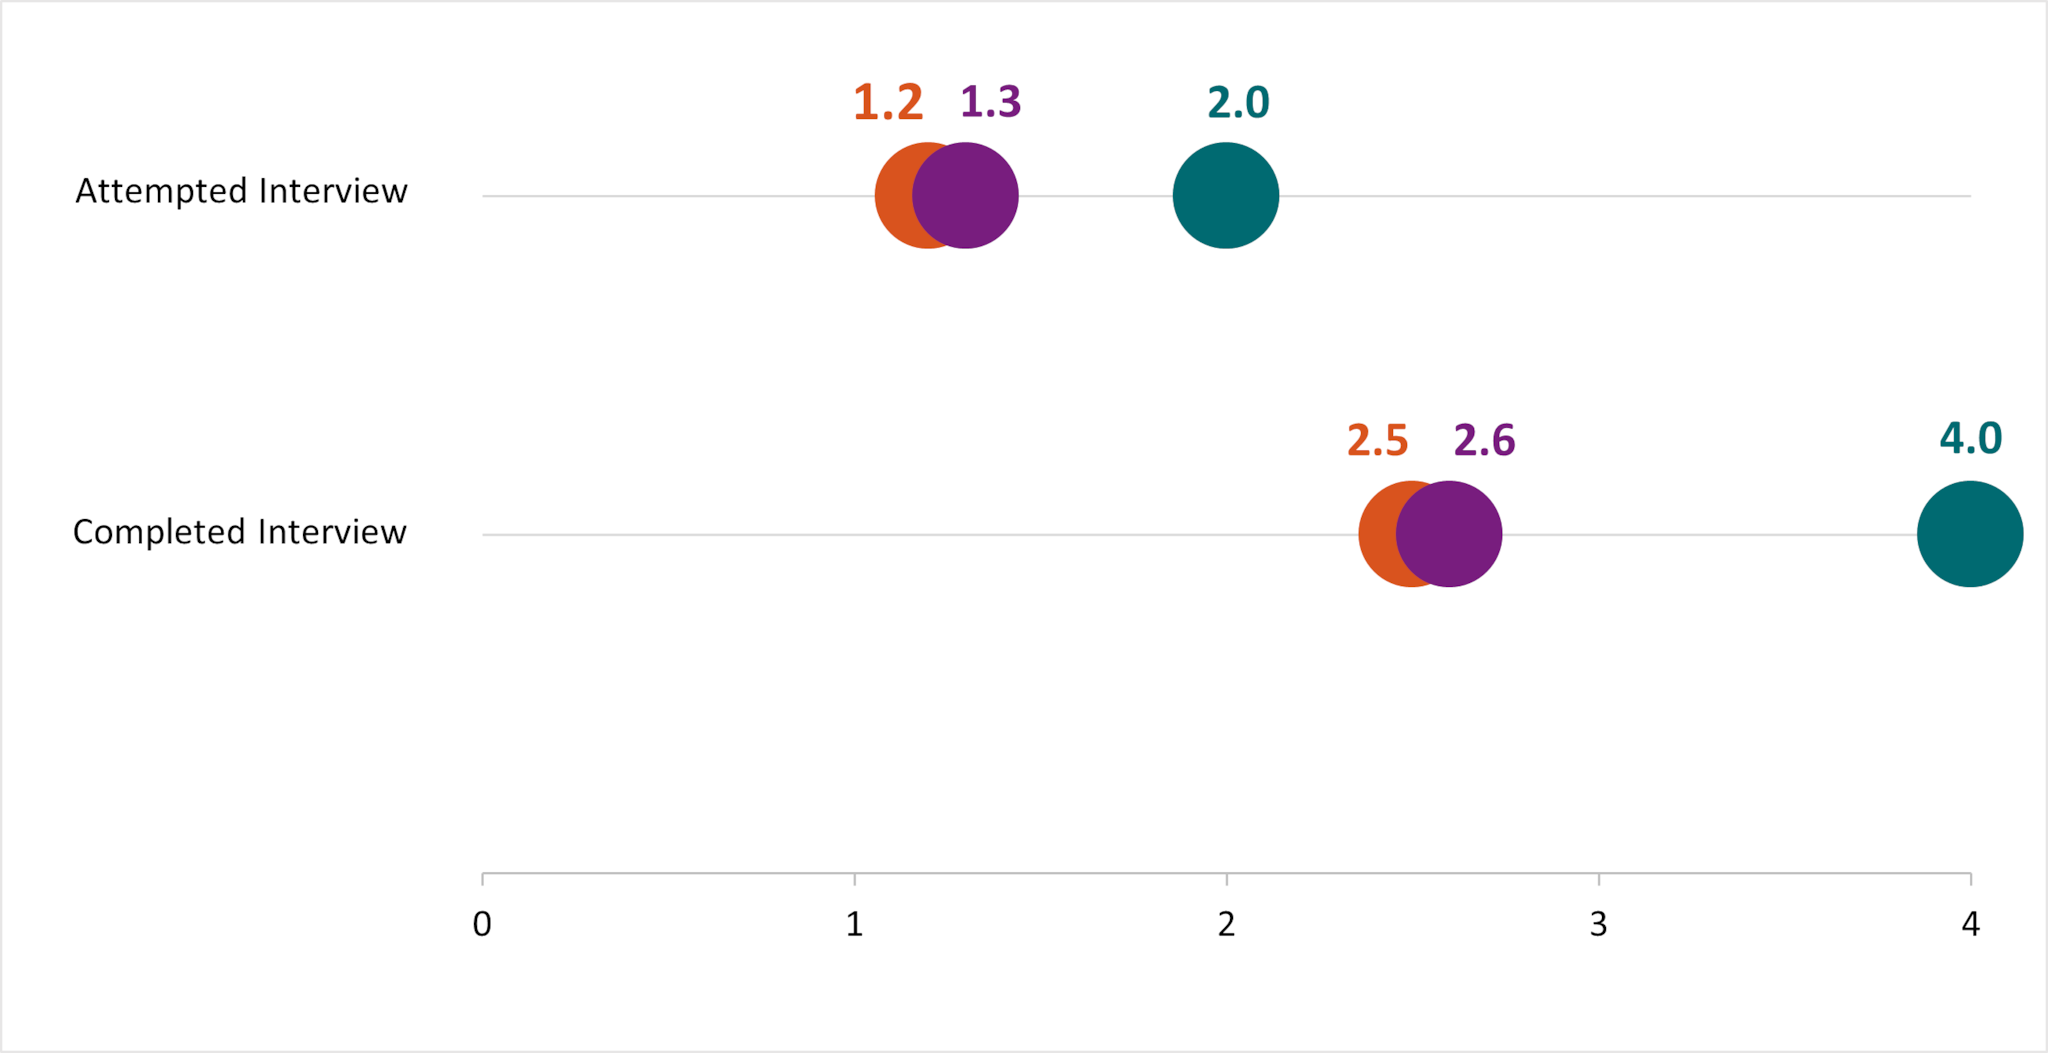
In Year 8, the timeA to attempt and complete interviews for Salmonella, STEC, and Listeria was under 2 days and 4 days, respectively.
Summary
- Time in median days.
- Baseline (Y0) =Oct 2010 – Mar 2011
- Year 1 (Y1) =Oct 2010 – Sept 2011
- Year 2 (Y2) =Oct 2011 – Dec 2012
- Year 3 (Y3) =Jan 2013 – Dec 2013
- Year 4 (Y4) =Jan 2014 – Dec 2014
- Year 5 (Y5) =Jan 2015 – Dec 2015
- Year 6 (Y6) =Jan 2016 – Dec 2016
- Year 7 (Y7) =Jan 2017 – Dec 2017
- Year 8 (Y8) =Jan 2018 – Dec 2018