At a glance
- This spotlight was published on September 27, 2024.
- CDC analyzes data on influenza viruses and associated morbidity and mortality each influenza (flu) season.
- This data helps identify the vaccine viruses to be included in the new annual Northern Hemisphere flu vaccines.
- The Food and Drug Administration's Vaccines and Related Biological Products Advisory Committee reviewed and evaluated the data on the 2023–2024 flu season and the performance of the 2023-2024 flu vaccines to determine the composition of the 2024–2025 U.S. flu vaccines.
Executive Summary
The Centers for Disease Control and Prevention (CDC) collects, compiles, and analyzes data on influenza viruses and associated morbidity and mortality in the United States. Influenza activity in the United States during the 2023–2024 season (October 1, 2023 – August 31, 2024) was moderately severe and within the range seen during pre-COVID-19 seasons for both timing and intensity of activity. During the 2023–2024 season, influenza activity began to increase in early November and peaked in late December 2023. Activity declined for a few weeks in January 2024 and then remained relatively stable at elevated levels through February 2024 before declining to inter-seasonal levels in May 2024. Influenza A(H1N1)pdm09 was the predominant virus circulating during the 2023–2024 season. However, influenza A(H3N2) and influenza B/Victoria viruses were identified more frequently than A(H1N1)pdm09 viruses later in the season as overall influenza activity began to decrease. This is the third season in a row without influenza B/Yamagata viruses in circulation.
This report summarizes influenza activity in the United States during the 2023–2024 season (October 1, 2023 – August 31, 2024) as reported to CDC through its collaborative efforts with clinical and public health laboratories, outpatient providers, emergency departments, hospitals, vital statistics offices, and public health departments. It also includes the composition of the Northern Hemisphere 2024–2025 influenza vaccines and a brief update on influenza activity occurring during the summer of 2024 in the Southern Hemisphere.
Virus Surveillance
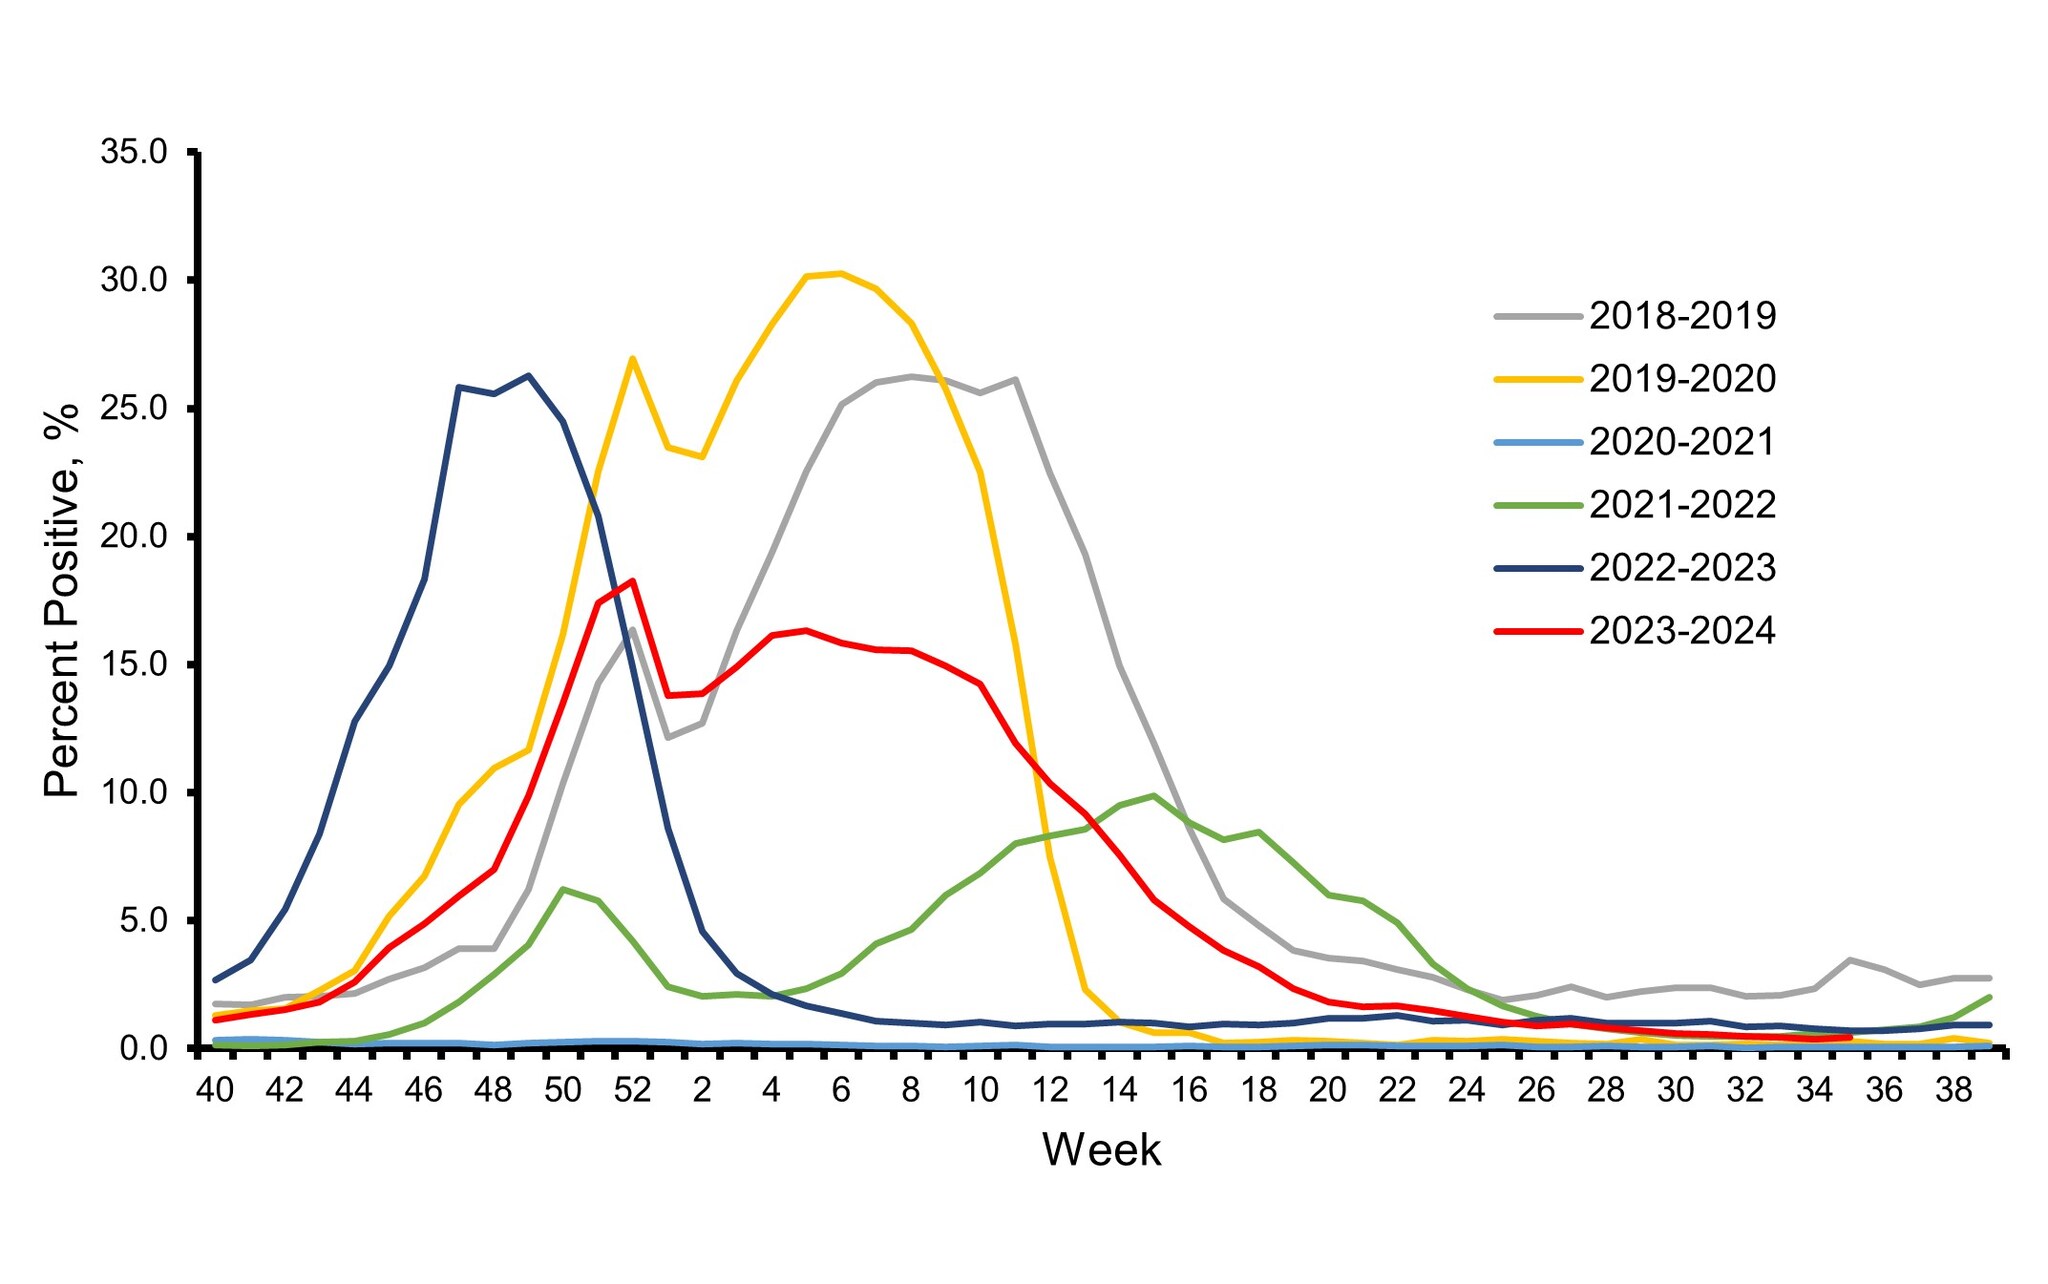
The influenza virologic surveillance system is comprised of the U.S. World Health Organization (WHO) collaborating laboratories and National Respiratory and Enteric Virus Surveillance System (NREVSS) laboratories, which include both clinical and public health laboratories throughout the United States. Clinical laboratories primarily test for diagnostic purposes and their data are used to understand timing and intensity of influenza activity, while public health laboratories primarily test specimens for influenza for surveillance purposes to understand what influenza virus subtypes and lineages are circulating and the ages of people that are infected 1. During the 2023–2024 influenza season, clinical laboratories reporting to CDC tested 3,910,204 respiratory specimens for influenza viruses using clinical diagnostic tests. Among these, 351,460 (9.0%) specimens tested positive, including 243,048 (69.2%) for influenza A and 108,401 (30.8%) for influenza B viruses. The overall percentage of specimens testing positive for influenza nationally each week ranged from 0.4% to 18.3% and peaked during the week ending December 30, 2023 (week 52) before declining slightly and remaining relatively stable at elevated levels through February 2024 (Figure 1). The timing of peak activity for influenza A and influenza B varied (late December and late February, respectively) which contributed to the sustained period of elevated activity overall.
Based on the percentage of specimens testing positive in clinical laboratories, peak influenza activity in the 10 Health and Human Services (HHS) regions occurred between mid-December 2023 and late February 2024: HHS Regions 9 and 10 (West Coast and Pacific Northwest) peaked in mid-December; Regions 2, 3, 4, and 8 (New York/New Jersey/Puerto Rico, Mid-Atlantic, Southeast, and Mountain) peaked in late December; Region 6 (South Central) peaked late in January; Region 1 (New England) peaked in early February; and Regions 5 and 7 (Midwest and Central) peaked late in February.
Figure 1. Influenza Positive Test Results Reported by Clinical Laboratories to CDC, National Summary by MMWR week and Influenza Season — United States, 2018–2019 to 2023–2024 Seasons
Public health laboratories tested 129,638 specimens and reported 39,885 influenza positive specimens, with 30,689 (76.9%) positive for influenza A and 9,196 (23.1%) positive for influenza B viruses. Among 25,906 seasonal influenza A viruses that were subtyped, 16,875 (65.1%) were influenza A(H1N1)pdm09 viruses, and 9,031 (34.9%) were influenza A(H3N2) viruses. Influenza B lineage information was available for 8,010 (87.1%) influenza B viruses, with all of them belonging to the Victoria lineage (Figure 2). No influenza B/Yamagata lineage viruses have been identified worldwide since March 2020.
Figure 2. Influenza Positive Tests Reported to CDC by U.S. Public Health Laboratories*, National Summary, 2023–2024 Season
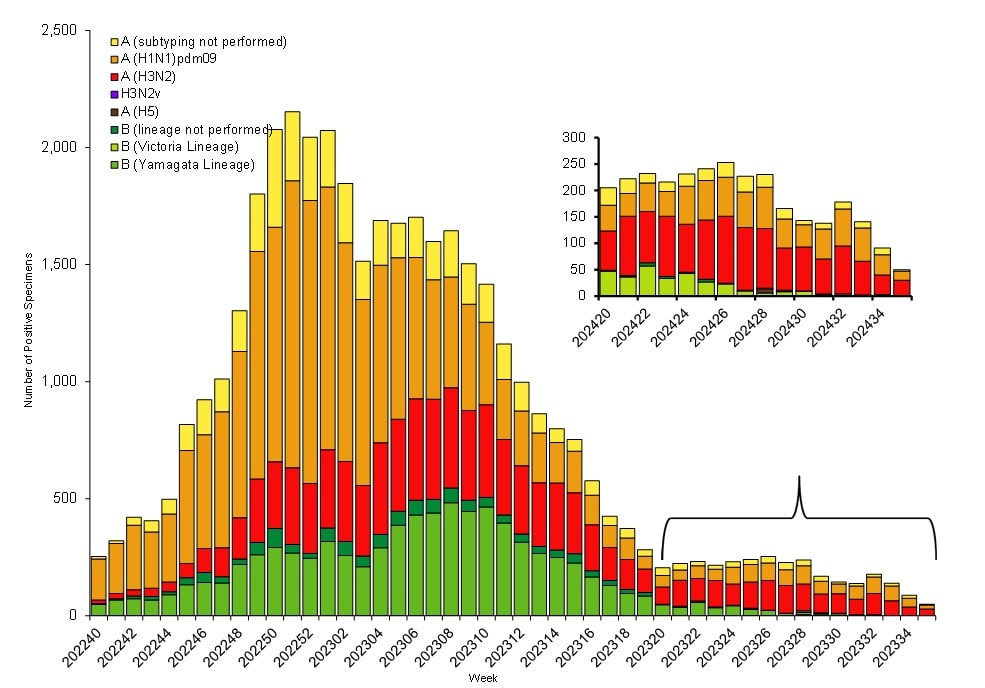
*This graph reflects the number of specimens tested and the number determined to be positive for influenza viruses at the public health lab (specimens tested is not the same as cases). It does not reflect specimens tested only at CDC and could include more than one specimen tested per person. Specimens tested as part of routine influenza surveillance as well as those tested as part of targeted testing for people exposed to influenza A(H5) are included. The guidance for influenza A/H5 testing recommends testing both a conjunctival and respiratory swab for people with conjunctivitis which has resulted in more specimens testing positive for influenza A/H5 than the number of human H5 cases. For more information on the number of people infected with A/H5, please visit the "How CDC is monitoring influenza data among people to better understand the current avian influenza A (H5N1) situation"
Nationally, influenza A(H1N1)pdm09 was the predominant virus during the 2023–2024 influenza season as a whole and for each week from early November 2023 through the end of February 2024. Influenza A(H3N2) and influenza B/Victoria viruses co-circulated at lower levels during that time. However, as overall influenza activity decreased, A(H3N2) or B viruses were identified more frequently than A(H1N1)pdm09 viruses. The co-circulation of these strains likely contributed to extending the duration of the season, with A(H3N2) and B viruses increasing as A(H1N1)pdm09 viruses decreased and A(H3N2) viruses taking over as the predominant virus in early April 2024 (Figure 2). On a regional level, influenza A(H1N1)pdm09 viruses were predominant during the season as a whole in all 10 HHS regions; however, the extent and timing of A(H3N2) and B viruses varied by region. For additional regional level data, please visit FluView Interactive.
Among the influenza A viruses that were subtyped, influenza A(H1N1)pdm09 viruses were the most common virus among all age groups comprising 68.8% of influenza A(H1N1)pdm09 viruses identified in persons aged 0–4 years, 63.8% in 5–24 years, 66.0% in 25–64 years, and 63.6% in those aged 65 years or older. However, the second most frequently identified virus varied by age group: influenza B in those 0–4 and 5–24 years old, influenza A(H3N2) in those 65 years and older and approximately equal proportions of influenza B and A(H3N2) viruses in those 25–64 years.
Virus Characterization & Antiviral Susceptibility
Genetic characterization of the viruses circulating during this time period was conducted using next generation sequencing, and the genomic data were analyzed and submitted to publicly accessible databases (GenBank: GenBank Overview and EpiFlu: Recommended composition of influenza virus vaccines for use in the 2025 Southern Hemisphere Influenza Season announced). Phylogenies of representative subsets of genetic data from CDC and other submitters can be visualized in real time at Nextstrain.
To evaluate whether genetic changes in the hemagglutinin (HA) of circulating viruses affected antigenicity, antigenic characterizations were conducted using hemagglutination inhibition (HI) assays (A(H1N1)pdm09, H3N2 and B viruses) or High-content Imaging-based micro-Neutralization Test (HINT) (A(H3N2) viruses) and post-infection ferret antisera raised to reference viruses representing the 2023–2024 Northern Hemisphere vaccine viruses. Both assays determine how well antibodies raised to the influenza vaccine reference viruses recognize or bind to circulating viruses. HI assay measures how well antibodies inhibit the binding between the HA of the virus and the sialic acid receptors on the surface of red blood cells, whereas HINT measures how well antibodies neutralize or block virus infection of a cell.
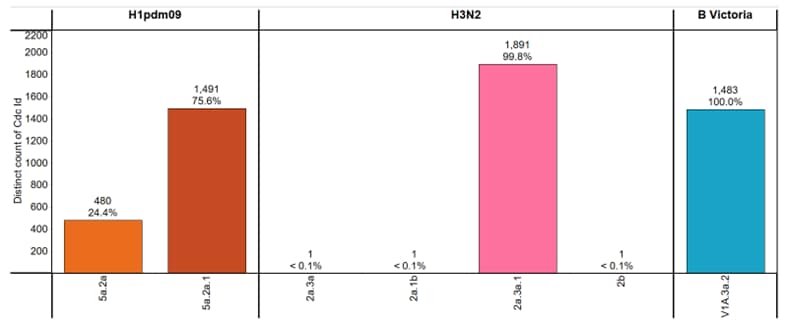
CDC genetically characterized 5,348 viruses (3,865 influenza A and 1,483 influenza B) collected in the United States during October 1, 2023 – August 31, 2024, and antigenically characterized viruses representing various genetic clades. Overall, the vaccine antigens for each of the three major groups of the influenza viruses circulating in people (i.e., A(H1N1)pdm09, A(H3N2), and B/Victoria) elicited antibodies that reacted well with most of the co-circulating viruses during this period (Figure 3). Detailed characterization data for each group are bellow.
Influenza A(H1N1)pdm09
Phylogenetic analysis of the HA demonstrated that all viruses tested belonged to the 6B.1A.5a lineage and were classified in 2 clades. Clade 5a.2a represented 24.4% (n=480), and 75.6% (n=1,491) were clade 5a.2a.1. The A(H1N1)pdm09 component for the 2023–2024 Northern Hemisphere influenza vaccines contain HA genes from clade 5a.2a.1. Nearly all (99.8%, n=573) of the A(H1N1)pdm09 viruses antigenically characterized were well recognized (reacting at titers that were within 8-fold of the homologous virus titer by HI) by ferret antisera to cell-grown A/Wisconsin/67/2022-like reference viruses which represent the A(H1N1)pdm09 component for the cell- and recombinant-based influenza vaccines.
Influenza A(H3N2)
All 1,894 genetically characterized A(H3N2) viruses belonged to subclades of the 3C.2a1b.2a clade, with the majority (99.8%, n=1,891) belonging to the 2a.3a.1 subclade. The A(H3N2) component for the 2023–2024 Northern Hemisphere influenza vaccines contain HA genes from the 3C.2a1b.2a clade. Antigenic analysis showed that 629 (95.0%) were well-recognized (reacting at titers that were within 8-fold of the homologous virus titer by HI or HINT by ferret antisera to cell-grown A/Darwin/6/2021-like reference viruses that represent the A(H3N2) component for the cell- and recombinant-based influenza vaccines.
Influenza B
All influenza B viruses for which characterization was possible belonged to the B/Victoria-lineage. Infections with B/Yamagata viruses have not been identified globally since March of 2020. Phylogenetic analysis of the HA genes showed that all (n=1,483) belonged to clade V1A.3a.2. The genetic clade of the B/Victoria-lineage component for the 2023–2024 Northern Hemisphere influenza vaccines is this V1A.3a.2 clade.
Figure 3. Genetic Clades of HA genes Based on Phylogenic Analysis of Influenza Viruses Collected Since October 1, 2023
CDC also assesses susceptibility of influenza viruses to antiviral medications. Between October 1, 2023, and August 31, 2024, a total of 5,163 viruses collected in the United States were characterized for susceptibility to neuraminidase (NA) inhibitors using sequence-based analysis, and a subset of 478 viruses (9.3%) were tested using a functional assay. Based on sequence analysis, all viruses, except 10, lacked known or suspected mutations associated with reduced inhibition by the neuraminidase inhibitors. Of these 10 viruses, 5 A(H1N1)pdm09 viruses contained an NA-H275Y amino acid substitution and 1 A(H1N1)pdm09 virus had a combination of NA substitutions I223V + S247N. The remaining 4 viruses were from B/Victoria lineage; two of them had a new substitution NA-A245G; one had NA-D197N; and 1 virus had NA-H273Y substitution. All viruses lacking NA mutations displayed normal inhibition by the neuraminidase inhibitors. As expected, A(H1N1)pdm09 viruses containing NA-H275Y showed highly reduced inhibition by oseltamivir and peramivir. One A(H1N1)pdm09 virus with substitutions I223V + S247N showed reduced inhibition by oseltamivir. Two B/Victoria viruses with NA-A245G showed reduced inhibition by peramivir. One B/Victoria virus with NA-D197N showed reduced inhibition by peramivir and zanamivir, while another B/Victoria virus with NA-H273Y showed highly reduced inhibition by peramivir.
A total of 5,069 viruses were characterized for susceptibility to the polymerase acidic (PA) cap-dependent endonuclease inhibitor baloxavir using sequence-based analysis, and a subset of 585 viruses (11.5%) were tested phenotypically. All tested viruses were susceptible to baloxavir, except 1 A(H3N2) virus with a PA-I38T amino acid substitution, which showed reduced susceptibility to baloxavir.
Table 1. Assessment of Virus Susceptibility to Antiviral Medications, Viruses Collected in the U.S. October 1, 2023 – August 31, 2024
| Antiviral Medication | Total Viruses | A/H1 | A/H3 | B/Victoria | ||
|---|---|---|---|---|---|---|
| Neuraminidase Inhibitors | Oseltamivir | Viruses Tested | 5163 | 1906 | 1812 | 1445 |
| Reduced Inhibition | 1 (0.02%) | 1 (0.1%) | 0 | 0 | ||
| Highly Reduced Inhibition | 5 (0.1%) | 5 (0.3%) | 0 | 0 | ||
| Peramivir | Viruses Tested | 5163 | 1906 | 1812 | 1445 | |
| Reduced Inhibition | 3 (0.1%) | 0 | 0 | 3 (0.2%) | ||
| Highly Reduced Inhibition | 6 (0.1%) | 5 (0.3%) | 0 | 1 (0.1%) | ||
| Zanamivir | Viruses Tested | 5163 | 1906 | 1812 | 1445 | |
| Reduced Inhibition | 1 (0.02%) | 0 | 0 | 1 (0.1%) | ||
| Highly Reduced Inhibition | 0 | 0 | 0 | 0 | ||
| PA Cap-Dependent Endonuclease Inhibitor | Baloxavir | Viruses Tested | 5069 | 1846 | 1790 | 1433 |
| Decreased Susceptibility | 1 (0.02%) | 0 | 1 (0.1%) | 0 | ||
Vaccine Strain Selection 2024–2025
Viruses to be included in the 2024–2025 Northern Hemisphere influenza vaccines were recommended at the World Health Organization's (WHO) Consultation on the Composition of the Influenza Vaccines in February 2024 and selected by the Food and Drug Administration's Vaccines and Related Biological Products Advisory Committee in March 2024 after reviewing and evaluating data on the 2023–2024 influenza season and the performance of the 2023–2024 influenza vaccines (2,3). The A(H1N1)pdm09, B/Victoria lineage and B/Yamagata lineage components are unchanged from the 2023–2024 Northern Hemisphere influenza vaccines. Both the egg-based and cell- or recombinant-based vaccines had a change in the A(H3N2) component. In the egg-based vaccine it was changed to an A/Thailand/8/2022 (H3N2)-like virus and in cell- or recombinant-based vaccines it was changed to an A/Massachusetts/18/2022 (H3N2)-like virus23. The genetic clade and subclade for the recommended vaccine viruses were 5a.2a.1 for A(H1N1)pdm09, 3C.2a1b.2a.3a.1 for A(H3N2), V1A.3a.2 for B/Victoria, and Y3 for B/Yamagata.
Due to the lack of detections of circulating B/Yamagata lineage viruses worldwide after March 2020, FDA further recommended vaccines manufactured for the U.S. population for the 2024–2025 season be trivalent, including only one B component from the B/Victoria lineage4.
Table 2. Influenza Vaccine Viruses Northern Hemisphere 2023–2024 and 2024–2025* Seasons2.
| 2025–2024 Vaccine | 2023–2024 Vaccine | |
|---|---|---|
| Egg-based Quadrivalent | A/Victoria/4897/2022 (H1N1)pdm09-like virus | A/Victoria/4897/2022 (H1N1)pdm09-like virus |
| A/Thailand/8/2022 (H3N2)-like virus | A/Darwin/9/2021 (H3N2)-like virus | |
| B/Austria/1359417/2021-like virus (B/Victoria lineage) | B/Austria/1359417/2021-like virus (B/Victoria lineage) | |
| B/Phuket/3073/2013-like virus (B/Yamagata lineage) | B/Phuket/3073/2013-like virus (B/Yamagata lineage) | |
| Egg-based Trivalent | A/Victoria/4897/2022 (H1N1)pdm09-like virus | A/Victoria/4897/2022 (H1N1)pdm09-like virus |
| A/Thailand/8/2022 (H3N2)-like virus | A/Darwin/9/2021 (H3N2)-like virus | |
| B/Austria/1359417/2021-like virus (B/Victoria lineage) | B/Austria/1359417/2021-like virus (B/Victoria lineage) | |
| Cell- or recombinant-based Quadrivalent | A/Wisconsin/67/2022 (H1N1)pdm09-like virus | A/Wisconsin/67/2022 (H1N1)pdm09-like virus |
| A/Massachusetts/18/2022 (H3N2)-like virus | A/Darwin/6/2021 (H3N2)-like virus | |
| B/Austria/1359417/2021-like virus (B/Victoria lineage) | B/Austria/1359417/2021-like virus (B/Victoria lineage) | |
| B/Phuket/3073/2013-like virus (B/Yamagata lineage) | B/Phuket/3073/2013-like virus (B/Yamagata lineage) | |
| Cell- or recombinant-based Trivalent | A/Wisconsin/67/2022 (H1N1)pdm09-like virus | A/Wisconsin/67/2022 (H1N1)pdm09-like virus |
| A/Massachusetts/18/2022 (H3N2)-like virus | A/Darwin/6/2021 (H3N2)-like virus | |
| B/Austria/1359417/2021-like virus (B/Victoria lineage) | B/Austria/1359417/2021-like virus (B/Victoria lineage) |
*Due to the lack of detections of circulating B/Yamagata lineage viruses worldwide after March 2020, FDA further recommended vaccines manufactured for the U.S. population for the 2024–2025 season be trivalent, including only one B component from the B/Victoria lineage.
Novel Flu A Viruses
Novel influenza A viruses are influenza A virus subtypes that are different from currently circulating human seasonal influenza viruses. Early identification and investigation of human infections with novel influenza A viruses are critical so that the risk of infection can be understood, and appropriate public health measures can be taken1.
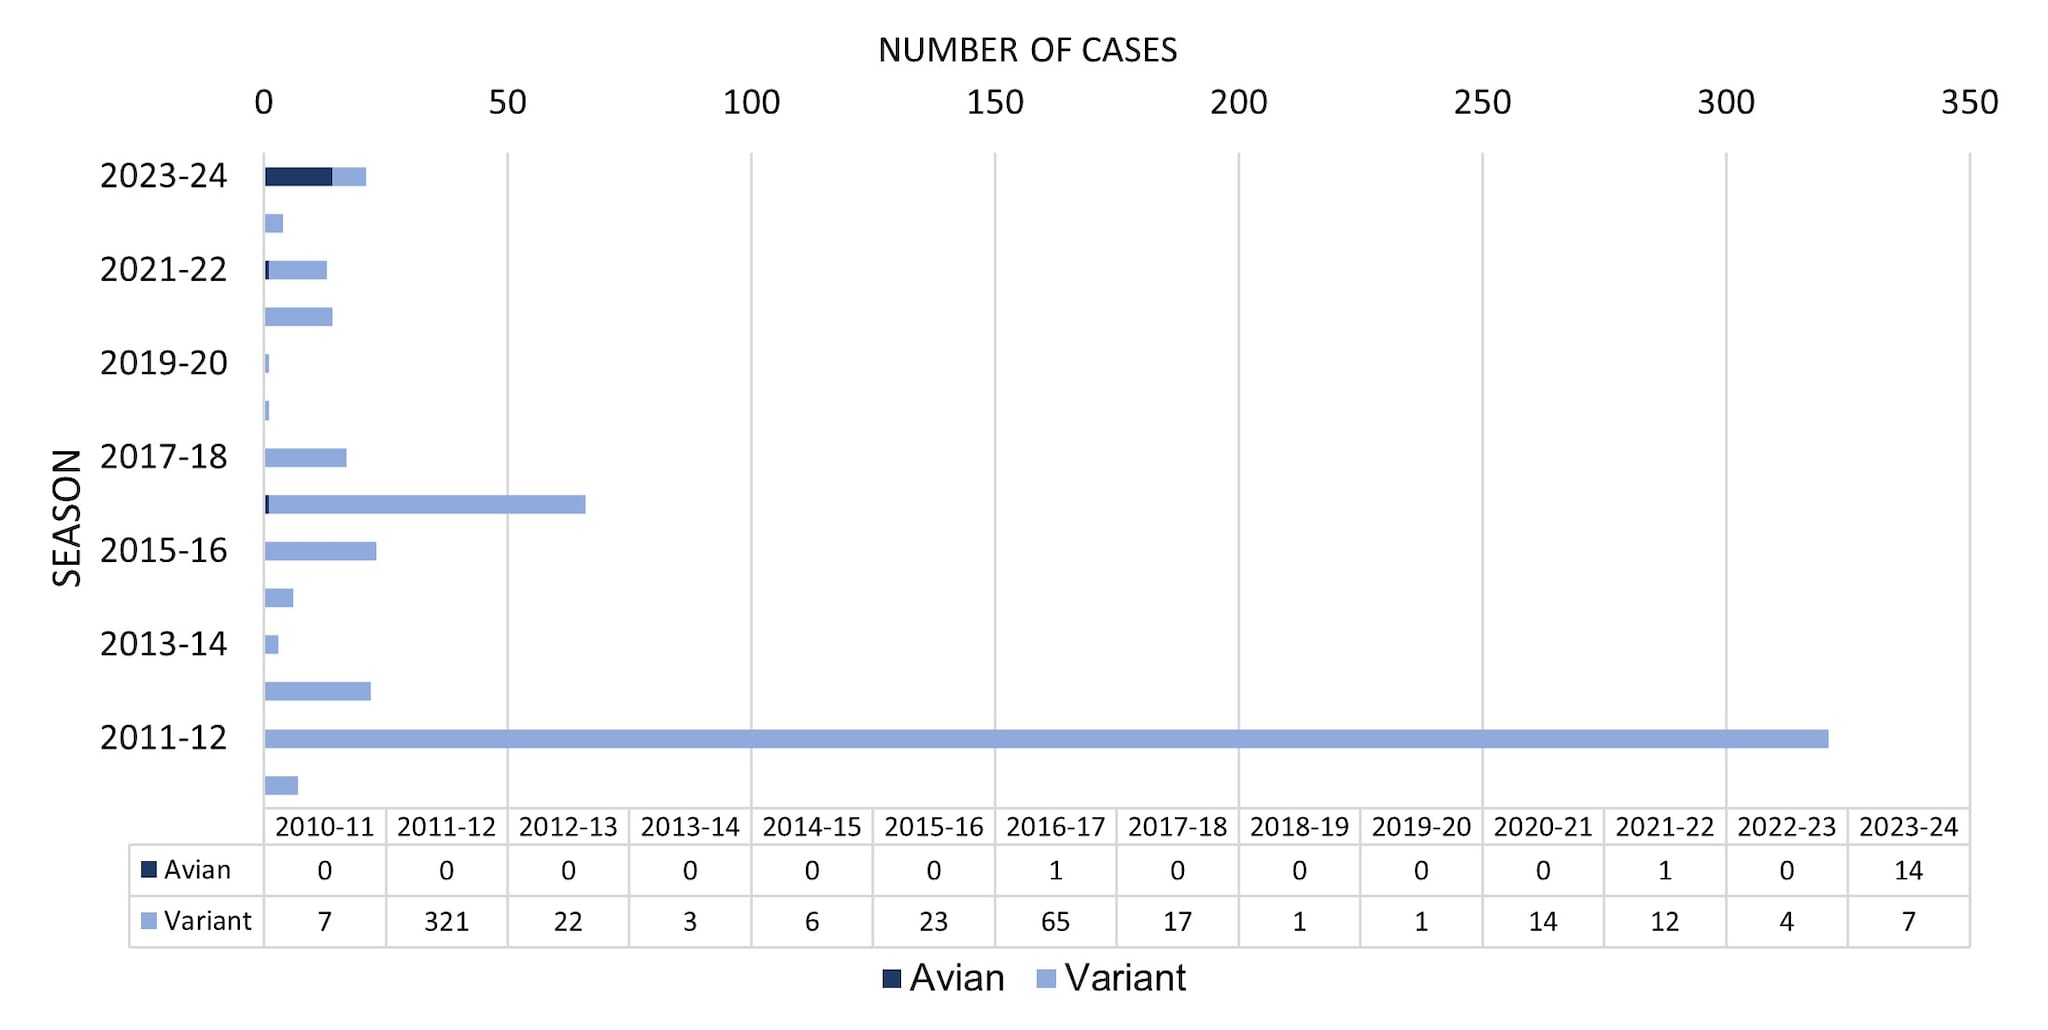
From October 1, 2023, through August 31, 2024, a total of 21 novel influenza A virus infections were reported to CDC (Figure 4). Of the 21 novel influenza A virus infections reported, 14 avian influenza A (H5) virus detections in people were reported from 4 states (1-TX, 2-MI,10-CO, 1-MO). Four of the 14 cases were associated with exposure to highly pathogenic avian influenza (HPAI) H5N1 infected dairy cattle, 9 were associated with poultry culling operations, and one case did not have a determined source. All 14 cases occurred in adults, 13 reported mild illness, and one patient with underlying medical conditions was hospitalized at the time the specimen for influenza testing was collected. All have recovered from their illness. No human-to-human transmission of avian influenza A (H5) viruses was identified associated with these cases.
Currently in the United States, HPAI A(H5N1) virus has been detected in wild birds, and there have been outbreaks among other animals including commercial poultry, backyard flocks, and dairy cows. Sporadic infections in wild mammals also have been reported by U.S. Department of Agriculture (USDA) Animal Plant Health Inspection Service (APHIS)5. The first detections of HPAI A(H5N1) virus in dairy cows and unpasteurized milk samples from cows in Texas and Kansas were reported by USDA on March 25, 2024. As of August 31, 2024, HPAI A(H5N1) virus has been detected in 201 dairy herds from 14 states. Since 2022, HPAI A(H5) virus has been detected in commercial and backyard flocks in 48 states and has impacted over 100 million birds5. Updates on surveillance activities and symptom monitoring among persons exposed to animals infected with H5N1 are available at: How CDC is monitoring influenza data among people to better understand the current avian influenza A (H5N1) situation.
CDC recommends that state and local public health departments monitor people who are exposed to birds or other animals (including livestock) suspected to be infected with avian influenza A viruses for signs and symptoms consistent with influenza virus infection until 10 days after their last exposure and that people who develop illness be tested for influenza and treated with antiviral medication if indicated6. During February 9, 2022 — August 31, 2024, over 14,100 people were monitored following exposure to HPAI A(H5N1) virus infected birds, cows, or other animals.
Of the 21 novel influenza A virus infections reported during the 2023–2024 season, 7 were confirmed to be variant viruses (i.e., a swine influenza virus identified in a human and designated with a "v"). One H1N1v (OH), 4 H1N2v (PA), and 2 H3N2v (1-CO, 1-MI) virus infections were detected and reported to CDC. Among the 7 individuals infected with variant influenza viruses, 6 had documented swine exposure prior to illness, and for one the investigation did not determine a source. Among the 7 cases, 4 were hospitalized, and all recovered from their illness. Three were children <18 years old, and 4 were adults. No human-to-human transmission of variant influenza viruses was identified associated with these cases.
Figure 4. Novel Influenza A Virus Cases by Season— United States, 2010–2011 to 2023–2024 Season
Outpatient Respiratory Illness Surveillance
Information on outpatient visits to health care providers for respiratory illness, referred to as influenza-like illness ([ILI], fever plus cough or sore throat), is collected through the U.S. Outpatient Influenza-like Illness Surveillance Network (ILINet)1. Nationally, the weekly percentage of outpatient visits for ILI recorded in ILINet was at or above the national baseline of 2.9% for 22 consecutive weeks from late October 2023 to late March 2024 and peaked at 6.9% during the week ending December 30, 2023 (week 52) (Figure 5). The timing and peak percentage of visits for ILI during the 2023–2024 season were within the range of what was reported during seasons before the COVID-19 pandemic, which may be attributable to respiratory virus circulation and healthcare seeking behavior that was more similar to pre-COVID seasons than what occurred during the 2020–2021, 2021–2022, and 2022–2023 seasons.
On a regional level, 8 of 10 HHS regions reported ILI activity that peaked during the week ending December 30, 2023 (week 52); however, Region 6 (South Central) peaked during the week ending December 23, 2023 (week 51) and Region 7 (Central) peaked during the week ending February 24, 2024 (week 8). The number of weeks of elevated activity (weeks above the region-specific baseline) varied slightly by region: Region 1 (New England) was above baseline for 23 weeks; Regions 3 (Mid-Atlantic), 4 (Southeast), 5 (Midwest), 6 (South Central), and 7 (Central) were above baseline for 20-21 weeks; Regions 2 (New York/New Jersey/Puerto Rico/Virgin Islands), 8 (Mountain) and 9 (Pacific) were above baseline for 17-18 weeks; and Region 10 (Pacific Northwest) was above baseline for 14 weeks. Multiple respiratory viruses co-circulated during the 2023–2024 season and the contribution of influenza viruses to ILI likely varied by week and location.
Figure 5. Percentage of Outpatient Visits for Respiratory Illness as Reported by ILINet, National Summary by Season — United States, 2018–2019 to 2023–2024 Seasons
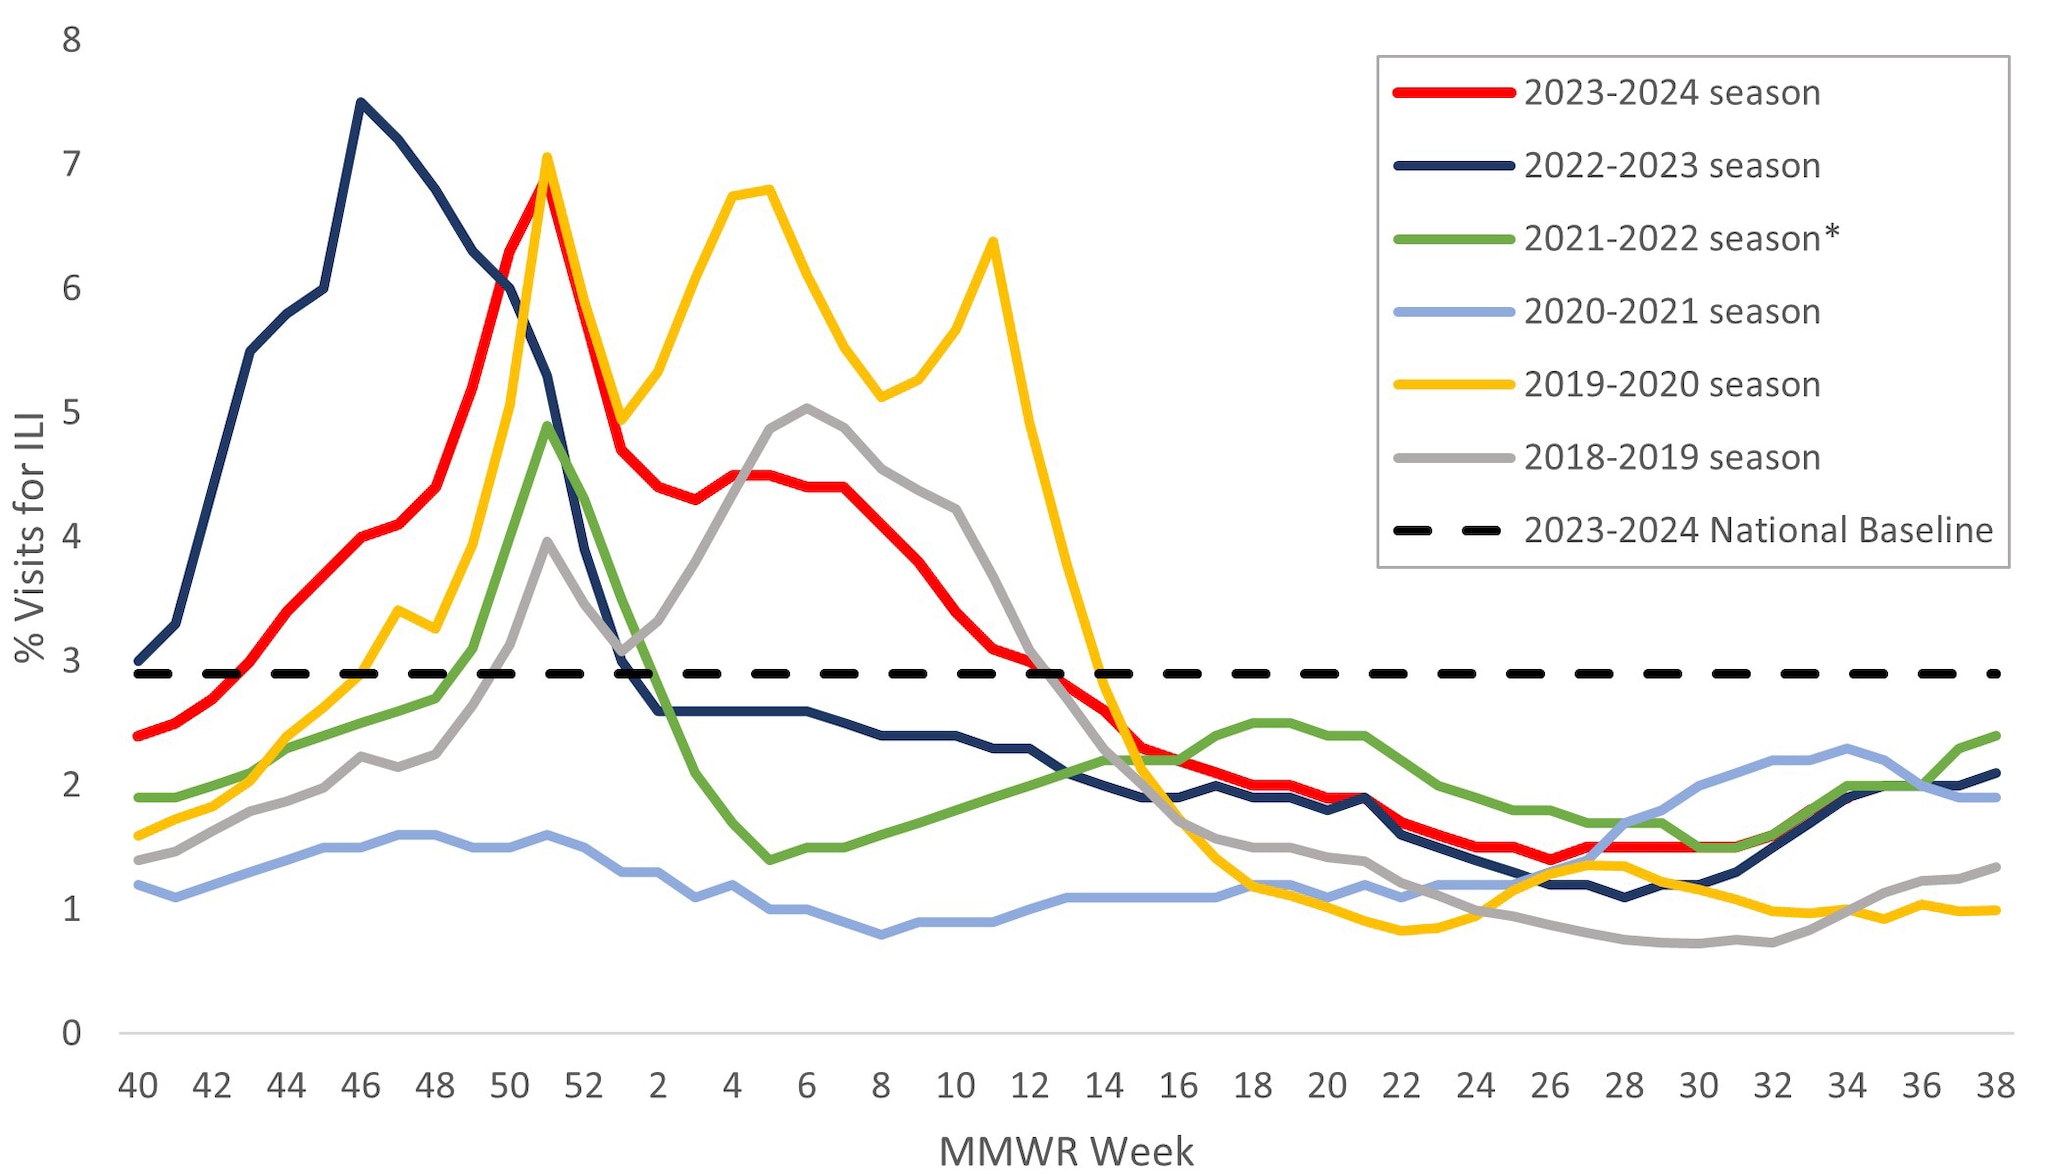
*Effective October 3, 2021 (Week 40), the respiratory illness definition (fever plus cough or sore throat) no longer includes "without a known cause other than influenza."
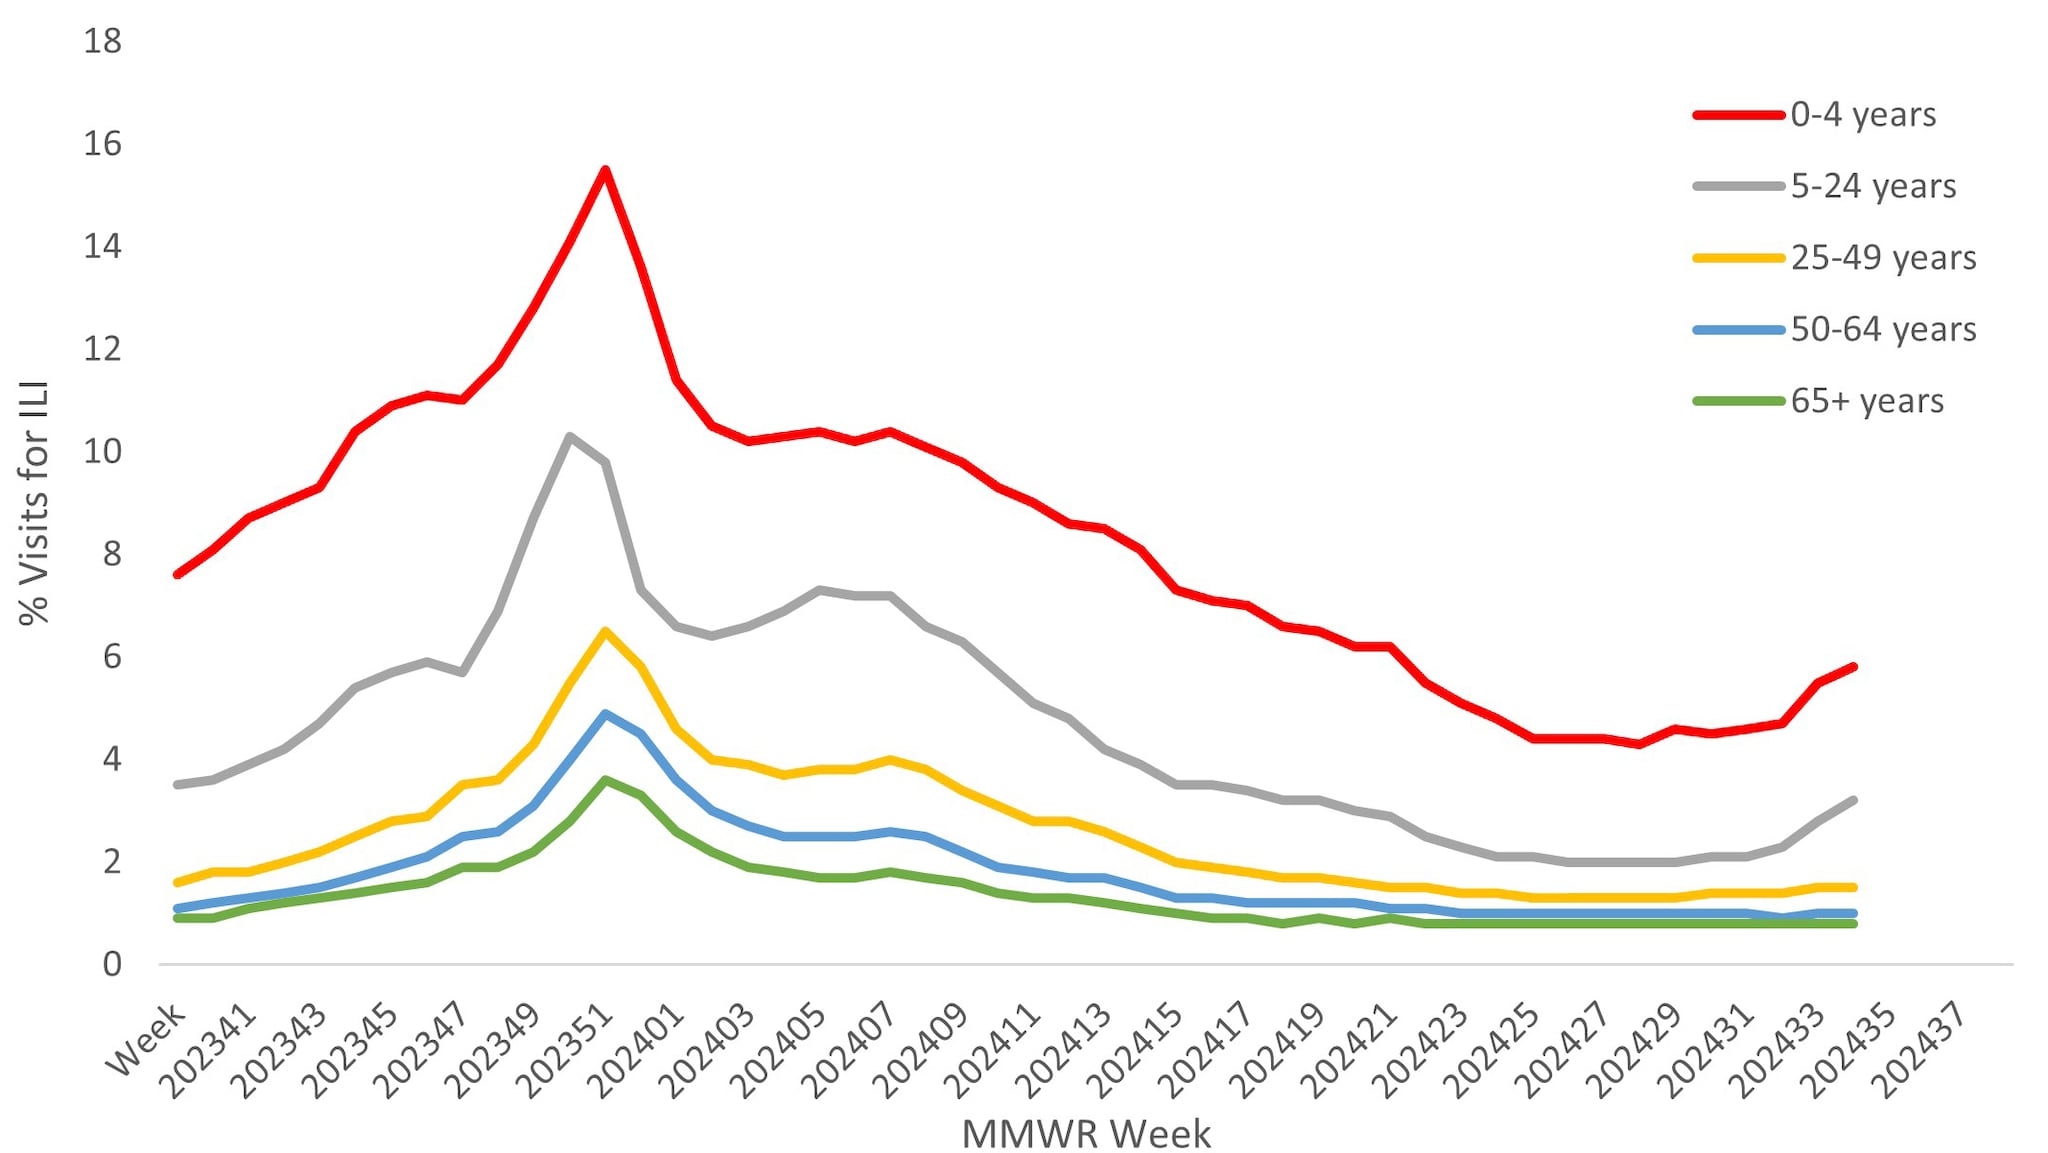
Approximately 67% of ILINet providers report total number of patient visits, as well as ILI visits, by age group, allowing the calculation of percentage of visits for ILI by age group. Both pediatric age groups (0–4 years and 5–24 years) had a higher percentage of visits for ILI compared to the adult age groups throughout the season. Peak activity among those 5–24 years occurred during the week ending December 23, 2023, while activity in all other age groups occurred during the week ending December 30, 2023 (Figure 6).
Figure 6. Percentage of Outpatient Visits by Age Group for Respiratory Illness as Reported by ILINet — United States, October 1, 2023 – August 31, 2024
ILINet data are used to produce weekly jurisdiction and core-based statistical area (CBSA)-level measures of ILI activity. From the 2008–2009 season through the 2018–2019 season ILI activity categories ranged from minimal to high; during the 2019–20 season the very high category was added1. For the weeks ending December 23, 2023–January 6, 2024, and February 10, 2024 (weeks 51-1, 6), more than 50% of the 55 jurisdictions experienced high or very high ILI activity each week, with the highest number (41; 74.5%) occurring during the week ending December 30, 2023 (week 52). This is similar to the peak weekly percentage of jurisdictions experiencing high of very high ILI activity during the past 2 seasons (2022–2023 [86%], 2021–2022 [58%]) and during the 2 seasons before the COVID-19 pandemic (2019–20 [87.0%], 2018–2019 [59.3%]). For a weekly snapshot of geographic activity levels of ILI, please see FluView Interactive.
Hospitalization Surveillance
CDC monitors hospitalizations associated with laboratory-confirmed influenza virus infections through two surveillance systems: the Influenza Hospitalization Surveillance Network (FluSurv-NET), which covers approximately 9% of the U.S. population, and National Healthcare Safety Network (NHSN) Hospitalization Surveillance which consists of reports from all hospitals across the country (1).
From October 1, 2023, to August 31, 2024, a total of 25,390 laboratory-confirmed influenza-related hospitalizations were reported by FluSurv-NET sites. Hospitalization rates peaked nationally during the week ending December 30, 2023 (week 52) at 8.9 per 100,000 population. This is the third highest weekly rate observed during all seasons going back to 2010–2011 (Figure 7). This season follows the 2017–2018 season which peaked at 10.2 per 100,000 during the week ending January 6, 2018 (week 1) and the 2014–2015 season which peaked at 9.0 per 100,000 during the week ending December 27, 2014 (week 52).
Figure 7. Weekly Rates of Laboratory-Confirmed Influenza Hospitalizations — United States, 2014–2015 to 2023–2024 influenza seasons
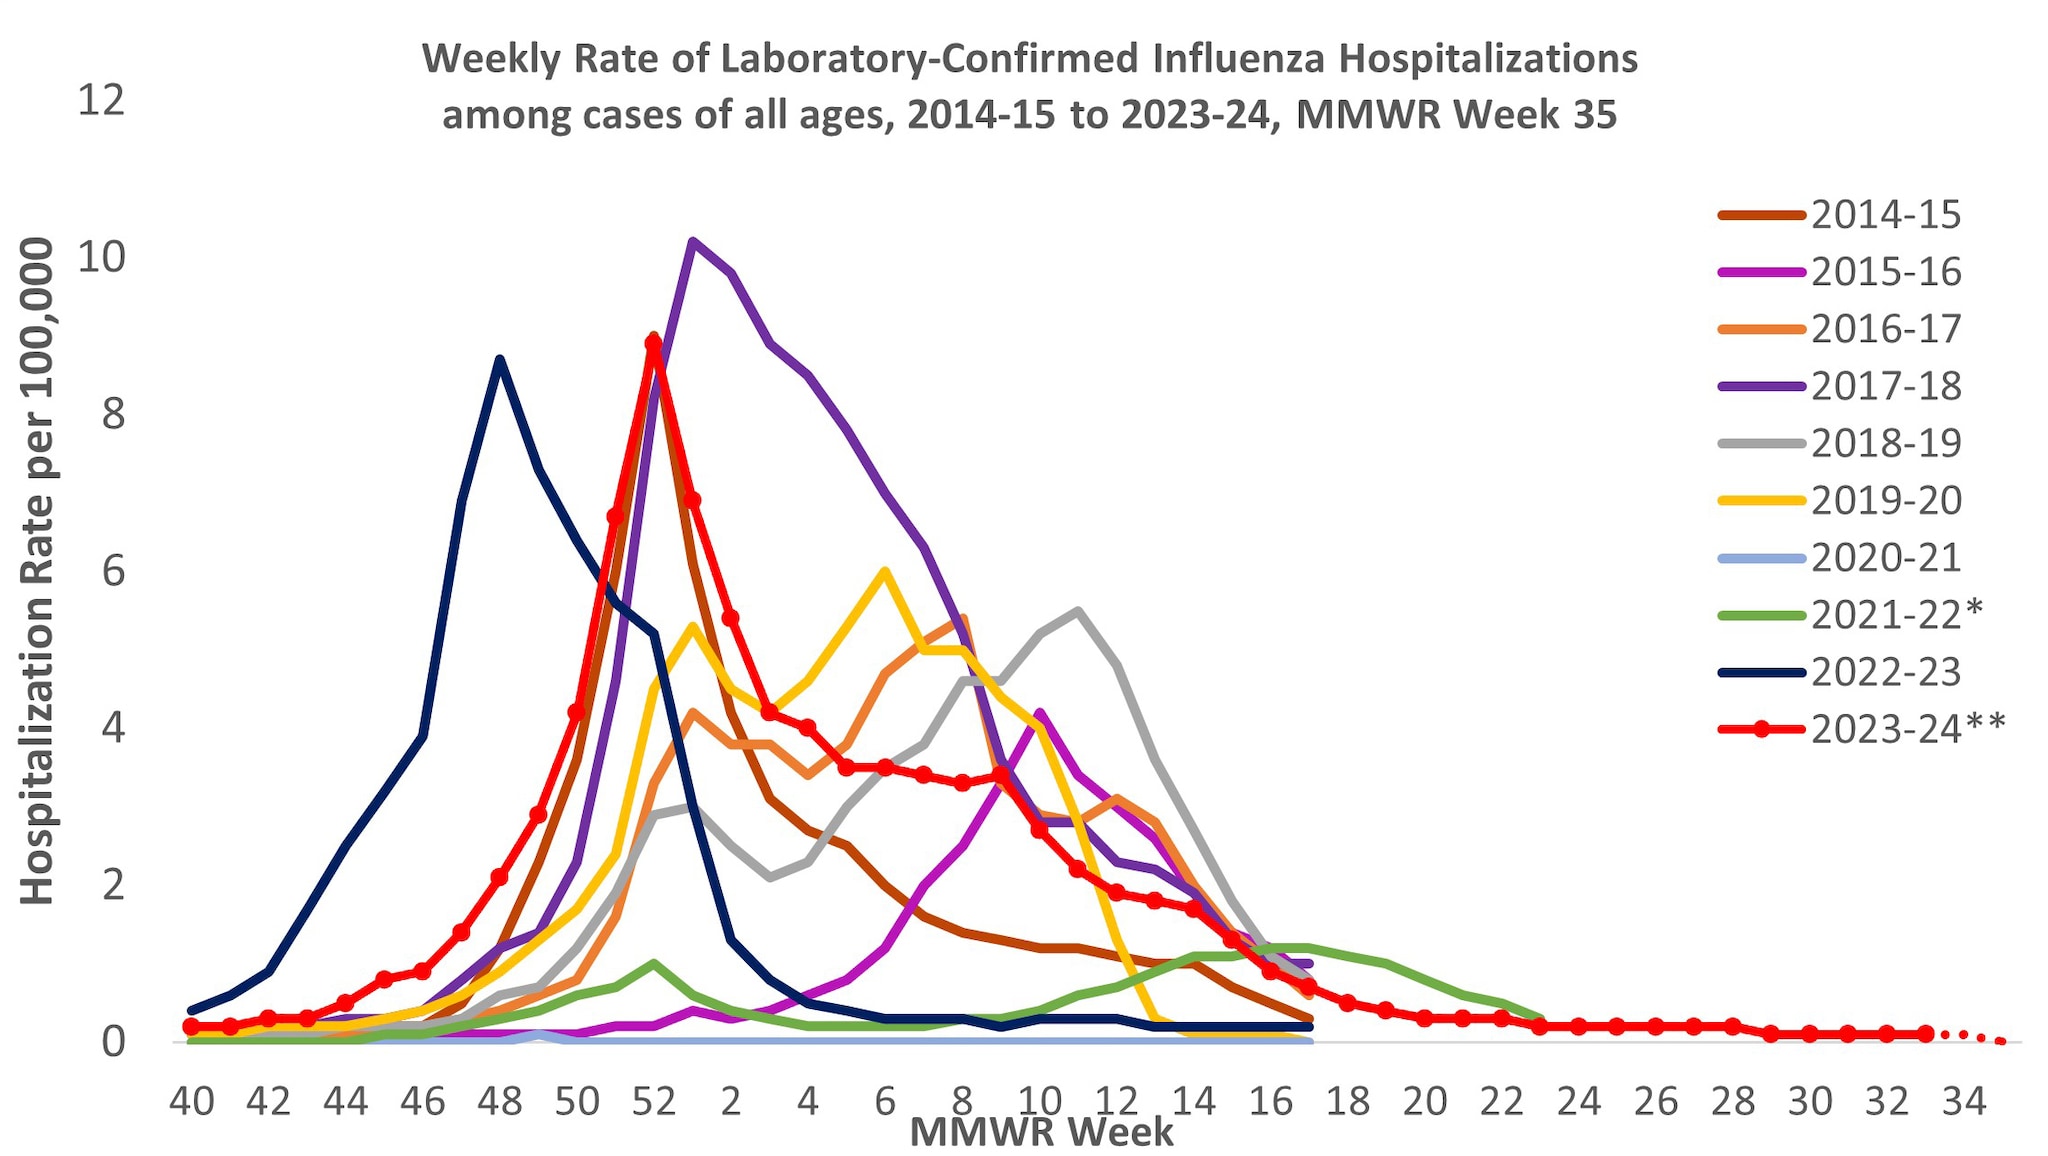
*Dashed lines for current season indicate potential reporting delays for recent weeks. Data from the Respiratory Virus Hospitalization Surveillance Network (RESP-NET) are preliminary and subject to change as more data become available. As data are received each week, prior case counts and rates are updated accordingly. Hospitalization rates are updated weekly as data becomes available.
**In 2021–2022, rates reflect cases hospitalized beginning October 1, 2021 (MMWR Week 39), but given late influenza season activity, the season was extended to June 11, 2022 (MMWR Week 23). In 2023–2024, surveillance was extended beyond April 30 for situational awareness during the ongoing outbreak of highly pathogenic avian influenza (HPAI) A(H5N1) virus among birds, poultry, dairy cattle, and other animals in the United States.
The overall cumulative hospitalization rate through April 27, 2024 (to coincide with when FluSurv-NET surveillance typically ends) was 83.1 per 100,000 population. Since the 2009–2010 season, this is the second highest cumulative rate based, (Figure 8).
Figure 8. Cumulative Rates of Laboratory-Confirmed Influenza Hospitalizations — United States, 2014–2015 to 2023–2024 influenza seasons
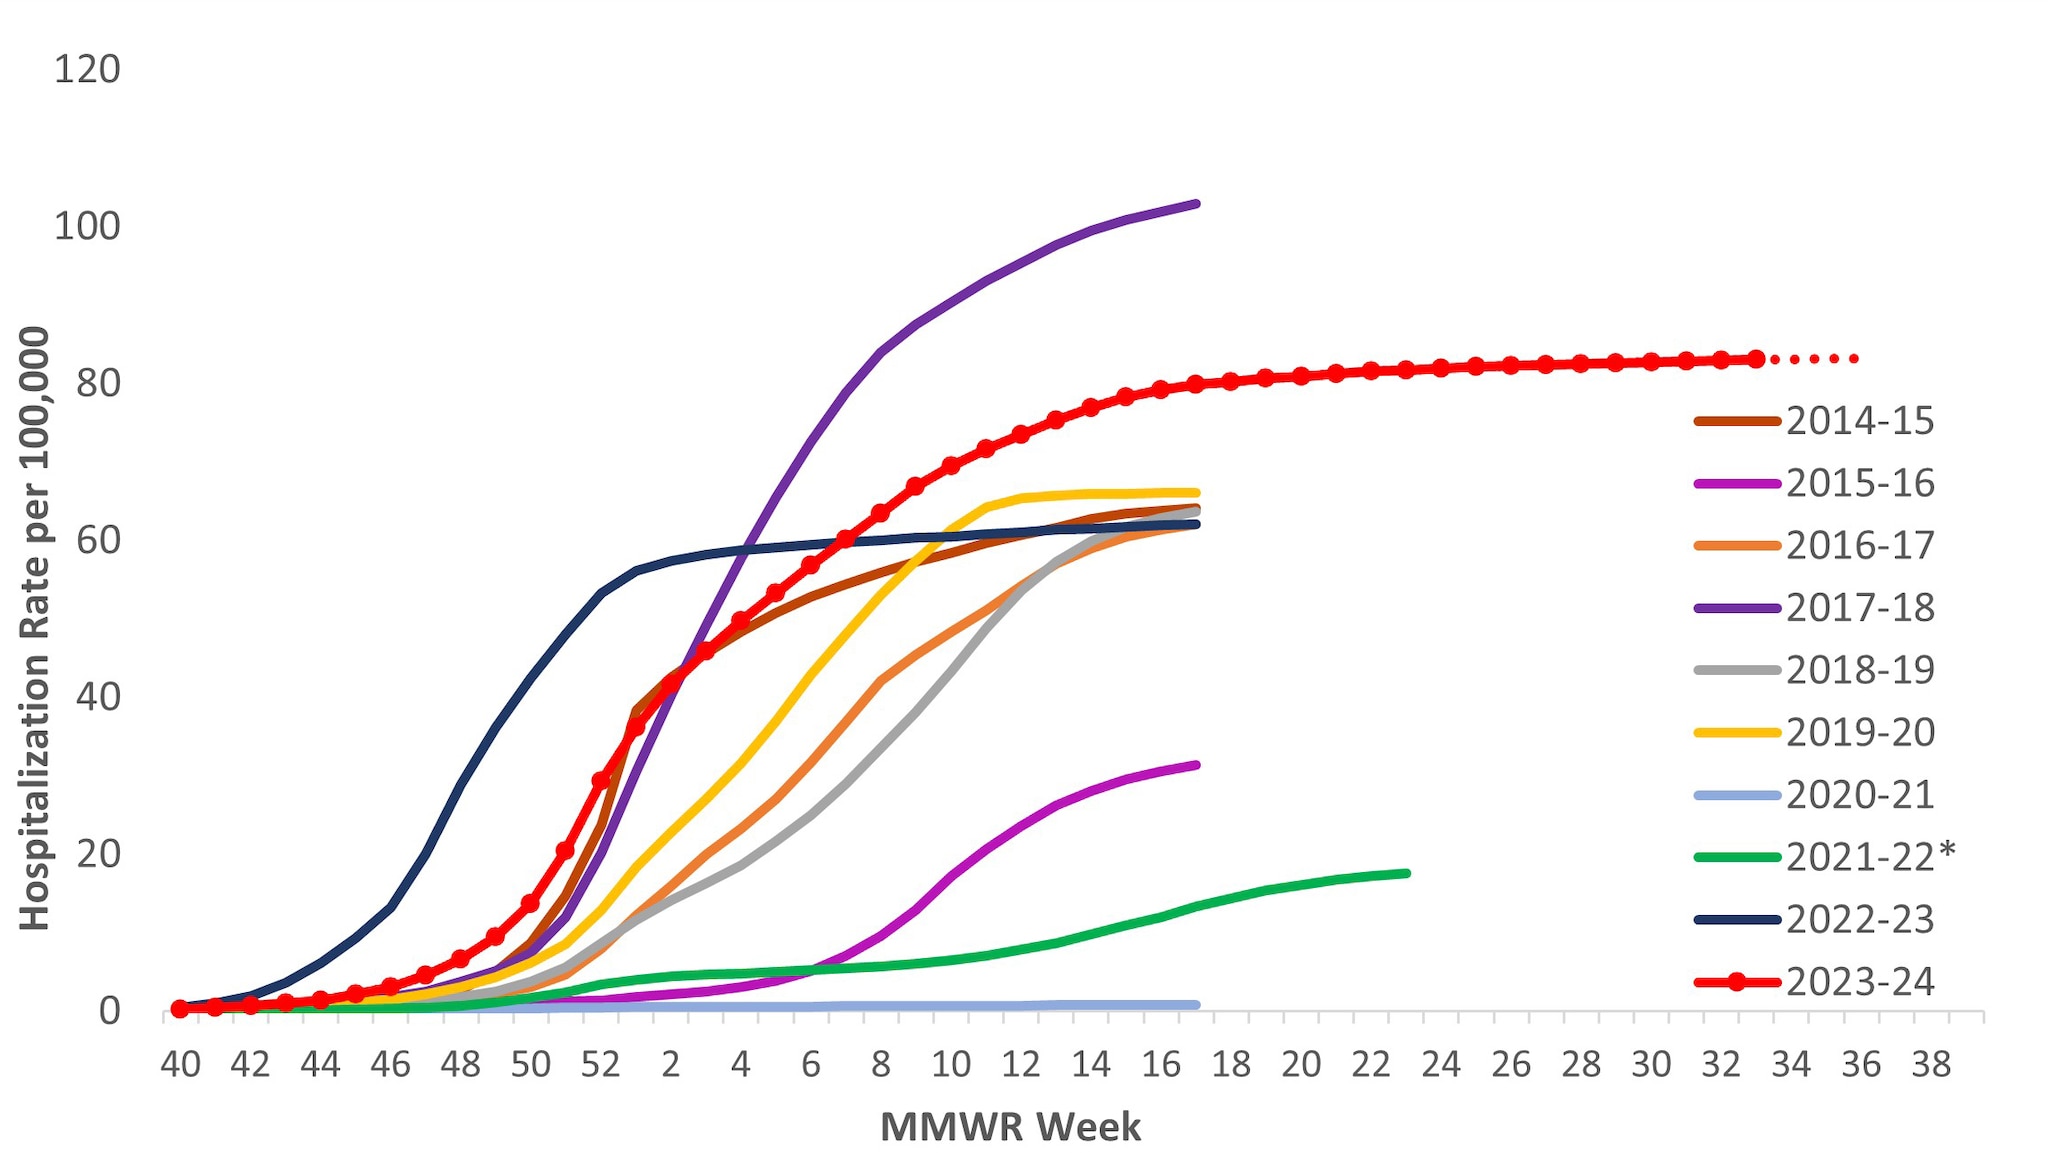
*In 2021–2022, rates reflect cases hospitalized beginning October 1, 2021 (MMWR Week 39), but given late influenza season activity, the season was extended to June 11, 2022 (MMWR Week 23). In 2023–2024, surveillance was extended beyond April 30 for situational awareness during the ongoing outbreak of highly pathogenic avian influenza (HPAI) A(H5N1) virus among birds, poultry, dairy cattle, and other animals in the United States. Because surveillance for the 2023–2024 season was extended, it is recommended to not compare the cumulative rate from this season to cumulative rates from past seasons in which surveillance ended earlier.
Among 25,390 influenza-associated hospitalizations, most (84.6%) were associated with influenza A virus, with 14.8% associated with influenza B virus. Among those with influenza A subtype information, 67.6% were A(H1N1)pdm09 and 32.4% were A(H3N2).
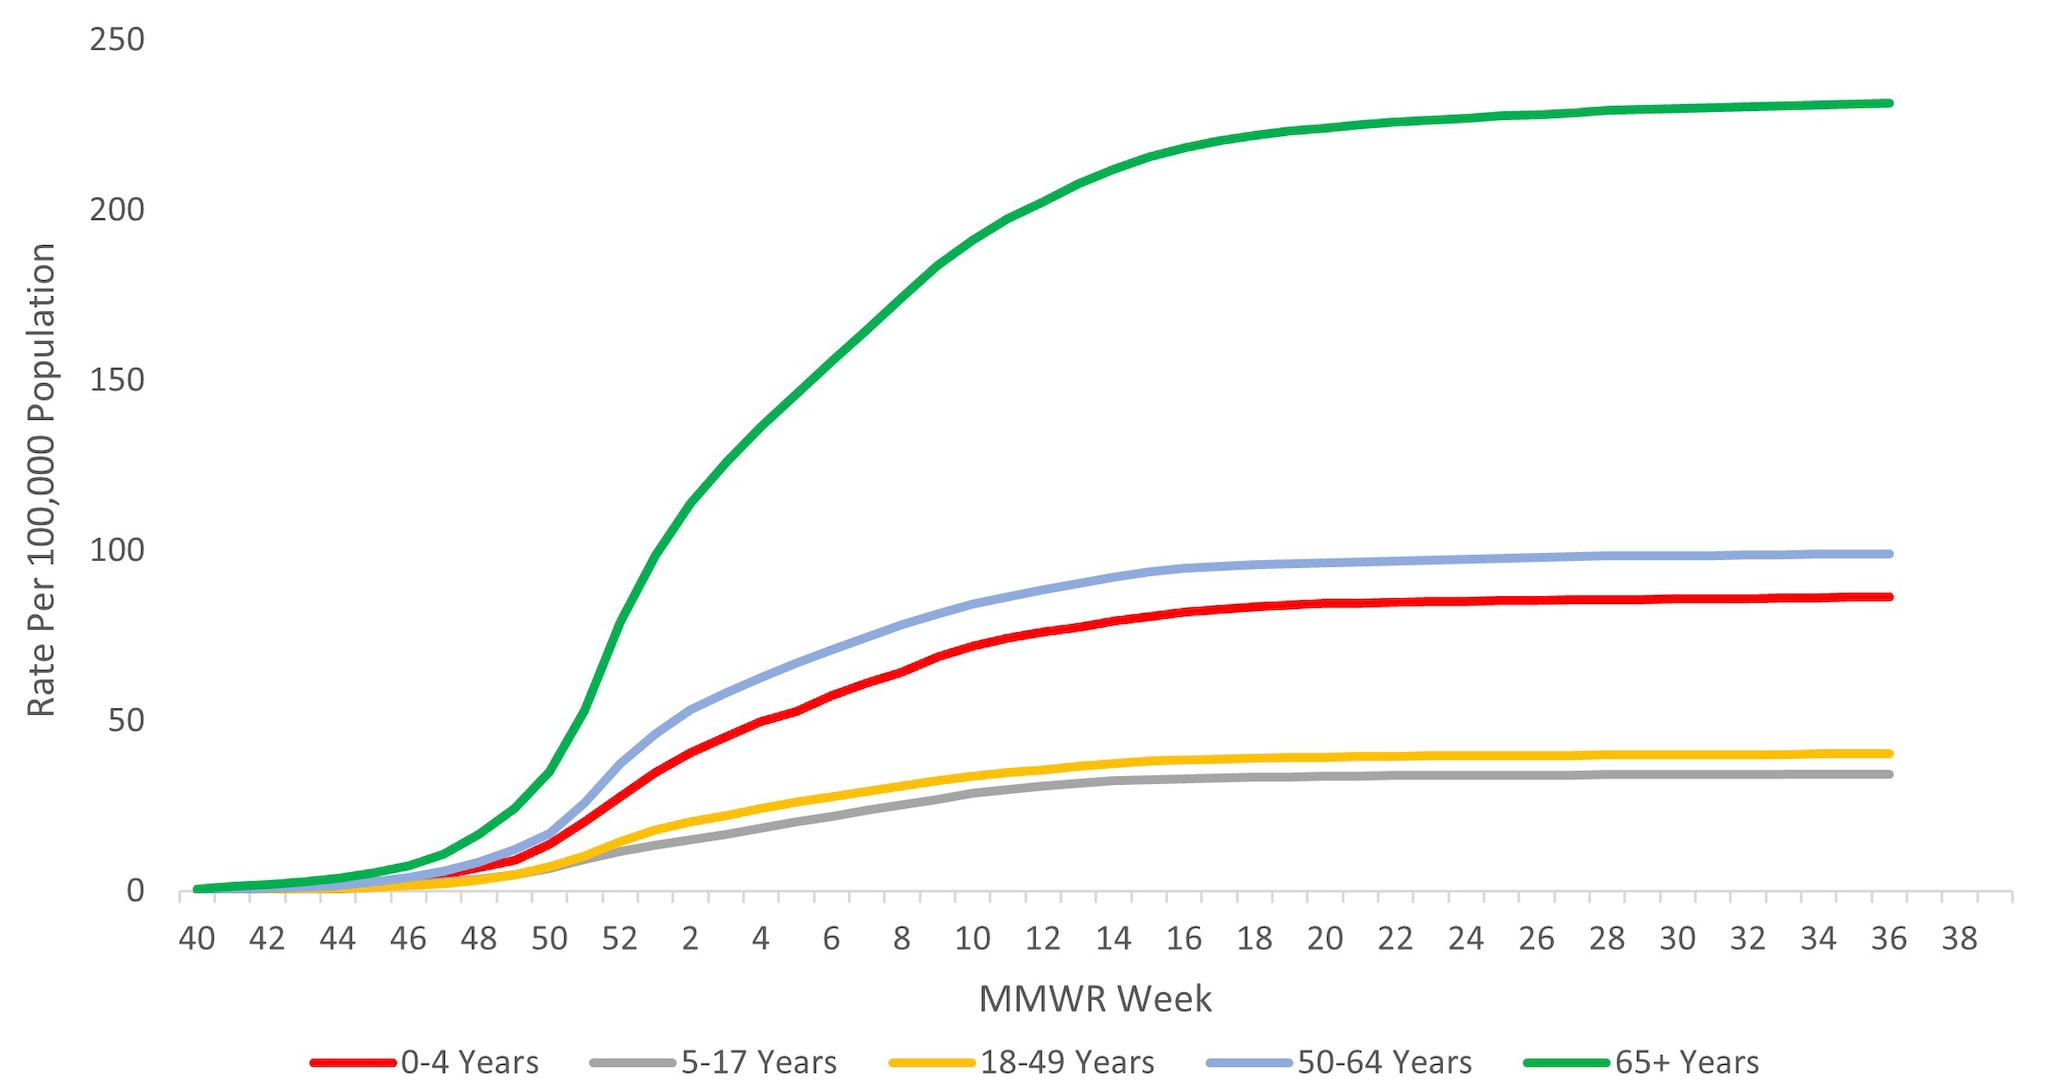
When examining rates by age, the highest cumulative hospitalization rate per 100,000 population was among adults aged ≥65 years (231.0), followed by adults aged 50–64 years (98.9), children aged 0–4 years (86.1), adults aged 18–49 years (40.2), and was lowest among children and adolescents aged 5–17 years (34.3) (Figure 9). When examining age-adjusted rates by race and ethnicity, the highest cumulative hospitalization rate per 100,000 population was among non-Hispanic Black persons (149.5), followed by non-Hispanic American Indian or Alaska Native persons (120.4), Hispanic/Latino persons (85.9), non-Hispanic White persons (65.5), and non-Hispanic Asian/Pacific Islander persons (47.5).
Figure 9. Cumulative Rate of Laboratory-Confirmed Influenza Hospitalizations by Age — United States, 2023–2024 influenza season
Among 5,990 adults with information on underlying medical conditions who were hospitalized between October 1, 2023, and April 30, 2024, 94.5% had at least one reported underlying medical condition; the most commonly reported were hypertension, cardiovascular disease, metabolic disorder, and obesity. Among 1,980 hospitalized women of childbearing age (15–49 years) with information on pregnancy status, 21.7% were pregnant. Among 1,429 hospitalized children and adolescents with information about underlying conditions, 70.7% reported at least one underlying medical condition; the most commonly reported were asthma, neurologic disease, and obesity.
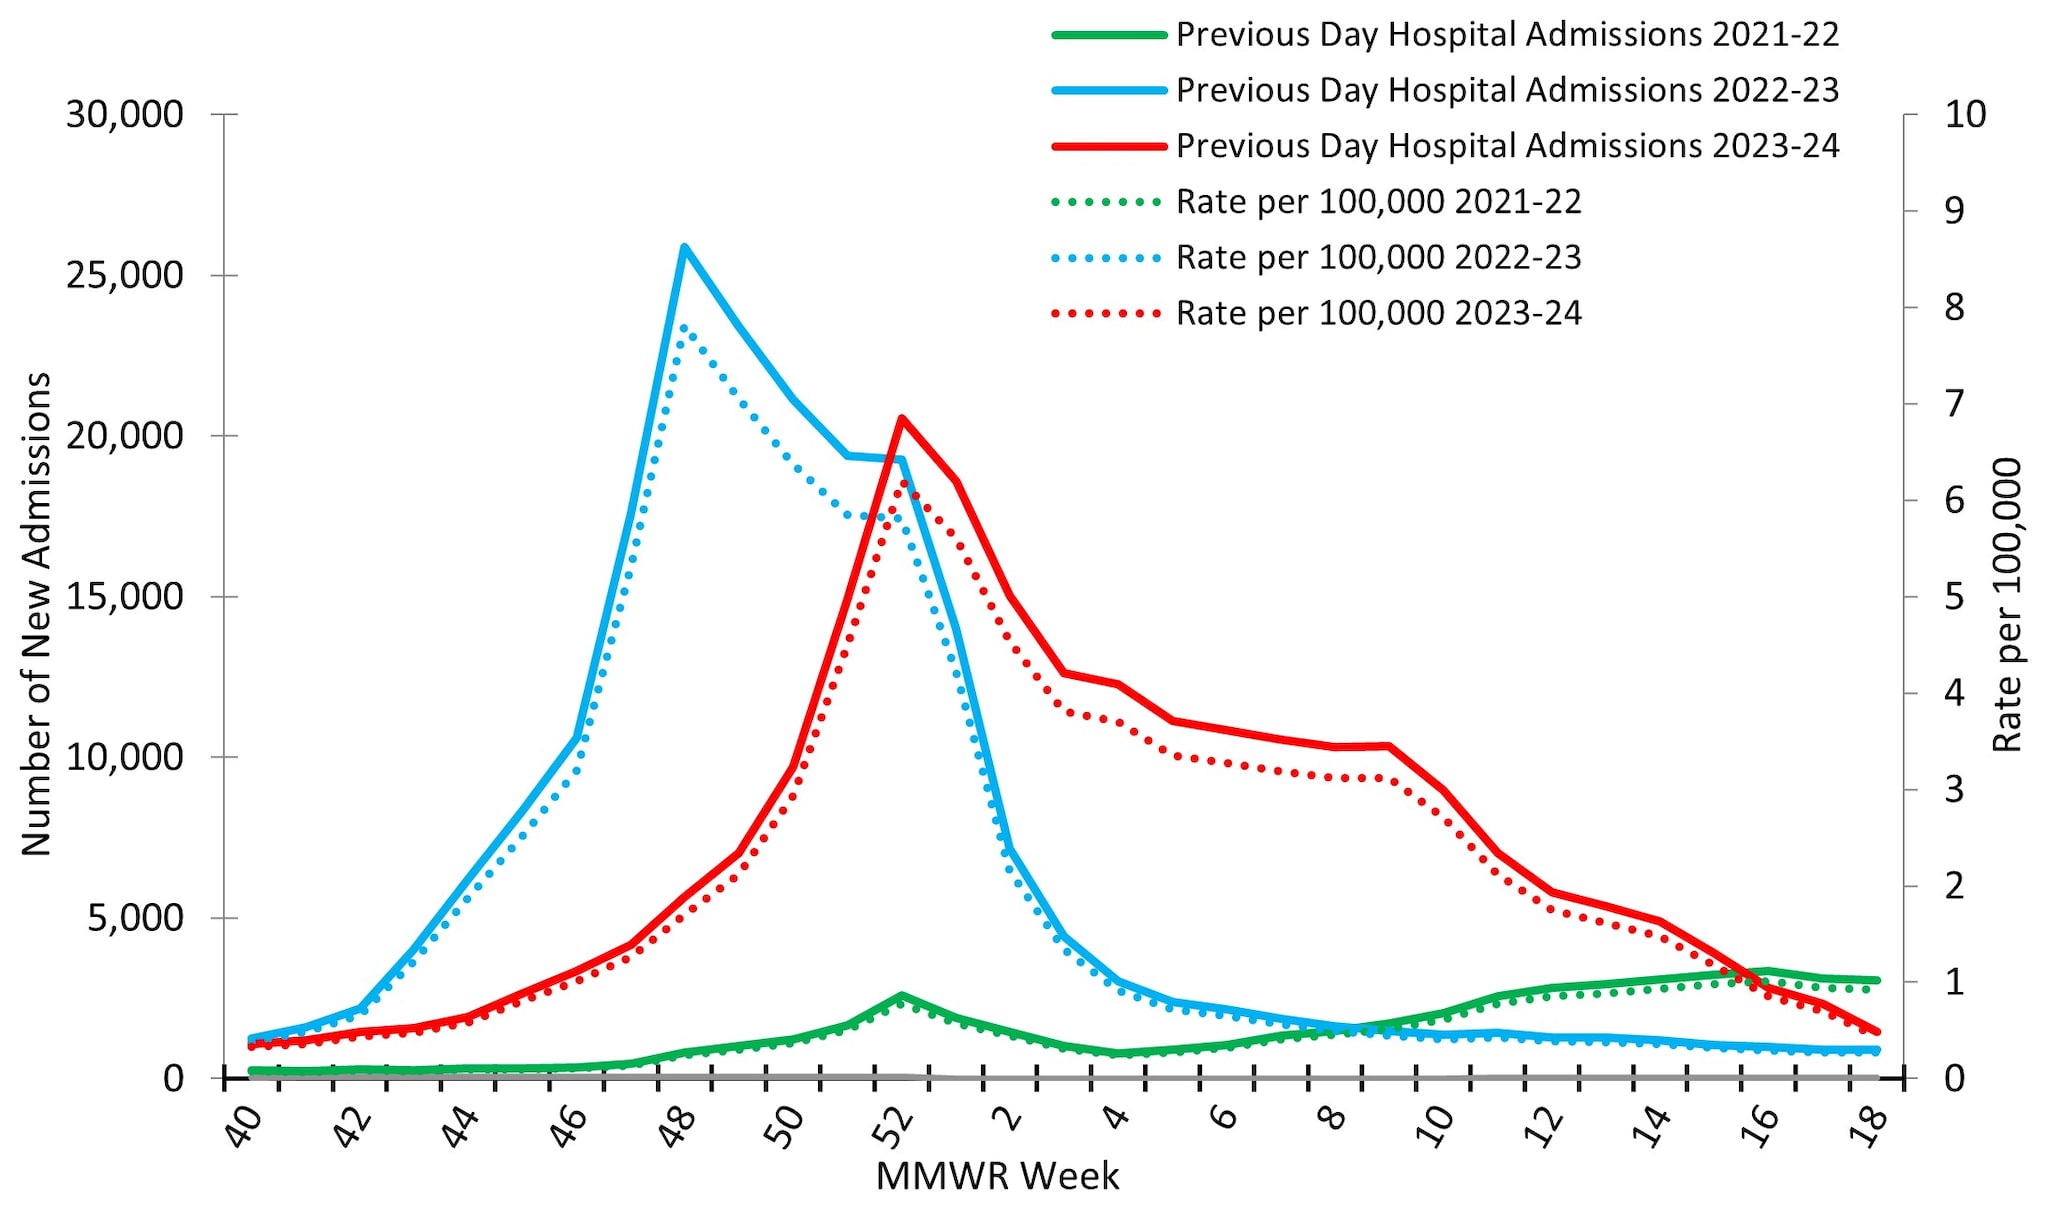
Reporting to the National Healthcare Safety Network (NHSN) Hospitalization Surveillance Component, the second surveillance system that tracks hospitalizations associated with laboratory-confirmed influenza virus infections, was between October 1, 2023, and May 4, 2024. During that time, 229,442 influenza associated hospitalizations were reported yielding a cumulative national influenza associated hospitalization rate of 69.2 per 100,000 population for the season. Hospitalizations began to increase in early November, peaking nationally during the week ending December 30, 2023 (week 52) at 20,534 hospitalizations (6.2 hospitalizations per 100,000 population) before declining slightly and remaining relatively stable at elevated levels through February 2024 (Figure 10). While the peak weekly number of hospitalizations during the 2023–2024 season (20,534) was slightly lower than the peak weekly number during the 2022–2023 season (25,882), the total number of hospitalizations was higher this season (229,442) than it was during the same time period of the 2022–2023 season (209,338) due to the extended period of elevated activity this season.
Figure 10. Number of New Influenza Hospital Admissions and Rates Reported to the CDC’s National Healthcare Safety Network (NHSN) Hospitalization Surveillance Component, National Summary, 2021–2022 to 2023–2024 Seasons
At a regional level, the timing of peak activity was similar to that observed nationally (week ending December 30, 2023) for 7 of the 10 HHS Regions: Regions 2 (New York/New Jersey/Puerto Rico), 3 (Mid-Atlantic), 4 (Southeast), 5 (Midwest), 8 (Mountain), 9 (West Coast), and 10 (Pacific Northwest). Regions 1 (New England) and 6 (South Central) peaked one week later (the week ending January 6, 2024) and Region 7 (Central) peaked during the week ending March 2, 2024 (week 9). Hospitalization rates in Regions 1 (New England), 3 (Mid-Atlantic), 5 (Midwest), and 6 (South Central) had a bimodal distribution, with smaller secondary peaks occurring in early March 2024 following the initial peak in late December and early January 2024. On a regional level, cumulative hospitalization rates ranged from 39.7 to 82.7 per 100,000 with 7 regions reporting a cumulative rate greater than 70 per 100,000. For additional details, see FluView Interactive.
Mortality Surveillance
According to the National Center for Health Statistics (NCHS) Mortality Surveillance System1, during October 1, 2023 – August 31, 2024, a total of 2,774,168 deaths from all causes were reported nationally. Among these, 10,289 (0.4%) had influenza listed as an underlying or contributing cause of death. The weekly percentage of deaths due to influenza ranged from 0.03% to 1.3% and peaked during the week ending January 6, 2024 (week 1) (Figure 11). Influenza deaths began to increase in late November 2023, peaking in early January 2024 (week 1), and then declined. This peak occurred later in the season compared to the 2022–2023 influenza season, which peaked at 1.6% during mid-December 2022; however, it was slightly earlier than recent pre-COVID influenza seasons, which peaked between late January 2018 (2017–2018 season) and mid-March 2016 (2015–2016 season). While the peak weekly percentage of deaths due to influenza was lower during this season compared to last, the cumulative percentage of deaths due to influenza was slightly higher (0.4% during 2023–2024 compared with 0.3% during 2022–2023) due to longer duration of elevated influenza-associated mortality.
Figure 11. Influenza Mortality from the National Center for Health Statistics Mortality Surveillance System, 2019–20 to 2023–2024 Seasons*
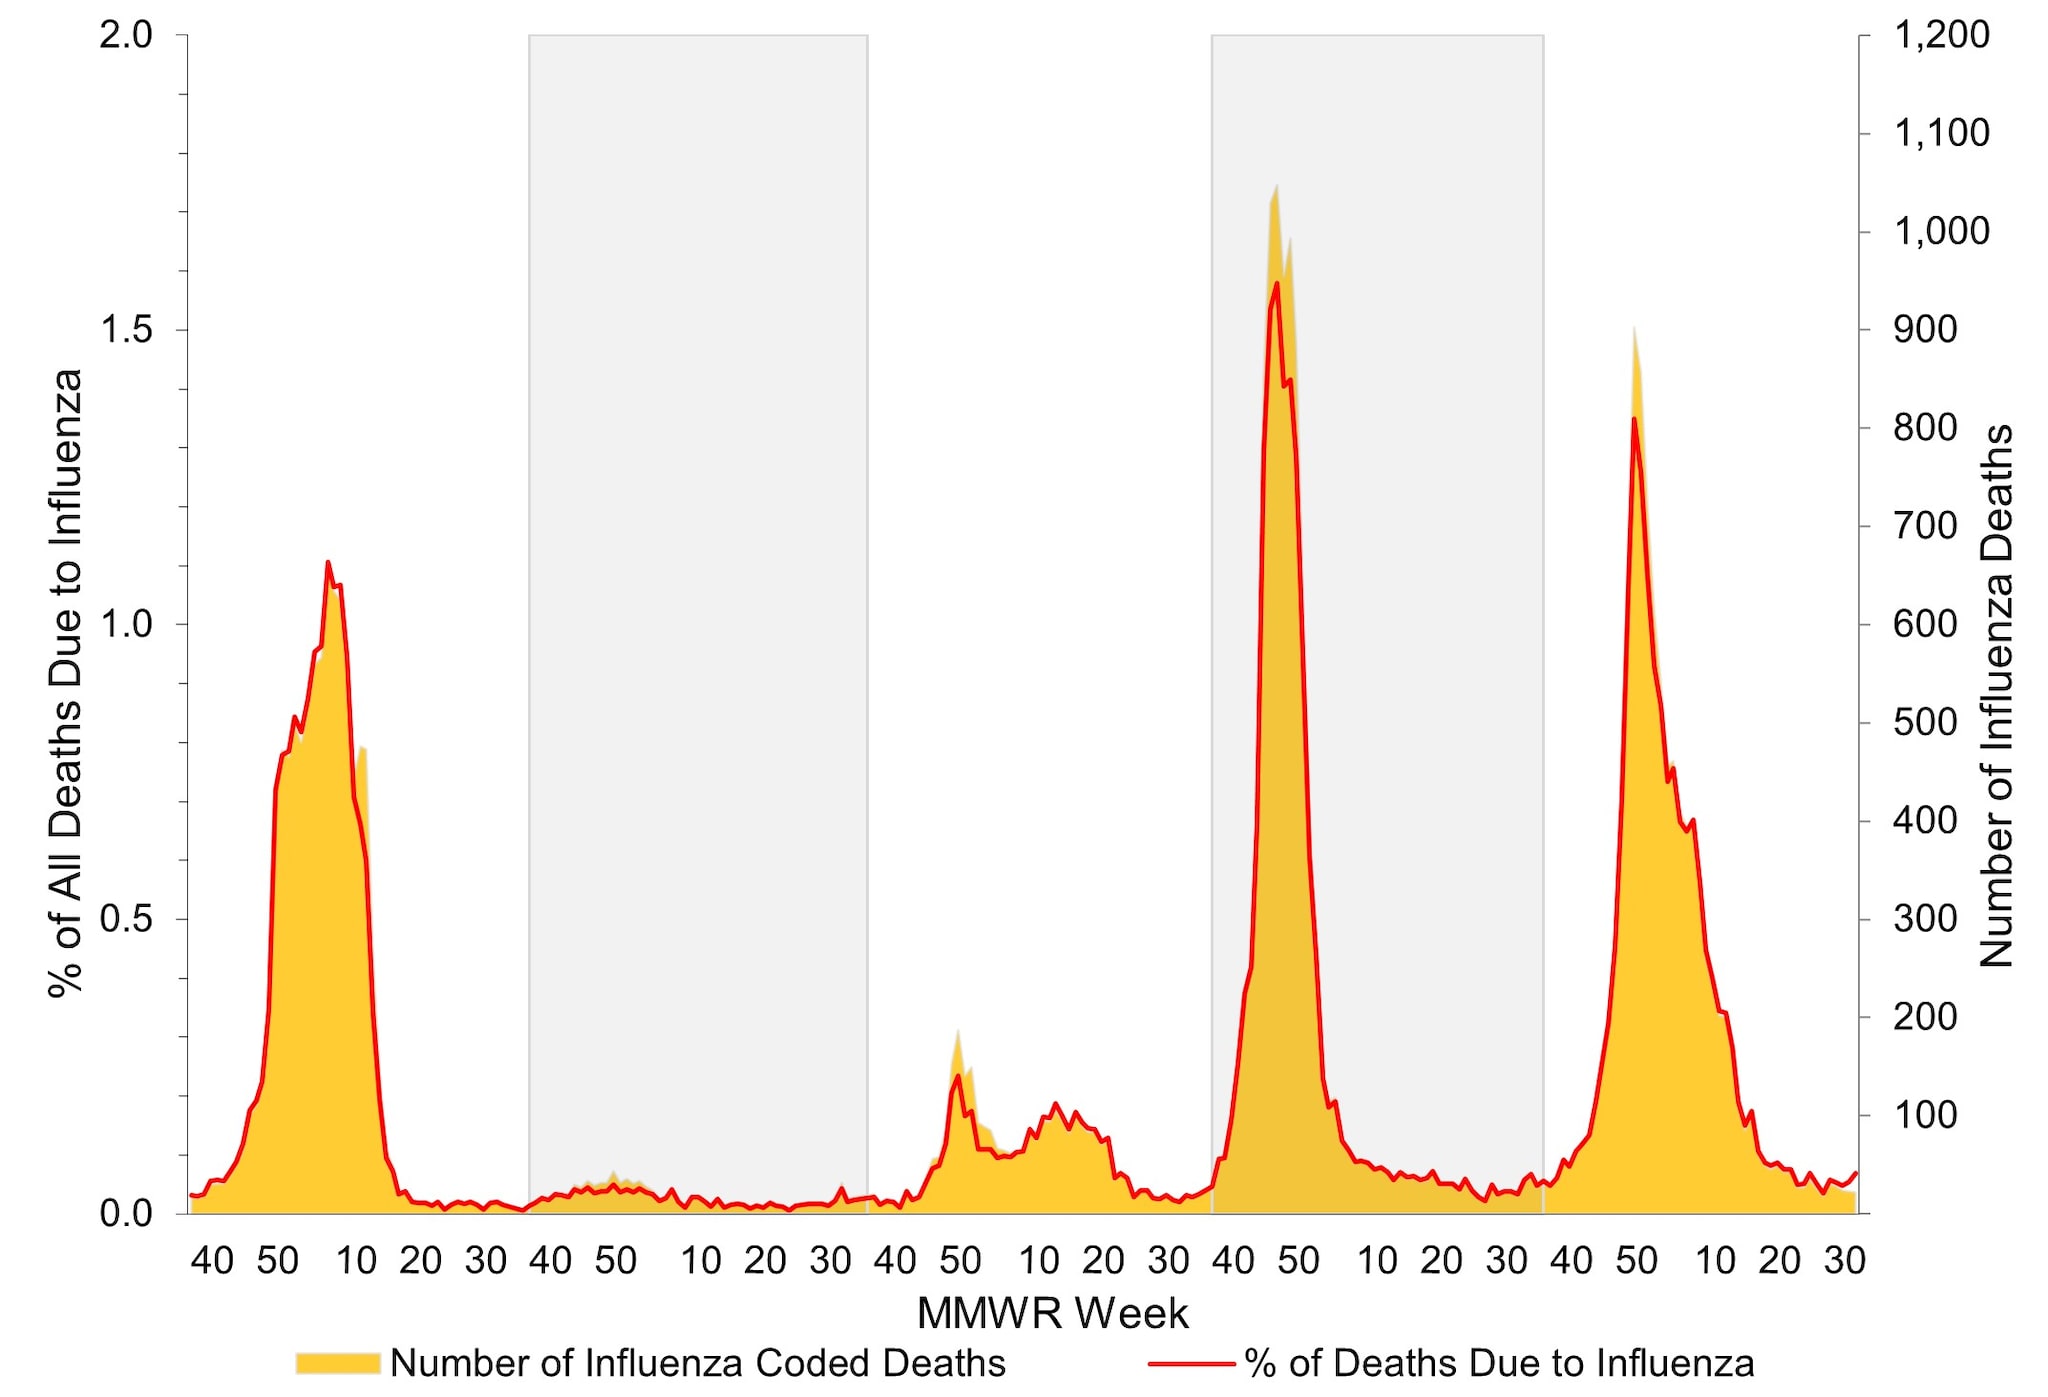
*Data presented are current as of September 9, 2024.
CDC monitors influenza-associated deaths in children younger than 18 years of age through the Influenza-Associated Pediatric Mortality Surveillance System1. During October 1, 2023 – August 31, 2024, a total of 197 laboratory-confirmed influenza-associated pediatric deaths were reported to CDC (Figure 12); this is nearly equal to the highest number of deaths reported during a seasonal influenza epidemic (199 deaths reported during the 2019–2020 season). Since influenza-associated deaths in children became a nationally notifiable condition in 2004, the total number of influenza-associated deaths among children during one season has ranged from 37 during the 2011–2012 season to 199 during the 2019–20 season. This season, 104 of the reported deaths were associated with influenza A viruses, 90 were associated with influenza B viruses, and 3 were associated with influenza A and B virus co-infection. Of 60 influenza A viruses with a reported subtype, 44 (73.3%) were influenza A (H1N1) and 16 (26.7%) were influenza A (H3N2). Fourteen deaths associated with influenza B viruses had a lineage reported, and all were B/Victoria lineage viruses. No pediatric deaths associated with influenza B/Yamagata have been reported since the 2017–2018 season. The mean age at death was 7 years (range = 4 weeks–17 years). Location of deaths were known for all children and adolescents; most (112 [56.9%]) died after hospital admission; 56 (28.4%) died in an emergency room; and 29 (14.7%) died outside of a hospital setting. Among the 187 children and adolescents with a known medical history, 93 (49.7%) had at least one underlying medical condition associated with higher risk for developing serious influenza-related complications7. Among the 157 children and adolescents who were eligible for influenza vaccination (age ≥6 months at date of illness onset) and for whom vaccination status was known, 130 (82.8%) were not fully vaccinated.
Figure 12. Number of Influenza-Associated Pediatric Deaths by Virus Type and Week of Death, 2020–2021 to 2023–2024 Seasons*
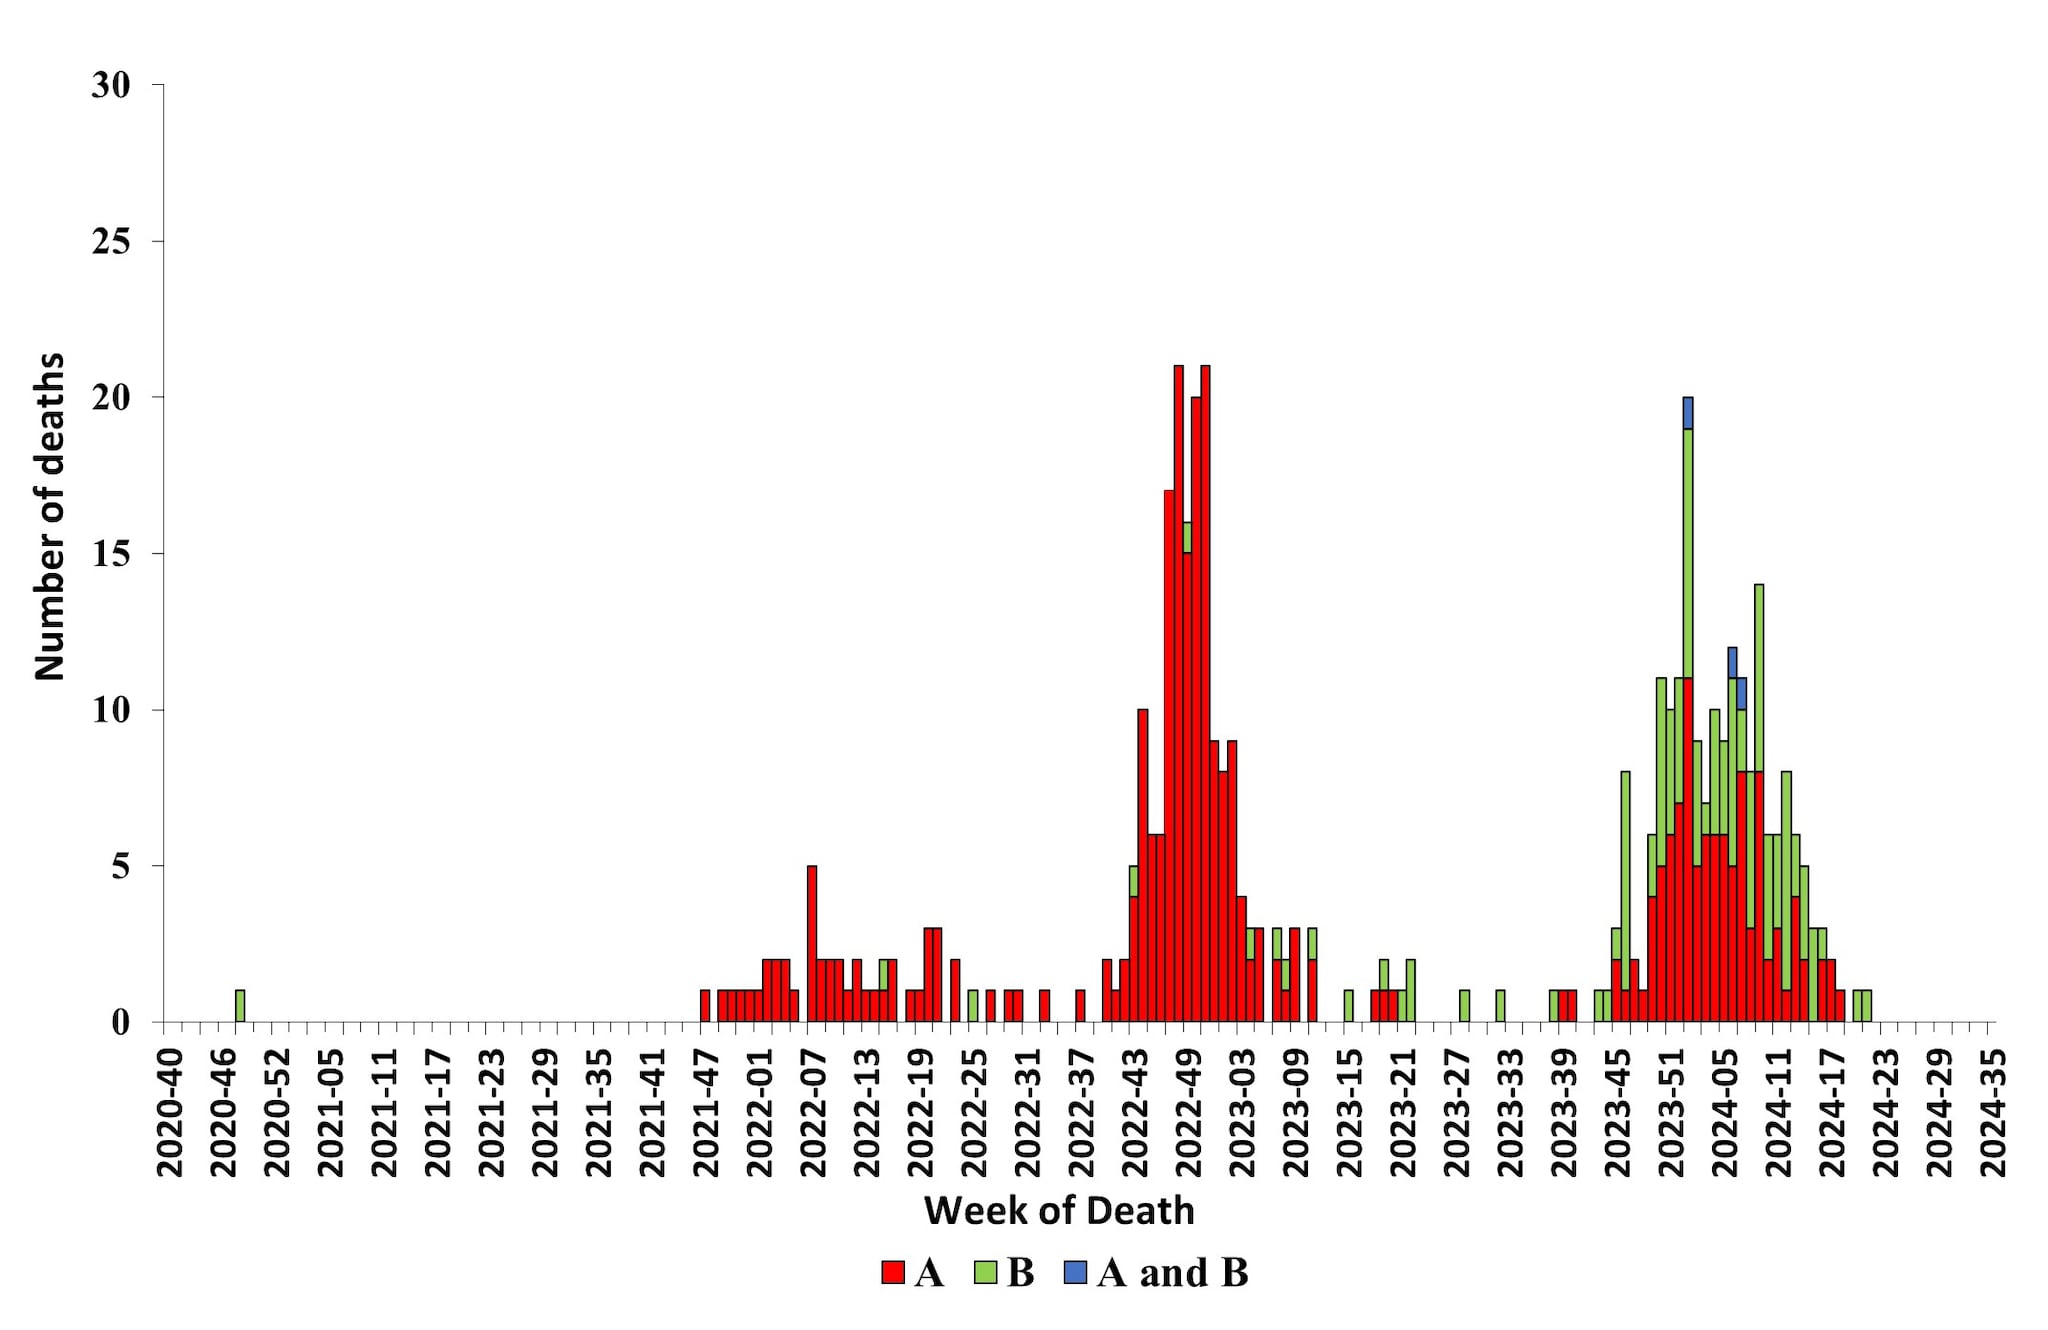
*Data shown are current as of September 9, 2024, and include deaths occurring until August 31, 2024. Additional pediatric deaths that occurred during this time period may continue to be reported as they are identified. The total number of deaths will be updated in FluView and on FluView Interactive as they are received.
Influenza Disease Burden and Prevented Burden from Vaccination
CDC does not know the exact number of people who have been sick and affected by influenza viruses because influenza virus infection is not a reportable disease in most areas of the United States. However, CDC uses a mathematical model to estimate the number of influenza illnesses, medical visits, hospitalizations, and deaths that occur each season8. Preliminary end of season estimates of influenza disease burden in the United States for the 2023–2024 season, from October 1, 2023 through April 30, 2024, show that influenza virus infection likely resulted in between 34 million–75 million symptomatic illnesses, 15 million-33 million medical visits, 380,000-900,000 hospitalizations, and 17,000-100,000 deaths. Older adults (≥65 years) accounted for 51% of hospitalizations and 68% of deaths.
In addition to estimating the disease burden, CDC also estimates the benefit of influenza vaccination by calculating the number of illnesses, medical visits, hospitalizations, and deaths that are prevented by vaccination. CDC uses a compartmental model to estimate the burden that would have occurred without vaccination and the burden that occurred with vaccination8. The difference between these two estimates is the vaccine prevented burden. During the 2023–2024 season (October 1, 2023 – April 30, 2024), influenza vaccine coverage ranged from 37% among those 18–49 years to 73% among older adults ≥65 years (FluVaxView: Weekly Flu Vaccination Dashboard) Influenza vaccine effectiveness in outpatient settings ranged from 34% to 64% depending on age group9. For the 2023–2024 season, CDC preliminarily estimates that influenza vaccination prevented between 7.4 million-15 million symptomatic illnesses, 3.6 million-7.4 million medical visits, 100,000-240,000 hospitalizations, and 3,500-34,000) deaths.
Both disease and prevented burden will be updated later in the calendar year and updated estimates will be posted to the CDC websites for disease burden and averted burden.
Seasonal Severity Assessment
Each season, CDC classifies influenza season severity at the end of each season using influenza virus activity data, including influenza-like illness, influenza hospitalization rates, and influenza deaths to compare to the same data from past seasons and to classify the severity of the influenza season10. Severity is classified across all age groups and for children, adults, and older adults. The severity of the 2023–2024 season was classified as moderately severe across all age groups and for children, adults, and older adults.
Influenza Activity in the Southern Hemisphere
Influenza follows a seasonal pattern in Southern Hemisphere countries, with activity usually occurring between April and September and sometimes lasting until October or November. Based on data collected and submitted by countries to the World Health Organization's FluNet system11, as of late-August 2024, influenza activity peaked and is declining in most Southern Hemisphere countries in South America, while activity in countries in Southern Africa and Oceania persists. In South America and Australia (which provides most of the data for the Oceania region), most influenza virus detections reported this season have been influenza A(H3N2) viruses, except in Ecuador where influenza B predominated. In Southern Africa, influenza A(H1N1)pdm09 viruses have predominated, though influenza B detections have increased in recent weeks.
In comparison to seasonal influenza trends observed before the COVID-19 pandemic, three South American countries—Argentina, Chile, and Uruguay—reported data suggesting an earlier start to their 2024 influenza seasons while the remaining countries reported timing of activity similar to what was observed before the COVID-19 pandemic. Most countries in South America, Southern Africa, and Oceania have had influenza activity reach moderate levels, in line with levels observed in prior seasons, though two countries experienced very high influenza virus detection levels: Chile and Zambia driven by circulation of A(H3N2) and co-circulation of A(H1N1)pdm09 and B/Victoria viruses, respectively. Influenza virus detections among individuals with severe acute respiratory infections (i.e., SARI cases, defined as a hospitalized case reporting a cough and fever, with symptom onset in the last 10 days) reached very high levels in Chile and Zambia, and high levels in Uruguay, Ecuador, and South Africa1213.
Of note, Ghana, Senegal, and Lao People's Democratic Republic, which are tropical countries in the Northern Hemisphere, have reported higher levels of influenza detections than expected for this time of year compared to seasonal influenza trends observed before the COVID-19 pandemic.
Discussion
The 2023–2024 influenza season in the United States is considered moderately severe with an estimate of at least 34 million symptomatic illnesses, 15 million medical visits, 380,000 hospitalizations, and 17,000 deaths caused by influenza virus infection. The predominant influenza virus overall during the 2023–2024 influenza season was influenza A(H1N1)pdm09. However, as A(H1N1)pdm09 activity declined, A(H3N2) and B/Victoria virus activity continued to increase for several more weeks and, each were identified more frequently than A(H1N1)pdm09 viruses from early March until mid-May. From June through August, influenza A(H1N1)pdm09 and A(H3N2) viruses co-circulated and influenza B viruses were reported in small numbers. Eight of the previous 25 seasons (1997–98 through 2022–2023, excluding the 2020–2021 season due to low influenza virus circulation), were characterized by A(H1N1) as the predominant virus (5 were A(H1N1)pdm09 and 3 were the older A(H1N1) viruses); the predominant virus was influenza A(H3N2) during 16 seasons and equal proportions A(H1N1) and B in one season. Eleven seasons during this 25-year time period had two waves of influenza activity; influenza B was responsible for the second wave in 8 (73%) of those seasons (seven following A(H3N2) activity and one following A(H1N1) activity). Three seasons had a second wave of influenza A activity (two A(H3N2) and one A(H1N1)pdm09, all occurring since the 2018–2019 season.
Most (75% – 100%) of the influenza viruses genetically and antigenically characterized were in the same genetic subclade as, and antigenically similar to, the vaccine reference viruses included in the season's influenza vaccine. Almost all (>99.7%) of the influenza viruses collected and tested for antiviral resistance by CDC, were susceptible to zanamivir, peramivir, oseltamivir, and baloxavir .
The level of influenza activity this season and during the 2022–2023 influenza season was more similar to those seen prior to the COVID-19 pandemic than what was observed in the two seasons immediately after the emergence of SARS-CoV-2 (2020–2021 and 2021–2022). The peak percentage of specimens testing positive for influenza (18.3%) as reported to CDC from clinical laboratories nationally was slightly less than the average peak percentage positive (26.5%) during the five influenza seasons (2015–2016 – 2019–2020) immediately preceding the COVID-19 pandemic, but this could be influenced by the addition of another virus causing significant respiratory illness. Compared to the most recent pre-COVID seasons, the cumulative rate of influenza-associated hospitalizations as reported in FluSurv-NET this season was higher than all but one season (2017–2018 season).
Mortality attributed to influenza this season also was similar to the 2022–2023 influenza season and to what was seen in the most recent pre-COVID seasons. The peak percentage of deaths this season (1.4%) was slightly less than the 2022–2023 season (1.6%), but much more similar to pre-pandemic levels than the 2020–2021 (0.05%) and 2021–2022 seasons (0.2%). The number of pediatric deaths reported this season (197) is the second highest number of pediatric deaths attributed to influenza since the 2004–2005 season, excluding the 2009 influenza pandemic, when it became a nationally notifiable condition. The highest number of reported pediatric deaths due to influenza occurred during the 2019–20 season (199).
For the first time since the COVID-19 pandemic, the timing of peak influenza activity occurred within the range of what was expected based on pre-COVID-19 activity (more than 80% of seasons between 1997–98 and 2019–20 peaked between late December and late February) and activity returned to low levels by mid-May. During the 2022–2023 season, influenza activity peaked earlier than expected (early December) and the 2021–2022 season continued longer than expected (through mid-June).
While not always a predictor of the subsequent Northern Hemisphere influenza season, Southern Hemisphere activity in the summer is often considered when planning for what could be expected during the subsequent Northern Hemisphere influenza season. However, due to continued varied influenza activity among Southern Hemisphere countries, different influenza viruses predominating in different parts of the world, and the possibility of variations in population immunity between the Northern and Southern Hemispheres, Southern Hemisphere activity cannot be used to definitively predict the timing or intensity of influenza activity in the United States this fall and winter.
Though influenza activity has remained low in the summer, maintaining vigilance for influenza virus infections in the United States year-round is important. Sporadic seasonal influenza virus infections and novel influenza A virus infections associated with exposure to swine during animal exhibitions often are reported during the summer months6. In addition, outbreaks of highly pathogenic avian influenza A(H5N1) virus continue among dairy cows, poultry, and other animals, so it is important that providers and persons with exposure to sick or infected birds, cows, or other livestock remain attentive to any new symptoms, including conjunctivitis, that could be consistent with influenza virus infection6. Patients with suspected novel influenza A virus infection should isolate at home away from household members and not go to work or school until they are proven not to be infected with a novel influenza A virus or have recovered from their illness. Specimens from patients with suspected novel influenza A virus infection should be collected and referred to state public health departments for testing and treatment with influenza antiviral medications should be initiated immediately1415.
While we do not know exactly what the coming influenza season will look like, influenza causes a significant public health burden in the United States every winter. For persons aged ≥6 months, receiving a seasonal influenza vaccine each year remains the best way to protect against seasonal influenza and its potentially severe consequences. There are also everyday preventive actions, including avoiding close contact with people who are sick, limiting contact with others if sick, and covering coughs and sneezes, that can help reduce the spread of influenza. Influenza antiviral drugs are another way to minimize the impact of influenza this coming season. CDC recommends initiating influenza antiviral drug treatment as soon as possible for patients with confirmed or suspected influenza virus infection who have severe, complicated, or progressive illness; who require hospitalization; or who are at increased risk for influenza-associated complications15. Four influenza antiviral drugs approved by the Food and Drug Administration are currently recommended for use in the United States.
Influenza surveillance reports for the United States are posted online weekly(Weekly US Influenza Surveillance Report) Additional information regarding influenza viruses, surveillance, vaccines, antiviral medications, and novel influenza A infections in humans is available online (Influenza (Flu)).
Contributors: A Colón, MPH. S Moon, PhD, MPH. P Daly, MPH. A Merced-Morales, MPH. K Reinhart, PhD, MPH. B Winterton, DVM, MPH. J Barnes, PhD. AD Iuliano, PhD, MPH. C Bozio, MPH. S Garg, MD, A O'Halloran, MSPH. J Steel, PhD. D Ujamaa, MPH. C Castagna-McLeod, MPH. T Davis, PhD. L Gubareva, PhD. N Dempster, MPH. D Hawkins, MPH. A Howa, MPH. S Huang, MPH. YC Pun, MPH. R Smith, MPH. M Kirby, PhD. L Duca, PhD. E Zeno, PhD, MPH. P Marcenac, PhD MS. R Kondor, PhD. K Kniss, MPH. A Budd, MPH; Influenza Division.
Acknowledgements:
State, county, city, and territorial health departments and public health laboratories; U.S. World Health Organization collaborating laboratories; National Respiratory and Enteric Virus Surveillance System laboratories; U.S. Outpatient Influenza-Like Illness Surveillance Network sites; Influenza Hospitalization Surveillance Network (FluSurv-NET) sites; the National Center for Health Statistics, CDC; Anwar Abd Elal, Ha Nguyen, Philippe Pascua, Mira Patel, Shannon Crenshaw, Angie Foust, Gabriela Jasso, Melissa Lange, Justine Lyons, Kyung Park, Nicholas Pearce, Thomas Rowe, Wendy Sessions, Svetlana Shcherbik, Ansley Smith, Catherine Smith, Norman Hassell, Sandra Mathew, Roopa Nagilla , Jimma Liddell, Kay Radford, Phili Wong, , Juliana DaSilva, Lisa Keong, Julia Fredrick, Sydney Sheffield, Ewelina Lyszkowicz, Matthew Gilmer, Sarabeth Mathis, Ryan Threlkel, Sinead Morris, Ben Natkin, Influenza Division, National Center for Immunization and Respiratory Diseases, CDC.
- U.S. Influenza Surveillance: Purpose and Methods. (2023, October 13). Center for Disease Control and Prevention. Retrieved August 13, 2024, from https://www.cdc.gov/flu/weekly/overview.htm
- Recommended composition of influenza virus vaccines for use in the 2024–2025 northern hemisphere influenza season. (2024, February 23). World Health Organization. Retrieved August 20, 2024, from https://www.who.int/publications/m/item/recommended-composition-of-influenza-virus-vaccines-for-use-in-the-2024-2025-northern-hemisphere-influenza-season
- 184th Vaccines and Related Biological Products Advisory: Summary Minutes. (2024, March 5). U.S. Food & Drug Administration. Retrieved on August 20, 2024, from: https://www.fda.gov/media/177612/download
- Use of Trivalent Vaccines for the 2024–2025 U.S. Influenza Season. (2024, March 5). U.S. Food & Drug Administration. Retrieved on August 20, 2024: https://www.fda.gov/vaccines-blood-biologics/lot-release/use-trivalent-influenza-vaccines-2024-2025-us-influenza-season
- Detections of Highly Pathogenic Avian Influenza. (2024, August). U.S. Food & Drug Administration. Retrieved on August 23, 2024: https://www.aphis.usda.gov/livestock-poultry-disease/avian/avian-influenza/hpai-detections
- Clinician Brief: Evaluating and Managing Patients Exposed to Animals or Persons Infected with Novel Influenza A Viruses of Public Health Concern. (2024, September 18). Centers for Disease Control and Prevention. Retrieved September 27, 2024. https://www.cdc.gov/bird-flu/hcp/clinicians-evaluating-patients/index.html
- Flu & Children at Higher Risk. (2024, March 22). Centers for Disease Control and Prevention. Retrieved September 6, 2024. https://www.cdc.gov/flu/highrisk/children-high-risk.htm
- How CDC Estimates the Burden of Seasonal Flu in the United States. (2019, November). Centers for Disease Control and Prevention. Retrieved on August 22, 2024: https://www.cdc.gov/flu-burden/php/about/how-cdc-estimates.html?CDC_AAref_Val=https://www.cdc.gov/flu/about/burden/how-cdc-estimates.htm
- CDC Seasonal Flu Vaccine Effectiveness Studies. (2024, August). Centers for Disease Control and Prevention. Retrieved on August 22, 2024: https://www.cdc.gov/flu-vaccines-work/php/effectiveness-studies/
- How CDC Classifies Flu Severity each Season in the United States. (2024, January). Centers for Disease Control and Prevention. Retrieved on August 22, 2024: https://www.cdc.gov/flu/about/cdc-classifies-flu-severity-in-us.html
- Influenza surveillance outputs. (2024). World Health Organization. Retrieved August 19, 2024: https://www.who.int/teams/global-influenza-programme/surveillance-and-monitoring/influenza-surveillance-outputs
- Influenza, SARS-CoV-2, RSV, and other Respiratory Viruses Regional Situation. (2024, August). Pan American Health Organization. Retrieved August 14, 2024: https://www.paho.org/en/influenza-situation-report
- Weekly Respiratory Pathogens Surveillance Report. (2024, August). South Africa National Institute for Communicable Diseases. Retrieved August 19, 2024: https://www.nicd.ac.za/diseases-a-z-index/disease-index-covid-19/surveillance-reports/weekly-respiratory-pathogens-surveillance-report-week/
- Treatment of Variant Influenza Virus (2024, June). Centers for Disease Control and Prevention. Retrieved on September 27. https://www.cdc.gov/swine-flu/treatment/index.html
- Flu: What To Do If You Get Sick (2024, March). Centers for Disease Control and Prevention. Retrieved on August 23, 2024. https://www.cdc.gov/flu/treatment/takingcare.htm
- Influenza Virologic Surveillance Right Size Roadmap, 2nd (2022, October). Association on Public Health Laboratories. Retrieved on August 23, 2024. https://www.aphl.org/aboutAPHL/publications/Documents/ID-Influenza-Right-Size-Roadmap-Edition2.pdf
- Variant Influenza Viruses: Background and CDC Risk Assessment and Reporting (2024, June). Centers for Disease Control and Prevention. Retrieved on August 23, 2024. https://www.cdc.gov/flu/swineflu/variant.htm