Forecasts of Flu Hospital Admissions as of January 3, 2024
Updated January 5, 2024
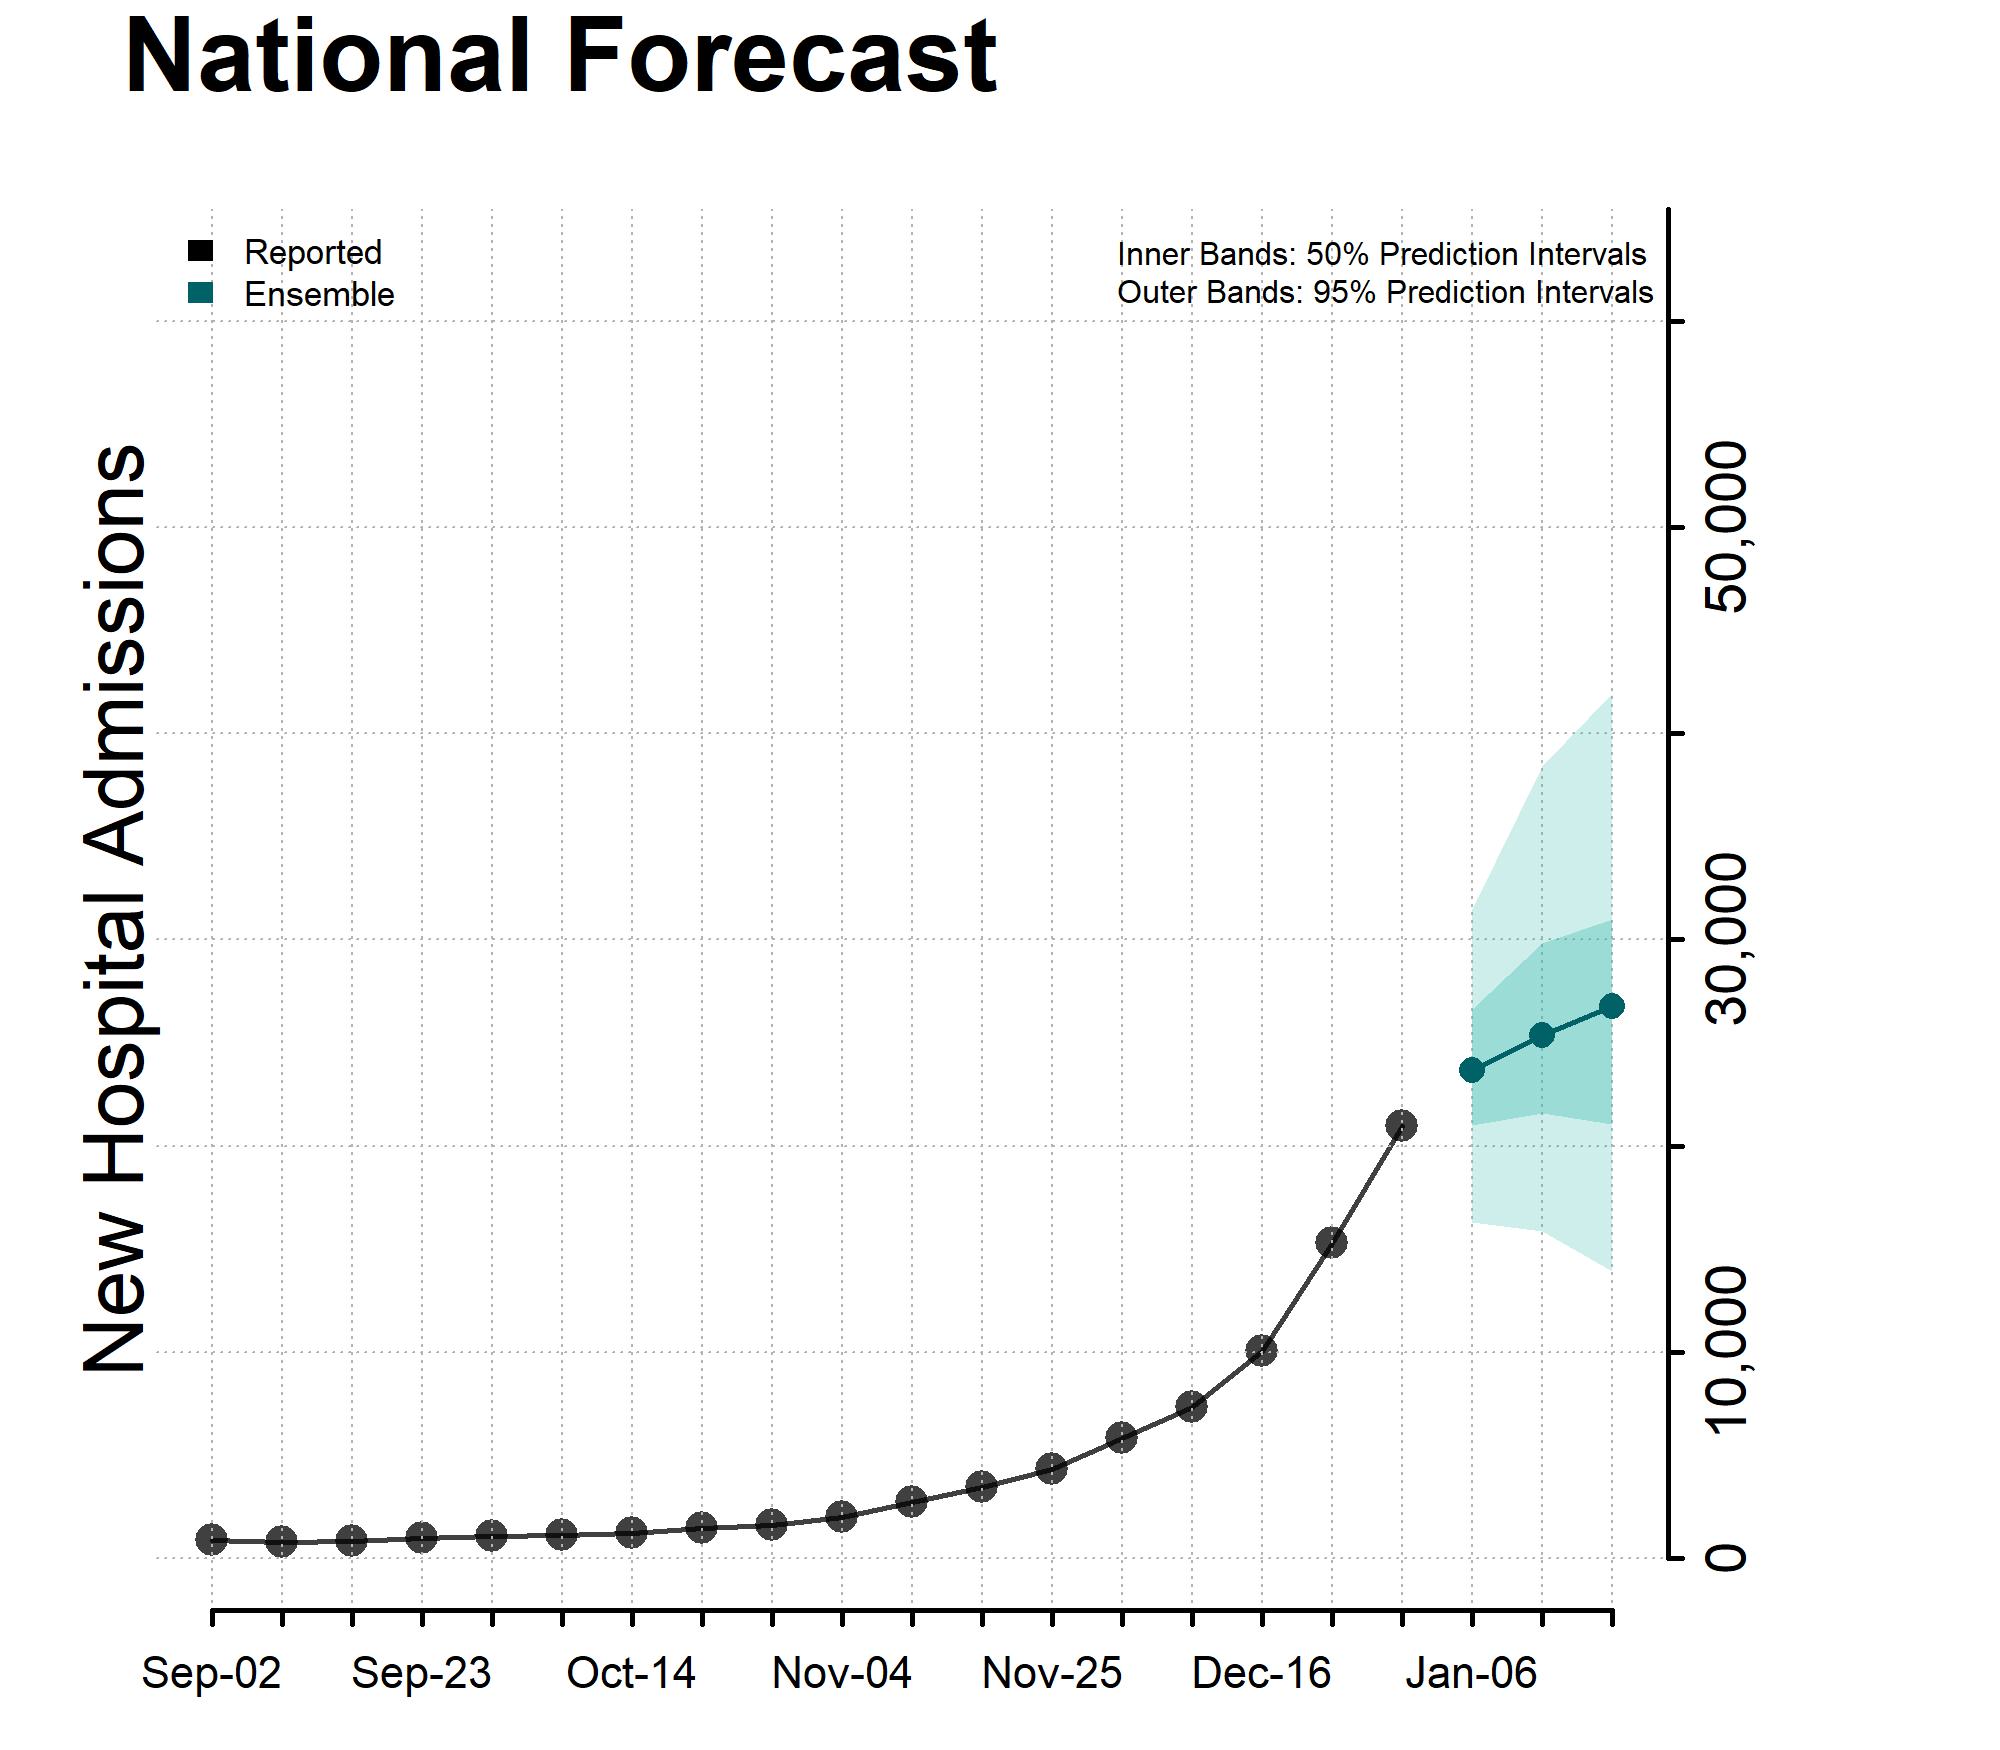
Reported and forecasted new influenza hospital admissions as of January 3, 2024.
Interpretation of Forecasts of New Hospital Admissions
- This week’s ensemble predicts that the number of new weekly laboratory confirmed influenza hospital admissions will remain stable or have an uncertain trend nationally, with 14,000 to 42,000 laboratory confirmed influenza hospital admissions likely reported in the week ending January 20, 2024.
- This week, 24 modeling groups contributed 29 forecasts that were eligible for inclusion in the ensemble forecasts for at least one jurisdiction. Contributing teams are listed below.
- Current forecasts may be impacted by delays in reporting due to the holidays and should be interpreted with caution.
- Ensemble forecasts combine forecasts from diverse models into one forecast. They have been among the most reliable forecasts in performance for previous influenza and COVID-19 forecasting efforts, but even the ensemble forecasts may not reliably predict rapid changes.
- The figure shows the number of new laboratory confirmed influenza hospital admissions reported in the United States each week from September 1 through December 30 and forecasted new influenza hospital admissions per week for this week and the next 2 weeks, through January 20. Hospitals are required to report daily laboratory-confirmed influenza hospitalizations to HHS Protect. See COVID-19 Guidance for Hospital Reporting and FAQs [680 KB, 52 pages] for additional details on this guidance.

State Forecasts
State-level forecasts show the predicted number of new laboratory confirmed influenza hospital admissions per week for this week and the next 2 weeks by state. Each state forecast figure uses a different scale due to differences in the number of new influenza hospital admissions per week between states and only forecasts included in the ensemble are shown. Plots of the state-level ensemble forecasts and the underlying data can be downloaded below.
Download state forecasts [827 KB, 14 pages]
Download all forecast data [XLS – 397 KB]
Additional forecast data and information about submitting forecasts are available at https://github.com/cdcepi/FluSight-forecast-hub.
Contributing Teams and Models
- California Department of Public Health (CADPH) (Model: FluCAT)
- Carnegie Mellon Delphi Group (Model: CMU-TimeSeries)
- Center for Forecasting and Outbreak Analytics (CFA/CDC); renewal model team (Model: cfa-flu-epidemia-light)
- Center for Forecasting and Outbreak Analytics (CFA/CDC); SEIR model team (Model: flu-mechanistic)
- CEPH Lab at Indiana University (Model: Rtrend_fluH)
- Columbia University (Model: CU-ensemble)
- Fogarty International Center, National Institutes of Health (NIH) (Model: Flu_ARIMA)
- Georgia Institute of Technology (Model: GT-FluFNP)
- Iowa State Niemi Research Lab (Model: Nonlinear ASG Hierarchical)
- Los Alamos National Lab and Northern Arizona University (Model: LosAlamos_NAU-CModel_Flu)
- LU Computational Uncertainty Lab (Model: Chimera)
- MIGHTE (Model: Nsemble)
- MOBS Lab at Northeastern (Model: MOBS-GLEAM_FLUH)
- Northeastern University & University of California San Diego (Model: GLEAM_AI_FLUH)
- Norwegian Institute of Public Health – Fjordhest (Model: fjordhest-ensemble)
- Predictive Science Inc (Model: PSI-PROF)
- Signature Science (Model: SigSci-CREG)
- Signature Science (Model: SigSci-TSENS)
- Stevens Institute of Technology (Model: Gradient Boosting Regressors)
- UNC Infectious Disease Dynamics (Model: InfluPaint)
- University of Georgia Center for the Ecology of Infectious Diseases Forecasting Working Group (Model: Copycat)
- University of Georgia Center for the Ecology of Infectious Diseases Forecasting Working Group (Model: INFLAenza)
- University of Guelph Dynamics Training Lab (Model: Composite Curve)
- University of Guelph Dynamics Training Lab (Model: GRYPHON)
- University of Massachusetts-Amherst (Model: UMass-trends_ensemble)
- University of Massachusetts-Amherst (Model: flusion)
- University of Michigan, Computer Science and Engineering (Model: DeepOutbreak)
- University of Virginia, Biocomplexity Institute (Model: UVAFluX-Ensemble)
- Virginia Tech, Sanghani Center for Artificial Intelligence and Data Analytics (Model: Ensemble Model)
