At a glance
- CDC collects national wastewater data for variants of SARS-CoV-2 (the virus that causes COVID-19).
- CDC updates this data monthly. This allows for data to be reviewed for accuracy.
- Data may change as more reports are received.
National data
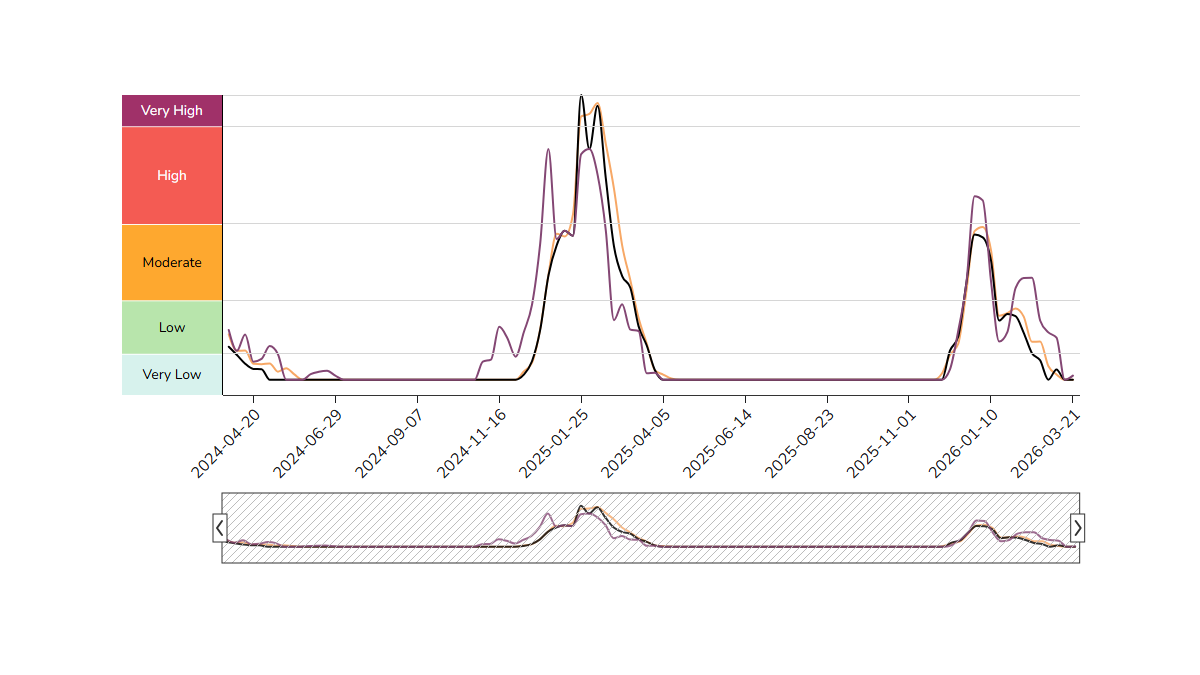
This chart shows the average relative proportions of SARS-CoV-2 variants in wastewater at the national level.
About the data
This chart shows proportions of SARS-CoV-2 variants and sublineages in wastewater over time for contributing wastewater treatment plants with reported sequencing data by collection week. The proportion of SARS-CoV-2 variants in each sequenced sample were assigned using Freyja and averaged nationally. All lineages not enumerated are aggregated with their parent lineages, based on the Pango statement of nomenclature rules. Any variants making up less than 5% of the national weekly average were categorized into the "Other" category. These data are not from clinical specimens, but this information complements other systems used to track the emergence and prevalence of variants in US communities. See Variants and Genomic Surveillance for more information.
Predominant variant refers to the most abundant variant collected during the week that was three weeks before the current one, to allow for lags in sequencing. Data from the most recent weeks may be incomplete due to delays in data reporting, and the proportions for previous weeks may change as more data are reported. Certain geographic areas have a higher density of sampling sites, limiting the ability to generalize these results regionally or nationally.