What to know
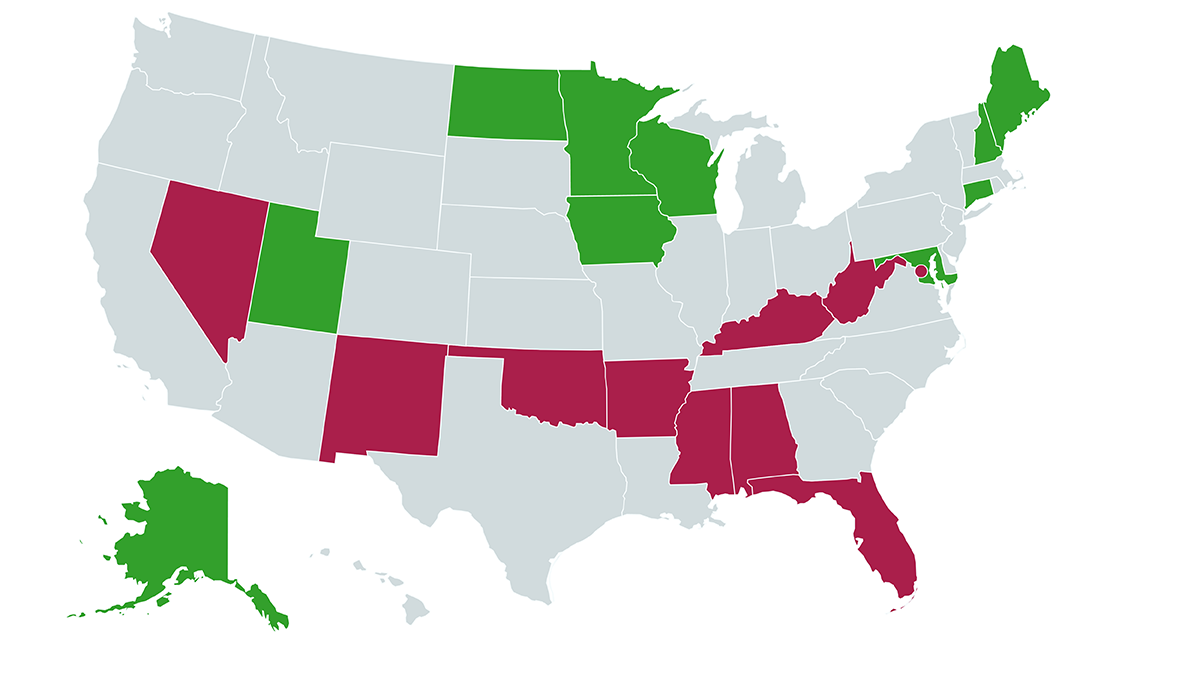
See which states have the highest and lowest prevalence rates of visual acuity loss or blindness based on VEHSS composite prevalence estimates.

Ten states with the highest rates of visual acuity loss
- The state with the highest prevalence rate is West Virginia, where more than 1 in 30 residents have visual acuity loss.
- Mississippi, Washington (DC), Arkansas, New Mexico, Oklahoma, Kentucky, Alabama, Nevada, and Florida have the next highest prevalence rates of visual acuity loss, ranging from 2.7% to 3.3%.
Ten states with the lowest rates of visual acuity loss
- The state with the lowest rate of visual acuity loss is Maine, where 1 in 75 residents suffer vision loss.
- Utah, Iowa, North Dakota, Alaska, Minnesota, Maryland, Connecticut, New Hampshire, and Wisconsin round out the rest of the top 10 states with the lowest rates of visual acuity loss.
Data and methods
- These data are from VEHSS composite prevalence estimates, which use multiple sources of data available in VEHSS to estimate how many people have visual acuity loss of 20/40 or worse in their better-seeing eye that cannot be corrected with glasses or contacts.
- This type of vision loss is measured using an eye chart and is usually caused by age-related eye diseases such as age-related macular degeneration, cataract, diabetic retinopathy, and glaucoma.
- These estimates do not include other types of vision loss such as contrast sensitivity or visual field loss.
- These rates represent crude prevalence estimates, meaning that they represent the actual percentage of the population estimated to have visual acuity loss.
Keep Reading:
Why Vision Loss is a Public Health Problem
Explore these data in the VEHSS data explorer
You can explore these estimates and other data in detail in the VEHSS data explorer:
- Select Vision Problems and Blindness -> Vision Loss and Blindness -> VEHSS Composite Prevalence Estimate: Visual Acuity Loss.
- Then choose either blindness or any visual acuity loss, and standard or detailed age groups.
- National, state, and county estimates are available by age, sex, and race/ethnicity.
- You can also show either crude or adjusted prevalence estimates by selecting the appropriate Data Type filter.
