At a glance

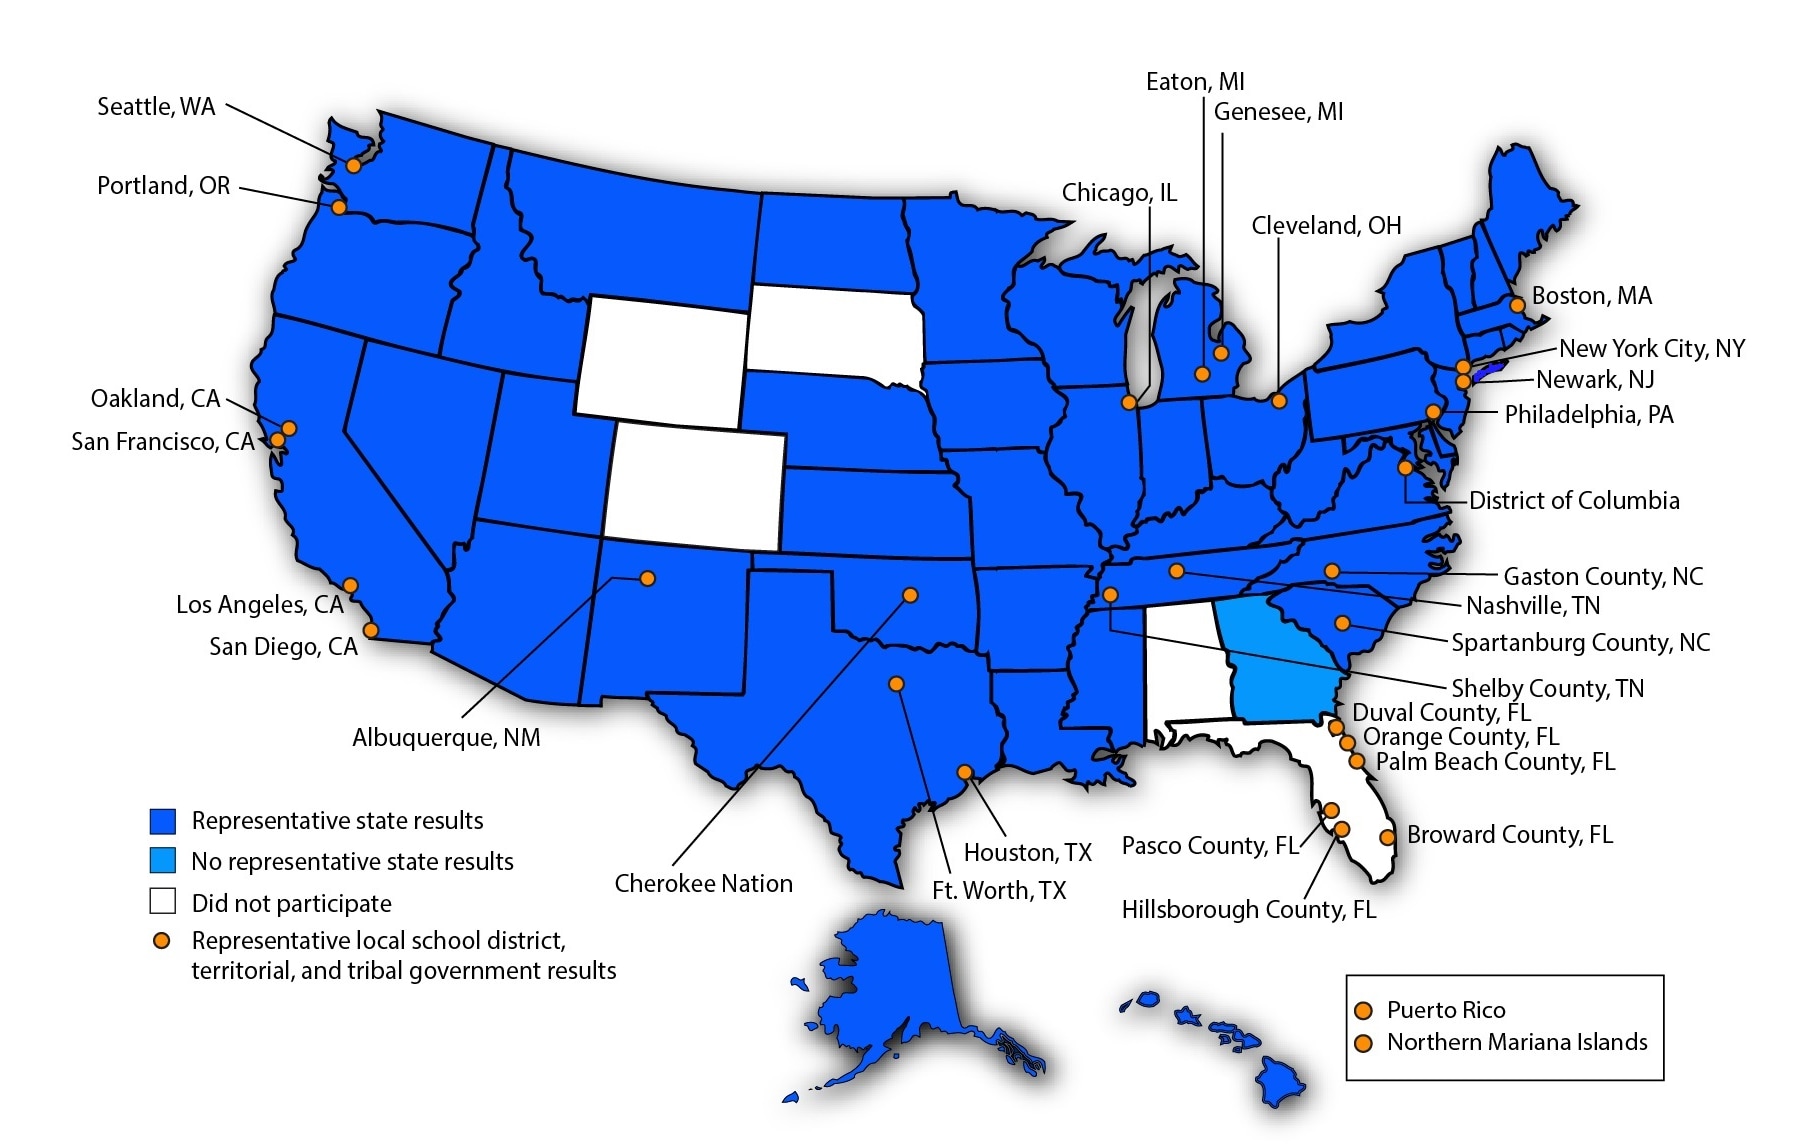
2022 participation map
This map illustrates states, territories, tribal governments, and school districts that participated in the School Health Profiles in 2022. Sites with representative1 and no representative2 results are shown.

Note
- If at least 70% of the principals or lead health education teachers in the sample completed the survey, the data are weighted to be representative. That "representative" label applies to all: a state, large urban school district, tribal government, or territory. With weighted, representative data, it is possible to say, for example, "X% of schools in our state offer students intramural activities or physical activity clubs."
- Nonrepresentative data represent only the schools that completed the questionnaire.
Representative
- Alabama
- Alaska
- Arizona
- Arkansas
- Connecticut
- Delaware
- Florida
- Georgia
- Hawaii
- Idaho
- Illinois
- Indiana
- Iowa
- Kansas
- Kentucky
- Louisiana
- Maine
- Maryland
- Massachusetts
- Michigan
- Minnesota
- Mississippi
- Missouri
- Montana
- Nebraska
- Nevada
- New Hampshire
- New Mexico
- New York
- North Carolina
- North Dakota
- Ohio
- Oklahoma
- Oregon
- Pennsylvania
- Rhode Island
- South Carolina
- Tennessee
- Texas
- Utah
- Vermont
- Virginia
- Washington
- West Virginia
- Albuquerque, NM
- Boston, MA
- Broward County, FL
- Chicago, IL
- Cleveland, OH
- District of Columbia
- Duval County, FL
- Eaton, MI
- Fort Worth, TX
- Gaston County, NC
- Genesee, MI
- Hillsborough County, FL
- Houston, TX
- Los Angeles, CA
- Nashville, TN
- New York, NY
- Newark, NJ
- Oakland, CA
- Orange County, FL
- Palm Beach County, FL
- Pasco County, FL
- Philadelphia, PA
- Portland, OR
- San Diego, CA
- San Francisco, CA
- Seattle, WA
- Shelby County, TN
- Spartanburg, SC
- Puerto Rico
- Cherokee Nation
Participation history tables
Participation History & Data Quality, 1998-2022
Note: In addition, the tables show whether CDC has been given permission to distribute the data files from each jurisdiction.
