At a glance
- View hearing loss statistics among wholesale and retail trade (WRT) workers.
- Approximately 12% of all Wholesale Trade workers and 12% of all Retail Trade workers have hearing difficulty.
- About 6% of all Wholesale Trade workers and 7% of all Retail Trade workers have tinnitus.
- 51% of noise-exposed Wholesale Trade workers and 74% of noise-exposed Retail Trade workers report not wearing hearing protection.

Noise, ototoxic chemicals, and hearing protection
- About 19% of all workers in Wholesale Trade and 11% of all workers in Retail Trade have been exposed to hazardous noise in the last year.1
- Approximately 20% of all workers in Wholesale Trade and 10% of all workers in Retail Trade have been exposed to ototoxic chemicals in the last year.1 These chemicals can cause damage to different parts of the ear.
- About 8% of all workers in Wholesale Trade and 5% of all workers in Retail Trade have been exposed to both hazardous noise and ototoxic chemicals in the last year.1
- 51% of noise-exposed Wholesale Trade workers and 74% of noise-exposed Retail Trade workers report not wearing hearing protection.2
Hearing loss and tinnitus
- Approximately 12% of all Wholesale Trade workers and 12% of all Retail Trade workers have hearing difficulty.1
- About 6% of all Wholesale Trade workers and 7% of all Retail Trade workers have tinnitus, which is an annoying buzzing, rushing, or ringing noise in your ears or in your head.3
- About 20% of noise-exposed tested WRT workers have a material hearing impairment.4 Hearing impairment is hearing loss that impacts day-to-day activities. Material hearing impairment is hearing loss severe enough that a person has difficulty understanding speech.
- 13% of noise-exposed tested WRT workers have hearing impairment in both ears.5
Trends
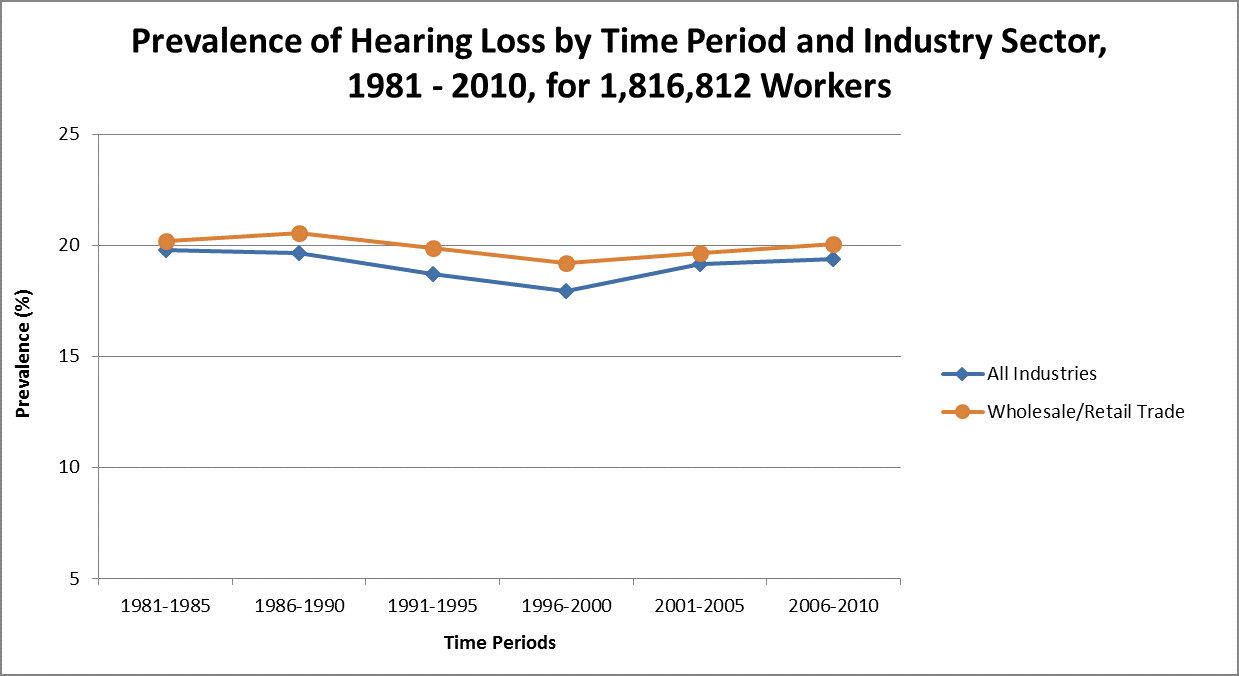
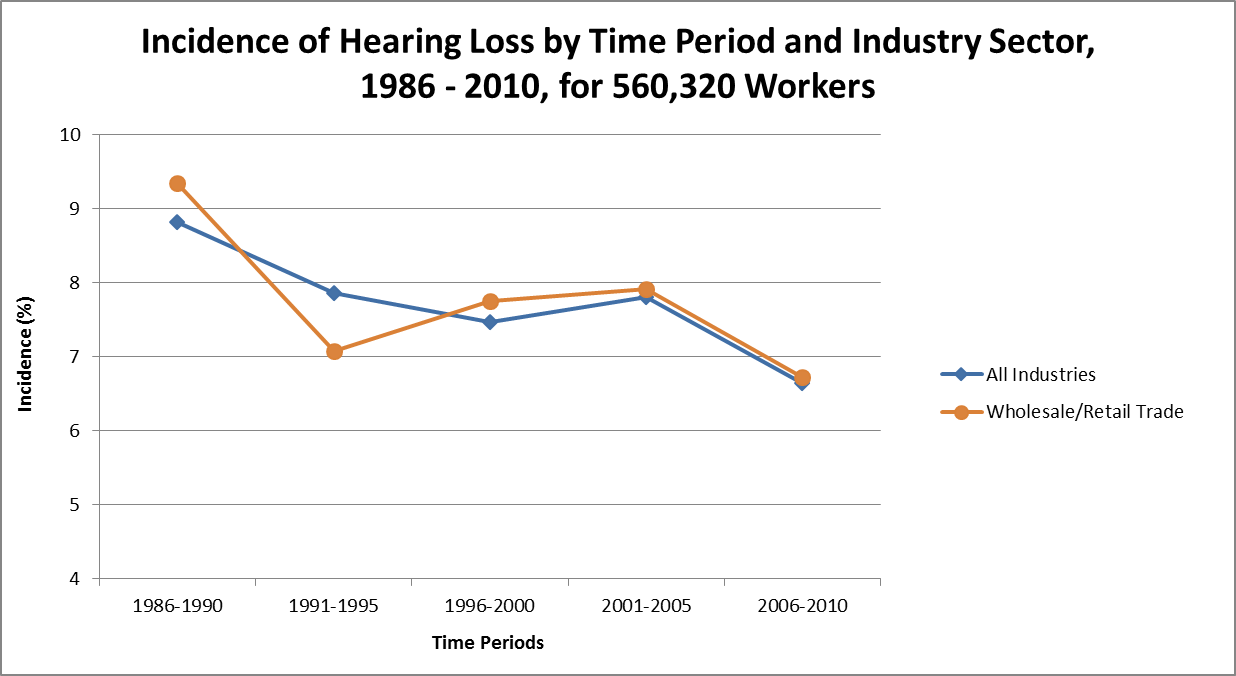
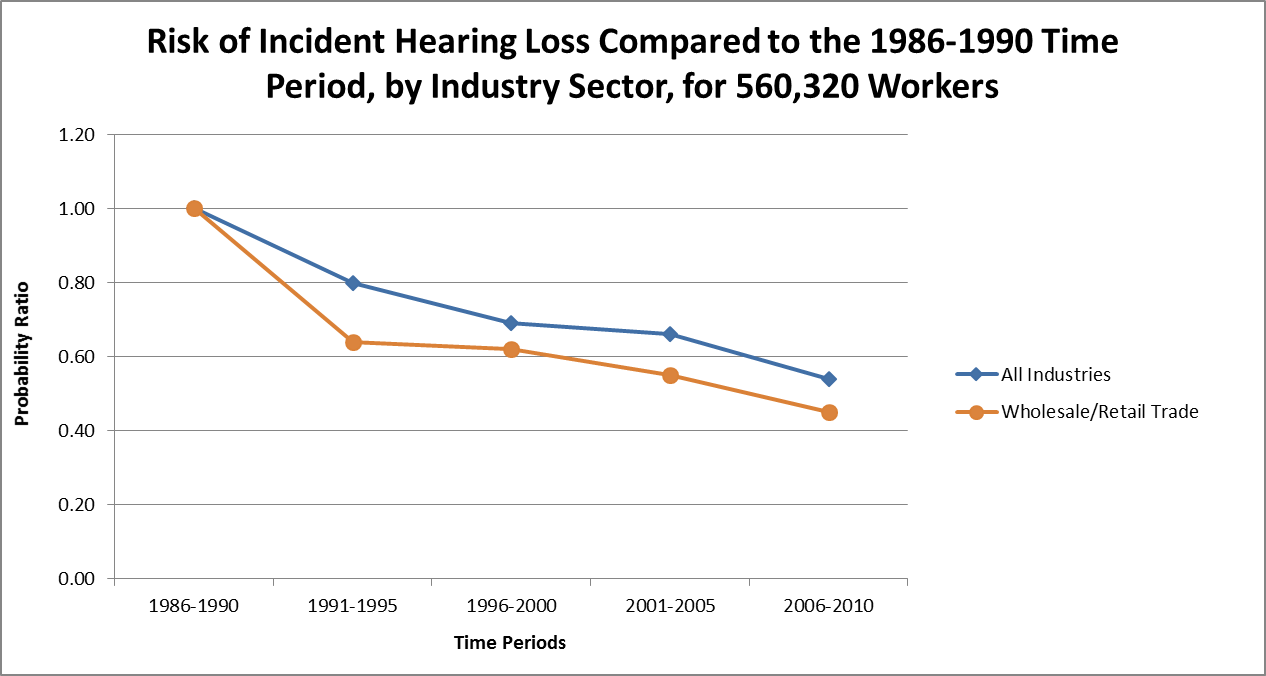
Trends among noise-exposed tested WRT workers (1980-2010)4
- The prevalence for WRT decreased less than 1% over 30 years (1981-2010) as compared with a less than 1% reduction for all industries.
- The incidence for WRT decreased 3% over 25 years (1986-2010) as compared with a 2% reduction for all industries.
- The adjusted risk for WRT decreased 55% over 25 years (1986-2010) as compared with a 46% reduction for all industries.
Content Source:
National Institute for Occupational Safety and Health
- Masterson EA, Morata TC, Themann CL [2025]. Prevalence of ototoxic chemical exposure, noise exposure and hearing difficulty among workers in the United States, 2023. J Occup Environ Med, 67(10):785-797.
- Green DR, Masterson EA, Themann CL [2021]. Prevalence of hearing protection device non-use among noise-exposed U.S. workers in 2007 and 2014. Am J Ind Med, 64(12):1002-1017.
- Masterson EA, Themann CL, Luckhaupt SE, Li J, Calvert GM [2016]. Hearing difficulty and tinnitus among U.S. workers and non-workers in 2007. Am J Ind Med, 59:290-300.
- Masterson EA, Deddens JA, Themann CL, Bertke S, Calvert GM [2015]. Trends in worker hearing loss by industry sector, 1981-2010. Am J Ind Med, 58:392-401.
- Masterson EA, Bushnell PT, Themann CL, Morata TC [2016]. Hearing impairment among noise-exposed workers — United States, 2003–2012. MMWR, 65(15):389-394.