At a glance
- Despite the risk, millions of people drive impaired in the United States each year.
- Impaired driving kills thousands of people every year in the United States. These people include the alcohol-impaired drivers themselves, their passengers, drivers or passengers of another vehicle, and pedestrians.
Overview
Alcohol
- In 2022, 13,524 people were killed in motor vehicle crashes involving alcohol-impaired drivers, accounting for 32% of all traffic-related deaths in the United States.1 This was a 0.7% decrease compared to the number of crash deaths involving alcohol-impaired drivers in 2021.1
- 37 people in the United States are killed every day in crashes involving an alcohol-impaired driver—this is one death every 39 minutes.1
- The annual estimated cost of crash deaths involving alcohol-impaired drivers totaled about $143 billionA in 2022.2 These costs include medical costs and cost estimates for lives lost.
Drugs
It is not known how many people are killed each year in crashes involving drug-impaired drivers because of data limitations.3 However, some studies have assessed drivers for alcohol and drugs in their systems. For example, a study at 7 trauma centers of 4,243 drivers who were seriously injured in crashes found that 54% of drivers tested positive for alcohol and/or drugs from September 2019 to July 2021. Of the 4,243 drivers, 22% were positive for alcohol, 25% were positive for cannabis, 9% were positive for opioids, 10% were positive for stimulants, and 8% were positive for sedatives.4
Who is affected
- 59% of people who died in crashes involving alcohol-impaired drivers in 2022 were the alcohol-impaired drivers themselves; 40% were passengers of the alcohol-impaired drivers, drivers or passengers of another vehicle, or nonoccupants (such as a pedestrian).1
- 283 children ages 0–14 years were killed in crashes involving an alcohol-impaired driver in 2022. This was 25% of traffic-related deaths among children ages 0–14 years.1
Impaired driving behavior
Despite the risk, millions of people drive impaired in the United States each year.
Hundreds of thousands of arrests are made in the United States each year for driving under the influence of alcohol and/or drugs.56 However, results from national self-report surveys show that these arrests represent only a small portion of the times impaired drivers are on the road.
Results from the 2023 National Survey on Drug Use and Health (NSDUH) indicated that the estimated number of U.S. residents ages 16 years and older who drove under the influence in the past year was:
- 15.5 million for alcohol (5.9% of respondents ages 16 years and older),
- 12.1 million for cannabis (4.6% of respondents ages 16 years and older), and
- 2.2 million for illicit drugs other than cannabis (0.8% of respondents ages 16 years and older).6
Data from the Behavioral Risk Factor Surveillance System indicated that 1.5% of adults drove after having too much to drink in the past 30 days in 2020. This resulted in an estimated 125 million episodes of alcohol-impaired driving among U.S. adults.7
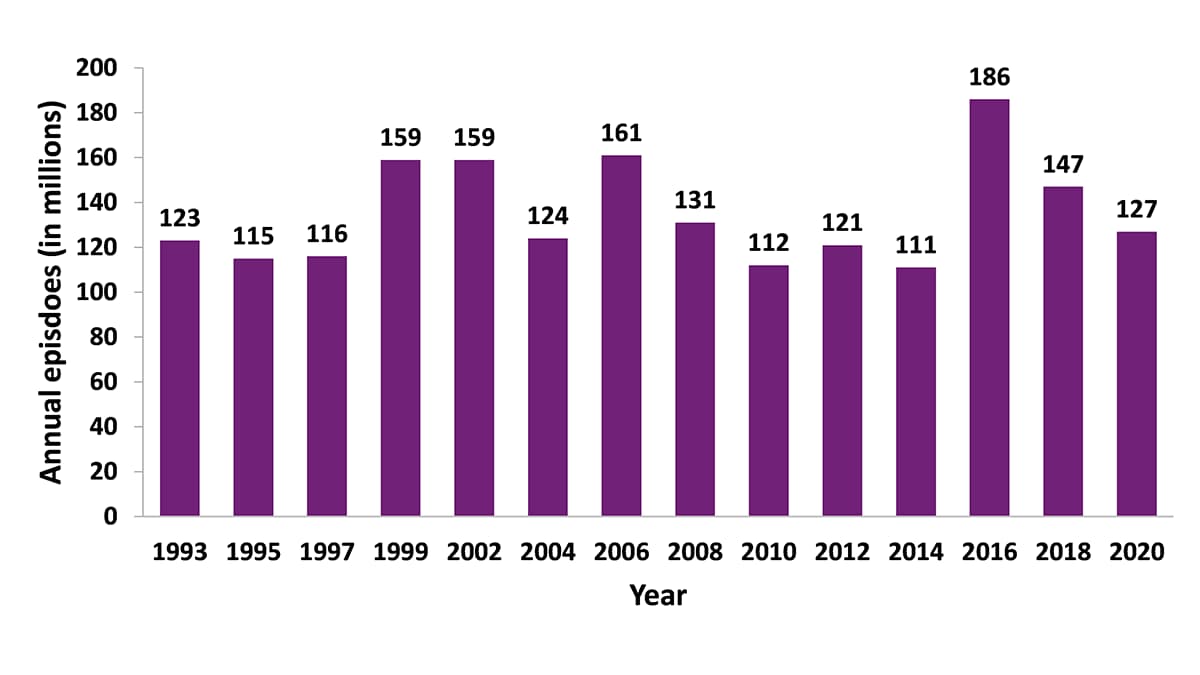
Source: CDC. Behavioral Risk Factor Surveillance System (BRFSS), 1993–2023. Available at https://www.cdc.gov/brfss.
Note: Annual estimated alcohol-impaired driving episodes were calculated using BRFSS respondents' answers to this question: "During the past 30 days, how many times have you driven when you've had perhaps too much to drink?" Annual estimates per respondent were calculated by multiplying the reported episodes during the preceding 30 days by 12. These numbers were summed to obtain the annual national estimates. (See Alcohol-impaired driving among adults—USA, 2014–2018 for more information).
Resources
Related Data Sources
- CDC: WISQARS (Web-based Injury Statistics Query and Reporting System)
- CDC: Behavioral Risk Factor Surveillance System (BRFSS)
- CDC: Youth Risk Behavior Surveillance System (YRBSS)
- Substance Abuse and Mental Health Services Administration (SAMHSA): National Survey on Drug Use and Health (NSDUH)
- National Highway Traffic Safety Administration (NHTSA): Fatality Analysis Reporting System (FARS)
- In 2021 U.S. dollars
- National Highway Traffic Safety Administration (NHTSA). Traffic Safety Facts 2022 Data: Alcohol-Impaired Driving (Report No. DOT HS 813 578). Washington, DC: U.S. Department of Transportation, National Highway Traffic Safety Administration, National Center for Statistics and Analysis; August 2024.
- Centers for Disease Control and Prevention (CDC). WISQARS — Web-based Injury Statistics Query and Reporting System: Cost of Injury. U.S. Department of Health and Human Services, Centers for Disease Control and Prevention, National Center for Injury Prevention and Control; 2024. Accessed average cost of unintentional motor vehicle traffic fatality on 28 October 2024.
- Berning, A, Smith, RC, Drexler, M, & Wochinger, K. Drug testing and traffic safety: What you need to know (Report No. DOT HS 813 264). Washington, DC: U.S. Department of Transportation, National Highway Traffic Safety Administration; March 2022.
- Thomas FD, Darrah J, Graham L, Berning A, Blomberg R, Finstad K, Griggs C, Crandall M, Schulman C, Kozar R, Lai J, Mohr N, Chenoweth J, Cunningham K, Babu K, Dorfman J, Van Heukelom J, Ehsani J, Fell J, Whitehill J, Brown T, Moore C. Alcohol and Drug Prevalence Among Seriously or Fatally Injured Road Users (Report No. DOT HS 813 399). Washington, DC: U.S. Department of Transportation, National Highway Traffic Safety Administration, Office of Behavioral Safety Research; December 2022.
- Federal Bureau of Investigation (FBI). FBI Crime Data Explorer: Arrests. Clarksburg, WV: U.S. Department of Justice, Federal Bureau of Investigations, Uniform Crime Reporting Program. Accessed 8 October 2024.
- Substance Abuse and Mental Health Services Administration (SAMHSA). 2023 NSDUH Detailed Tables. Rockville, MD: U.S. Department of Health and Human Services, Substance Abuse and Mental Health Services Administration; July 2024.
- Centers for Disease Control and Prevention (CDC). Behavioral Risk Factor Surveillance System. Unpublished analyses, 2023 data.