At a glance
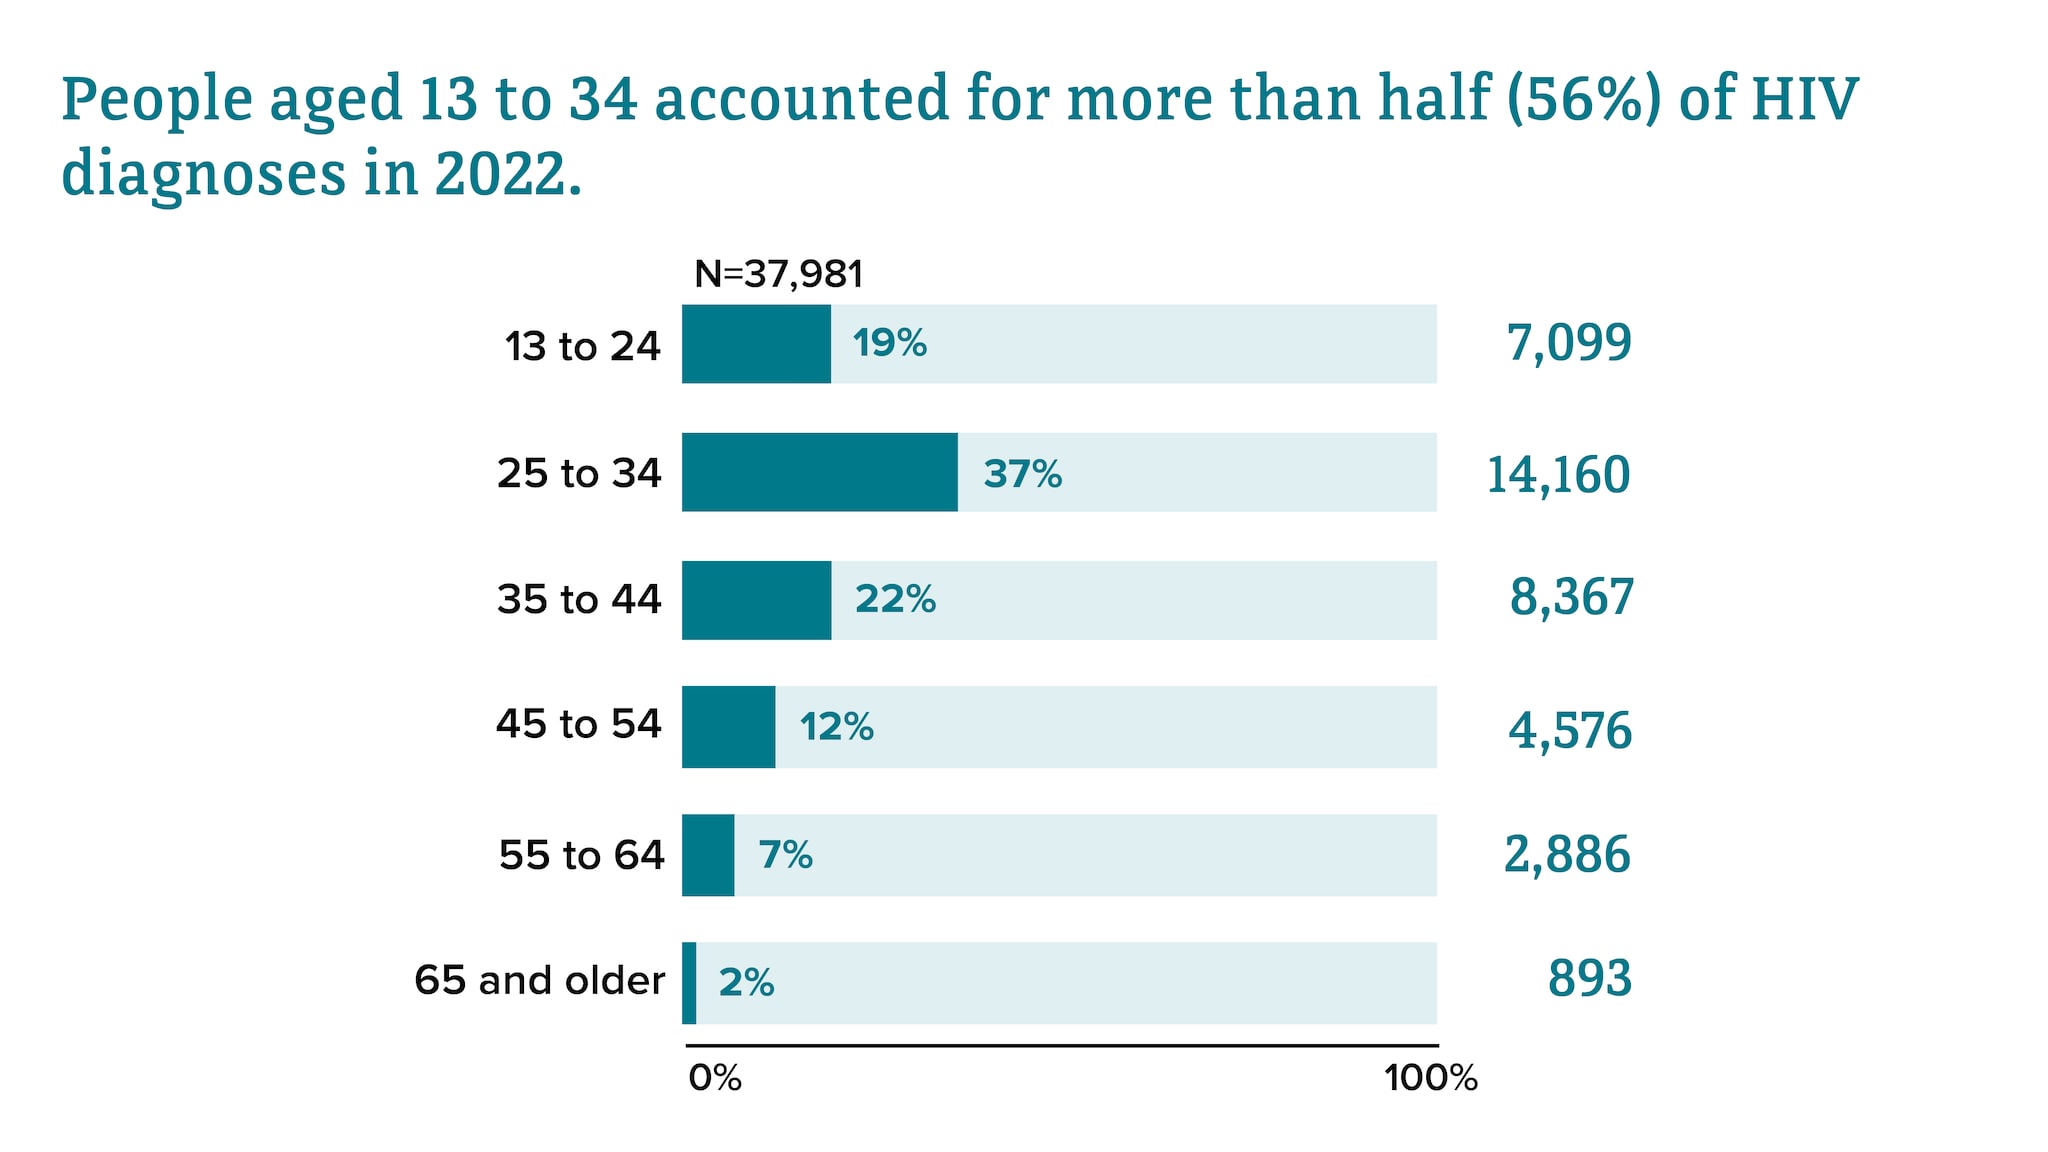
In 2022, over 38,000 people received an HIV diagnosis. Men are most affected, making up almost 80% of diagnoses, with gay and bisexual men accounting for the majority. Racial disparities remain a concern, as Black/African American people make up 38% of diagnoses. Young people are also affected, with over half (56%) of diagnoses occurring among those aged 13 to 34. Geographically, the South continues to account for more than half (52%) of all diagnoses.
Key findings
HIV diagnoses in the United States and 6 territories and freely associated states over time, 2018-2022*
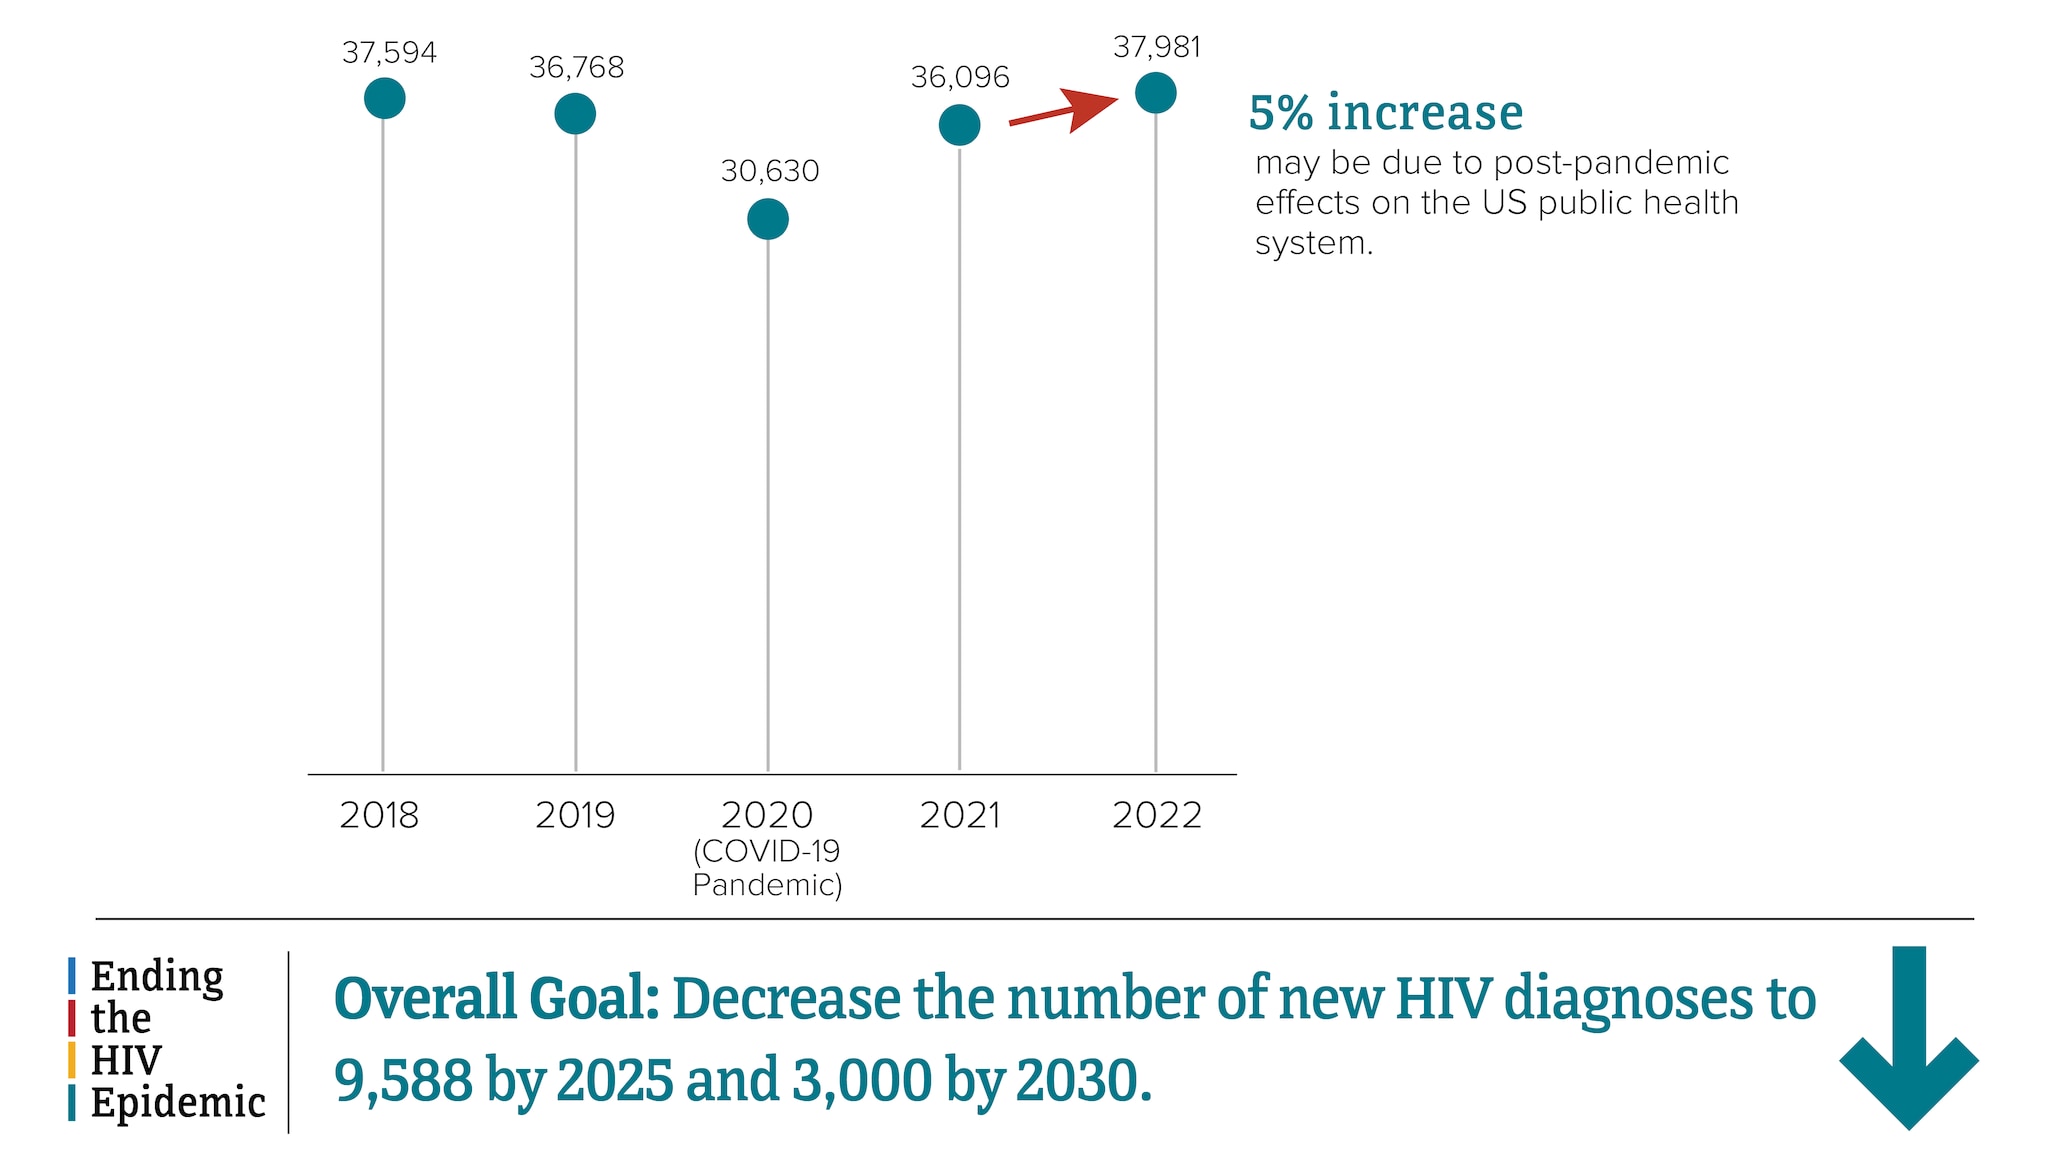
Data for 2020, which coincided with the onset of the COVID-19 pandemic, should be interpreted with caution. The pandemic had a significant impact on access to HIV testing, care, and related services, and case surveillance activities in state and local jurisdictions. As the COVID-19 pandemic lasted beyond 2020, readers should also consider the potential influence of these pandemic effects on U.S. public health systems when interpreting HIV data for 2021 and 2022.
* Among people aged 13 and older.
Differences in HIV diagnoses by gender, 2022*
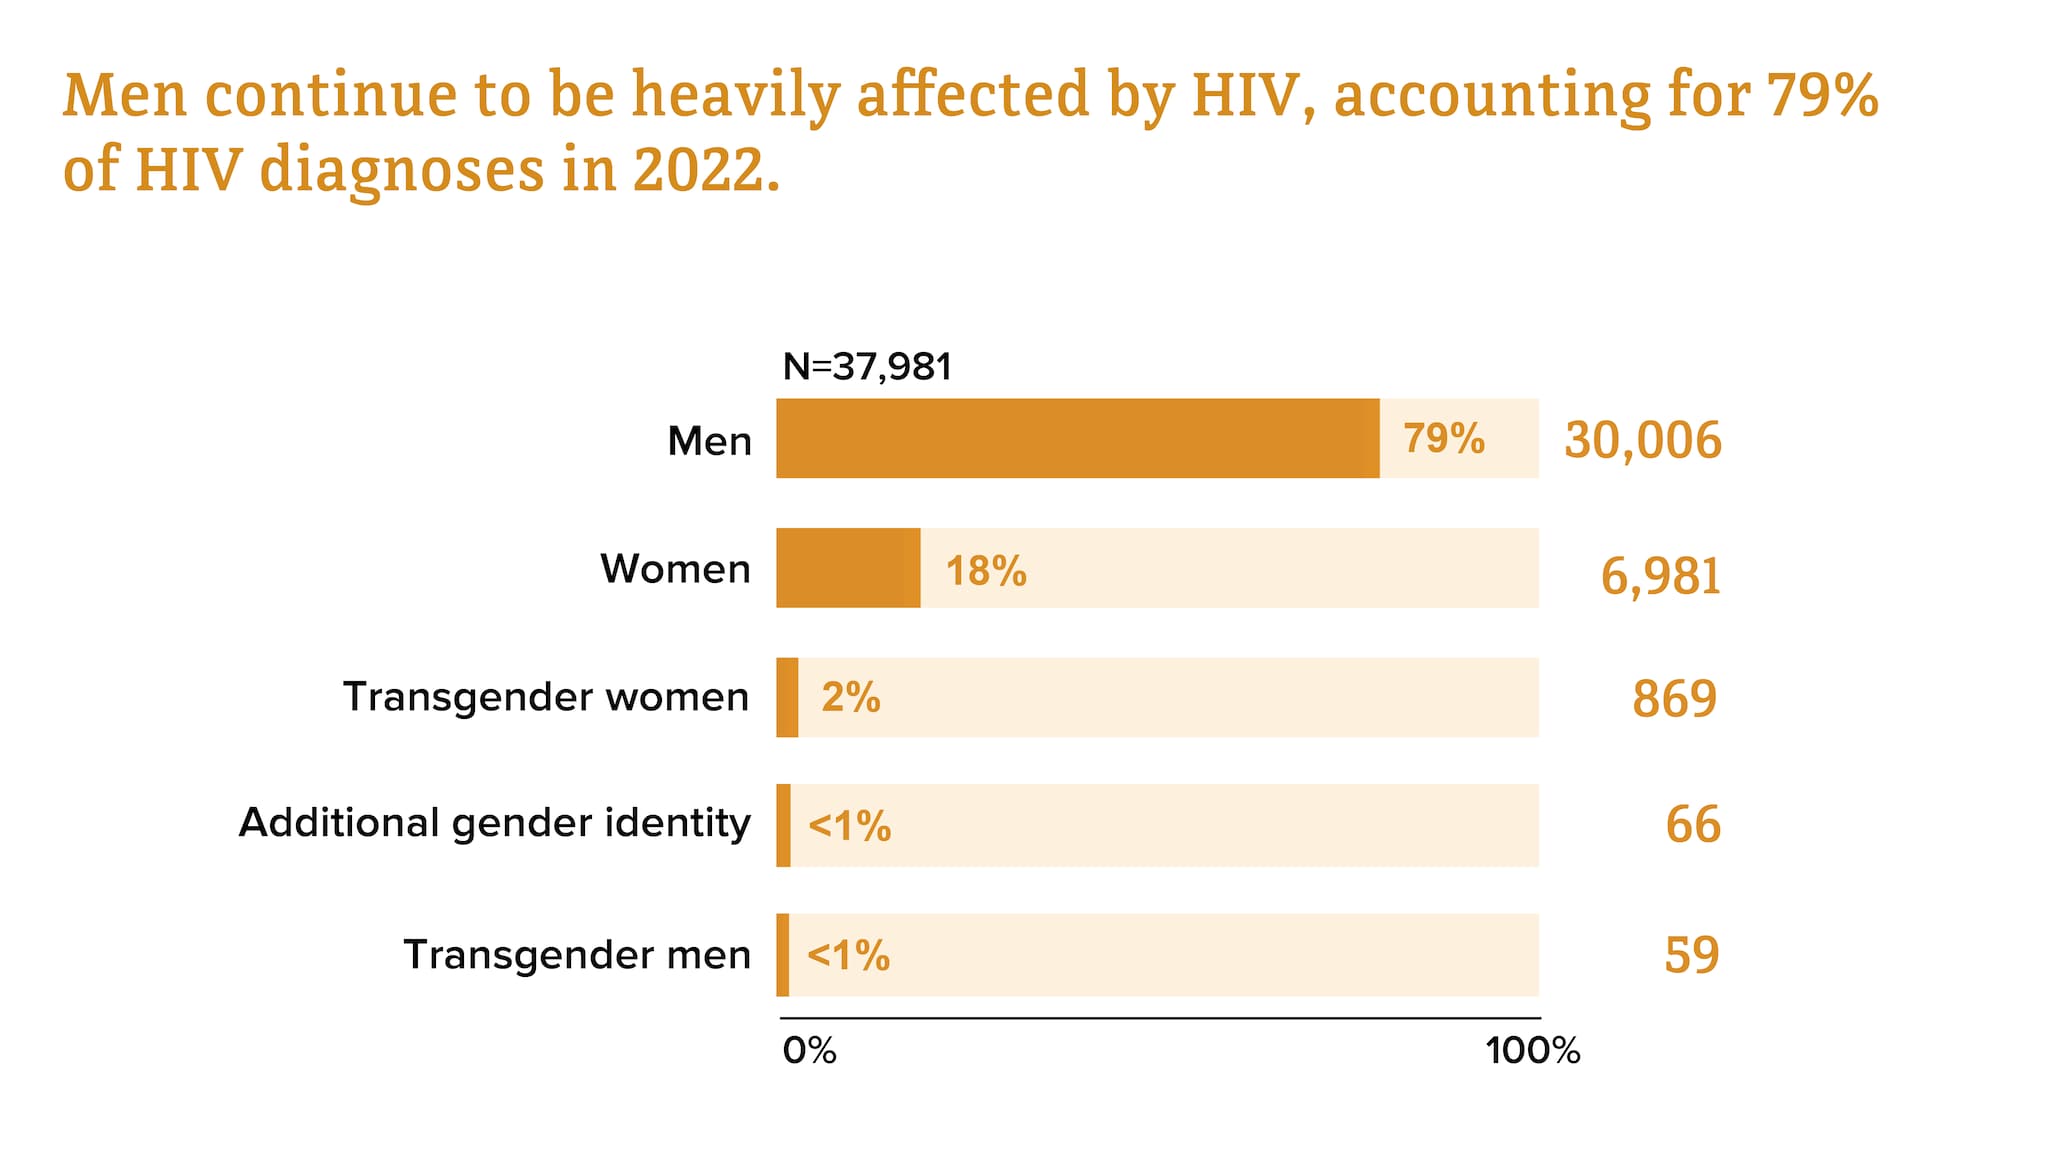
*Among people aged 13 and older.
Differences in HIV diagnoses by transmission category, 2022*†
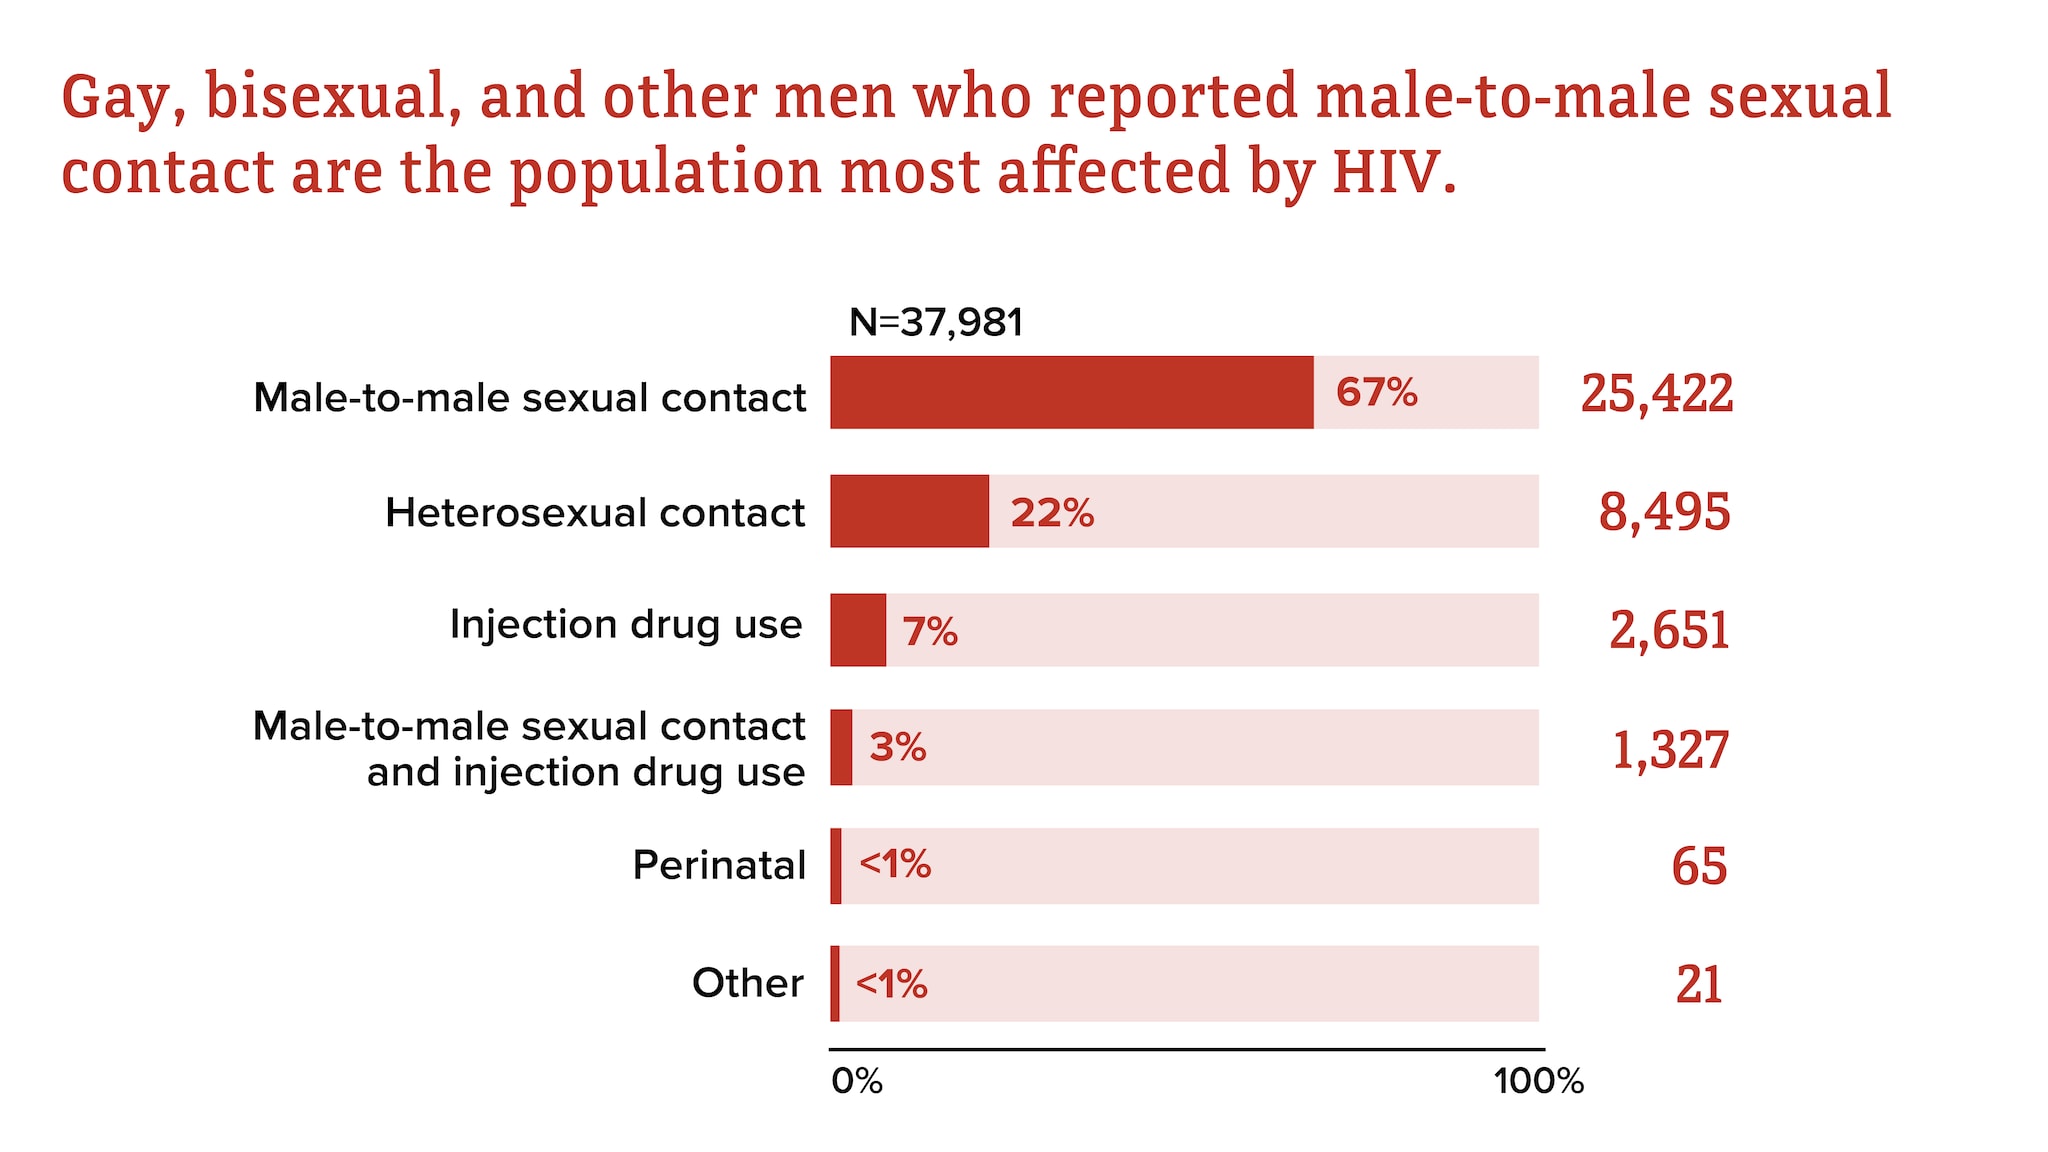
*Among people aged 13 and older.
†Transmission category is classified based on a hierarchy of risk factors most likely responsible for HIV transmission. Classification is determined based on the person's sex assigned at birth. Data have been statistically adjusted to account for missing transmission category.
Differences in HIV diagnoses by race and ethnicity, 2022*
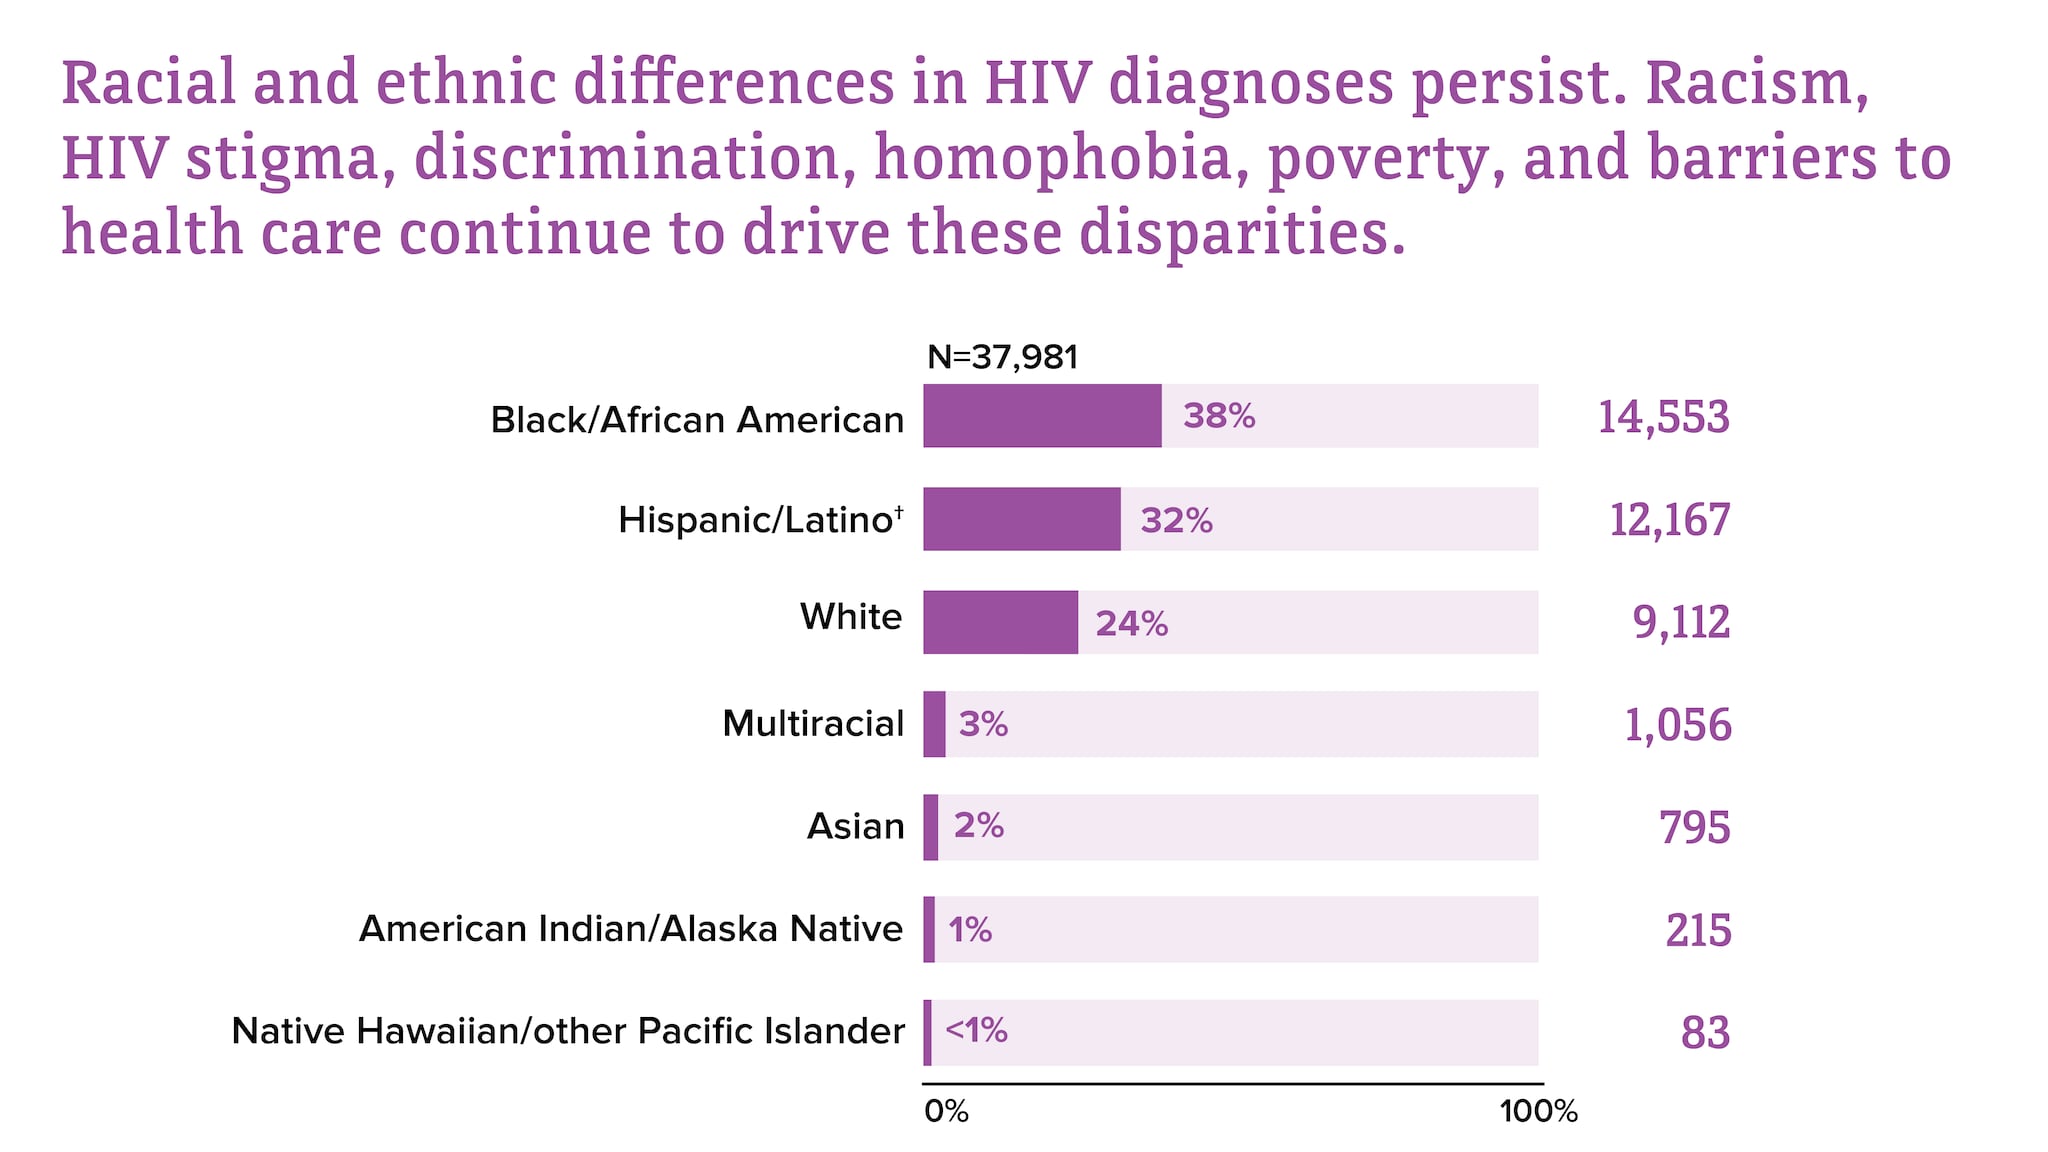
* Among people aged 13 and older.
† Hispanic/Latino people can be of any race.
Differences in HIV diagnoses by age, 2022
Differences in HIV diagnoses by region, 2022*
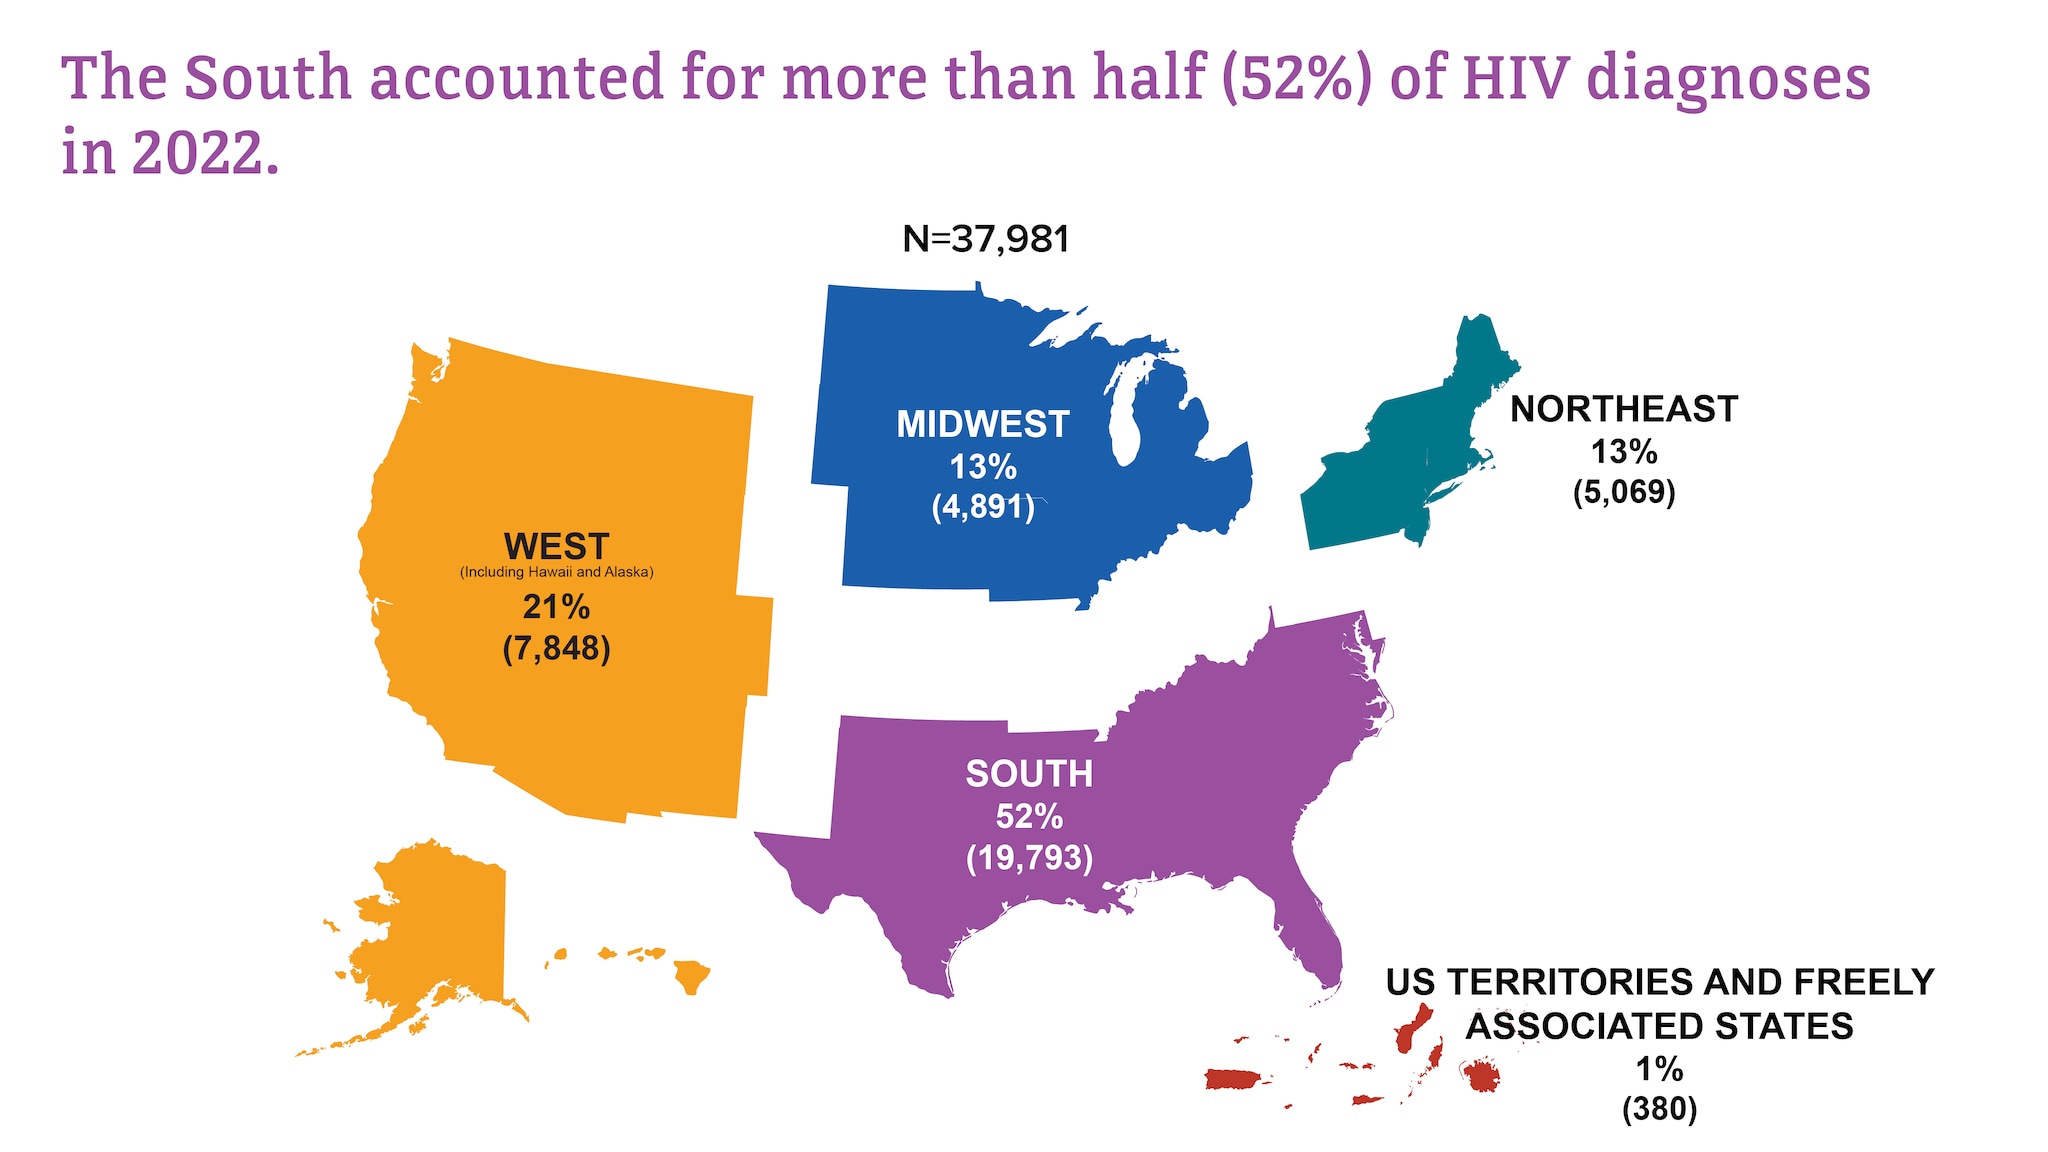
*Among people aged 13 and older.
Using this data
About the data
This page provides an overview of HIV diagnoses, deaths, and prevalence data in the United States and 6 U.S. territories and freely associated states (American Samoa, Guam, Northern Mariana Islands, Puerto Rico, Republic of Palau, U.S. Virgin Islands). These data may be used to monitor progress toward U.S. national goals outlined in Healthy People 2030, the National HIV/AIDS Strategy, and the Ending the HIV Epidemic in the U.S. (EHE) initiative.
Technical notes
For the most up-to-date technical notes for HIV surveillance and monitoring, see Diagnoses, Deaths, and Prevalence of HIV in the United States and 6 Territories and Freely Associated States, 2022.
Supporting documents
Suggested citation
Centers for Disease Control and Prevention. Diagnoses, Deaths, and Prevalence of HIV in the United States and 6 Territories and Freely Associated States, 2022. HIV Surveillance Report 2024; 35.
