About
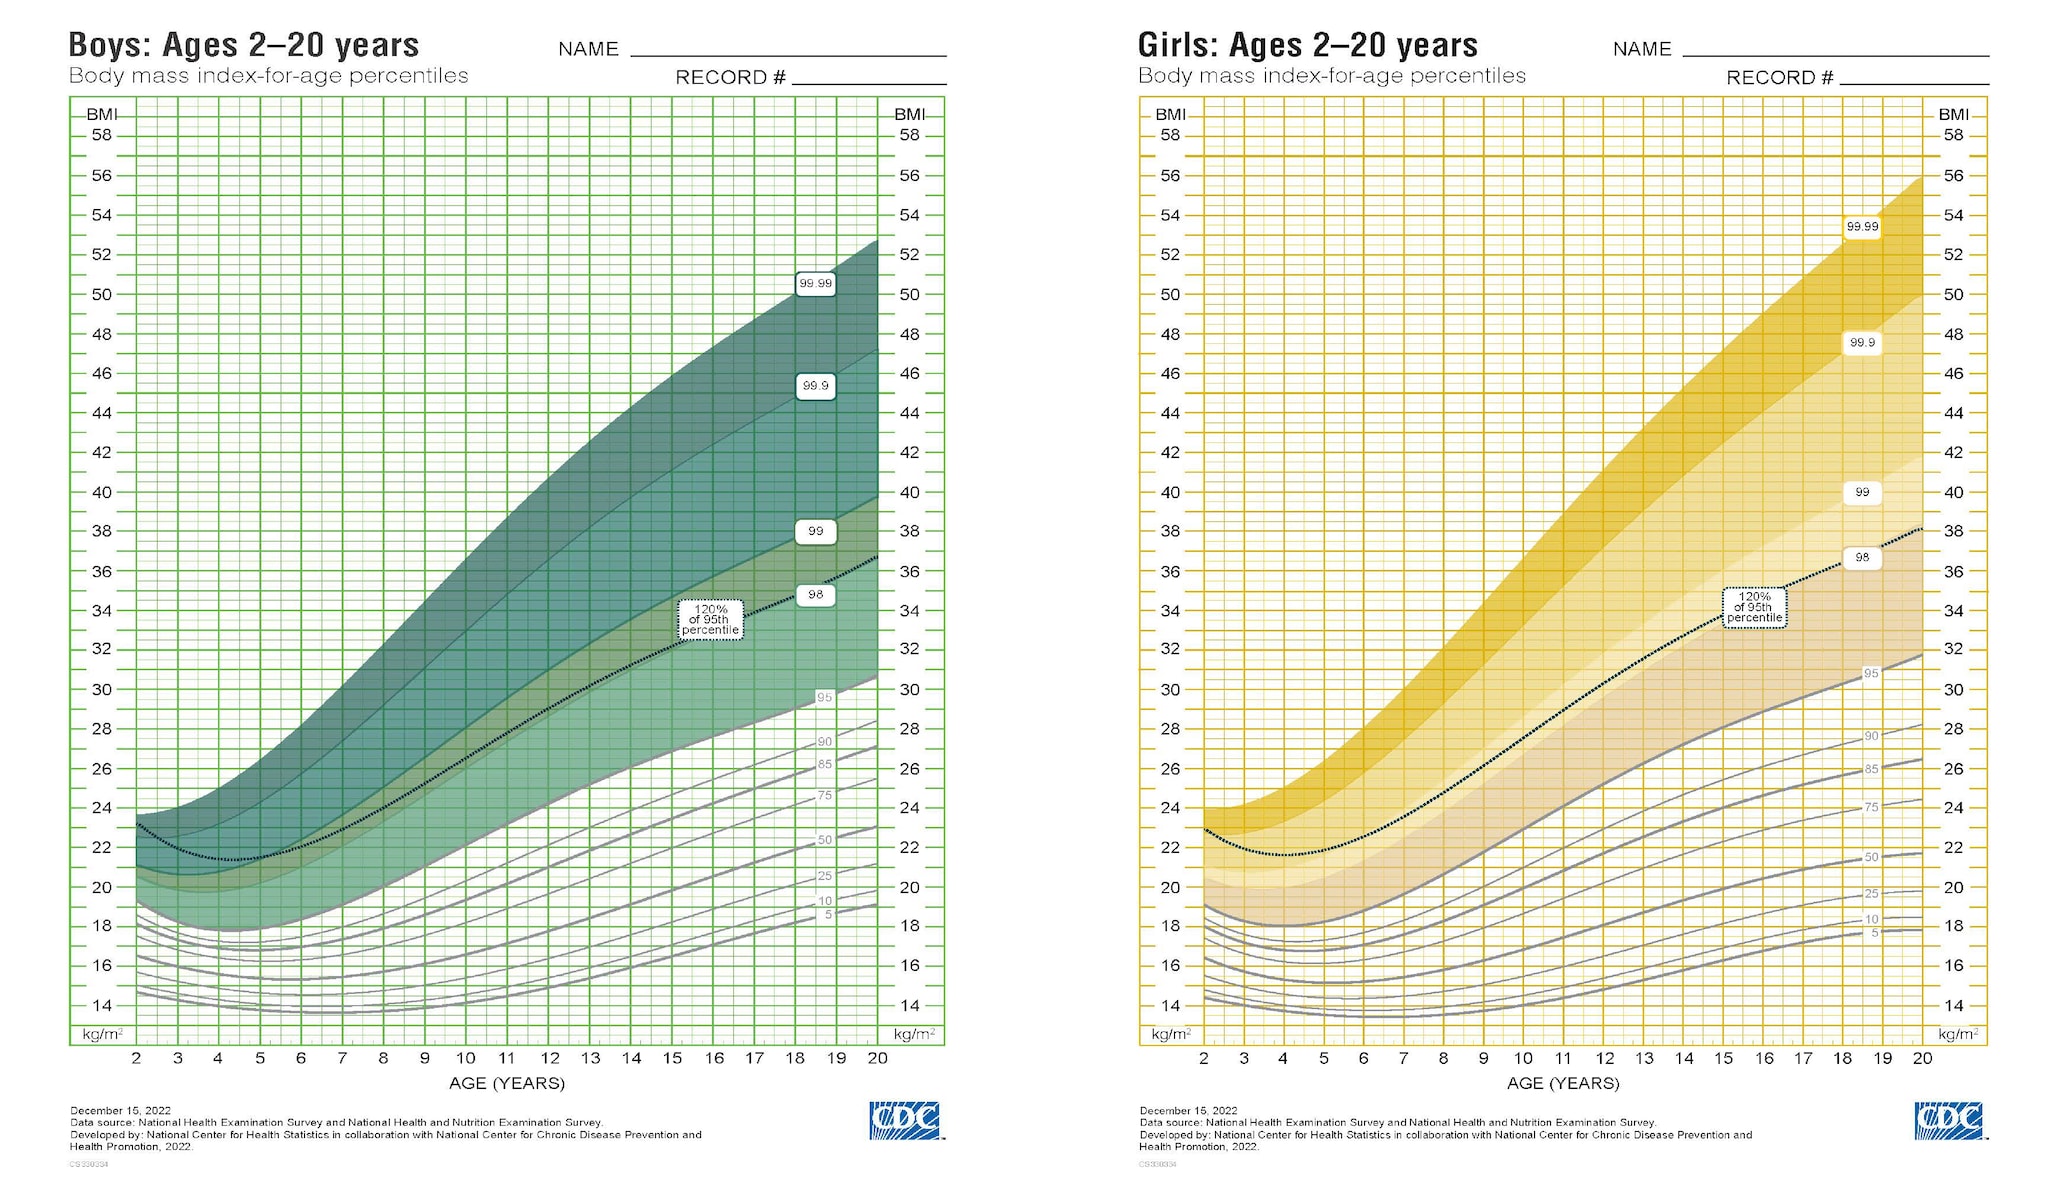
In 2022, CDC released Extended BMI-for-Age Growth Charts to help plot and monitor growth of children and adolescents 2 to 20 years with very high BMIs (above the 97th percentile for sex and age).
What to know
Childhood obesity is a serious problem in the United States. Obesity puts children and adolescents at risk for poor health outcomes during childhood, adolescence, and adulthood. Nearly 20% of US children and adolescents (1 in 5) have obesity.
For children and adolescents 2 to 20 years, severe obesity is defined as body mass index (BMI) at or above 120% of the 95th percentile for sex and age, or BMI at or above 35 kg/m2. Among children in this age group, the prevalence of severe obesity increased from 1% in 1971-1974 to 6.1% in 2017-2018.
The 2000 CDC BMI-for-Age Growth Charts are based on reference data from 1963 to 1980. During that period, the prevalence of obesity was lower than today. Also, during that time, growth data for children and adolescents with severe obesity were sparse.
The 2000 CDC BMI-for-Age Growth Charts have a maximum plottable BMI of 37 kg/m2. There are no percentile lines above the 95th percentile. That made the charts less useful as a visual growth tracking tool for children and adolescents with very high BMIs. Because of this, CDC expanded the growth charts using more recent data and methods. CDC added new percentile curves to the growth charts for tracking children and adolescents with very high BMIs.
The 2022 CDC Extended BMI-for-Age Growth Charts can help health care providers track growth and optimize care for children and adolescents with very high BMIs (above the 97th percentile for sex and age).
Growth charts for children and adolescents without obesity, and their recommended use, have not changed.
What changed
In December 2022, CDC extended the growth reference charts for children and adolescents 2 to 20 years with very high BMIs. The 2022 CDC Extended BMI-for-Age Growth Charts allow clinicians to:
- Visualize high BMIs with children and families.
- Track the children's growth.
- Optimize care for this group.
The 2022 CDC Extended BMI-for-Age Growth Charts include four additional percentile curves above the 95th percentile (the 98th, 99th, 99.9th, and 99.99th percentiles). BMI can be plotted up to 60 kg/m2.
The 2022 CDC Extended BMI-for-Age Growth Charts are based on:
- An updated reference population that includes children with obesity during 1999–2016.
- Updated statistical methods to calculate percentiles for children with very high BMIs.
This allows for a continuous measure of growth to inform clinical care for children above the 97th percentile. The extended growth charts, coupled with high-quality treatment, can help optimize care for children and adolescents with very high BMIs.
What did not change
The 2000 CDC BMI-for-Age Growth Charts have not changed. Continue to use these charts for monitoring growth among children without obesity. The BMI categories, including the threshold for severe obesity, remain unchanged.
BMI Category
BMI Range
Underweight
Less than the 5th percentile
Healthy Weight
5th percentile to less than the 85th percentile
Overweight
85th percentile to less than the 95th percentile
Obesity
95th percentile or greater
Severe Obesity
120% of the 95th percentile or greater, or 35 kg/m2 or greater
New charts compared to previous severe obesity charts
Severe obesity growth charts previously published by others were based on a measure called "percent of the 95th percentile". That statistical calculation was not from actual growth data of children with very high BMIs. These charts filled an important data and clinical gap before 2022.
The 2022 CDC Extended BMI-for-Age Growth Charts can add to or replace the severe obesity growth charts used prior in clinical care and displayed in electronic health records (EHRs). The 2022 CDC Extended BMI-for-Age Growth Charts can become the default percentiles and z-scores for children with BMIs above the 97th percentile.
The color shading in the 2022 CDC Extended BMI-for-Age Growth Charts provides a printable visual aid. Clinicians can refer to it when talking with families about very high BMI and needed care.
Tables, computer programs, and instructions for calculating percentiles and z-scores are available to help with EHR integration. See:
Creating the extended charts
CDC explored different options for monitoring growth in children with very high BMIs. Findings suggested that the best option was to provide extended reference curves or percentiles to monitor growth in these children.
The 2022 CDC Extended BMI-for-Age Growth Charts are based on recent data from a nationally representative sample of children and adolescents with obesity and severe obesity.