What to know
Summary
Viruses
Illness
All data are preliminary and may change as more reports are received.
Directional arrows indicate changes between the current week and the previous week. Additional information on the arrows can be found at the bottom of this page.
A description of the CDC influenza surveillance system, including methodology and detailed descriptions of each data component is available on the surveillance methods page.1
Additional information on the current and previous influenza seasons for each surveillance component are available on FluView Interactive.
U.S. virologic surveillance
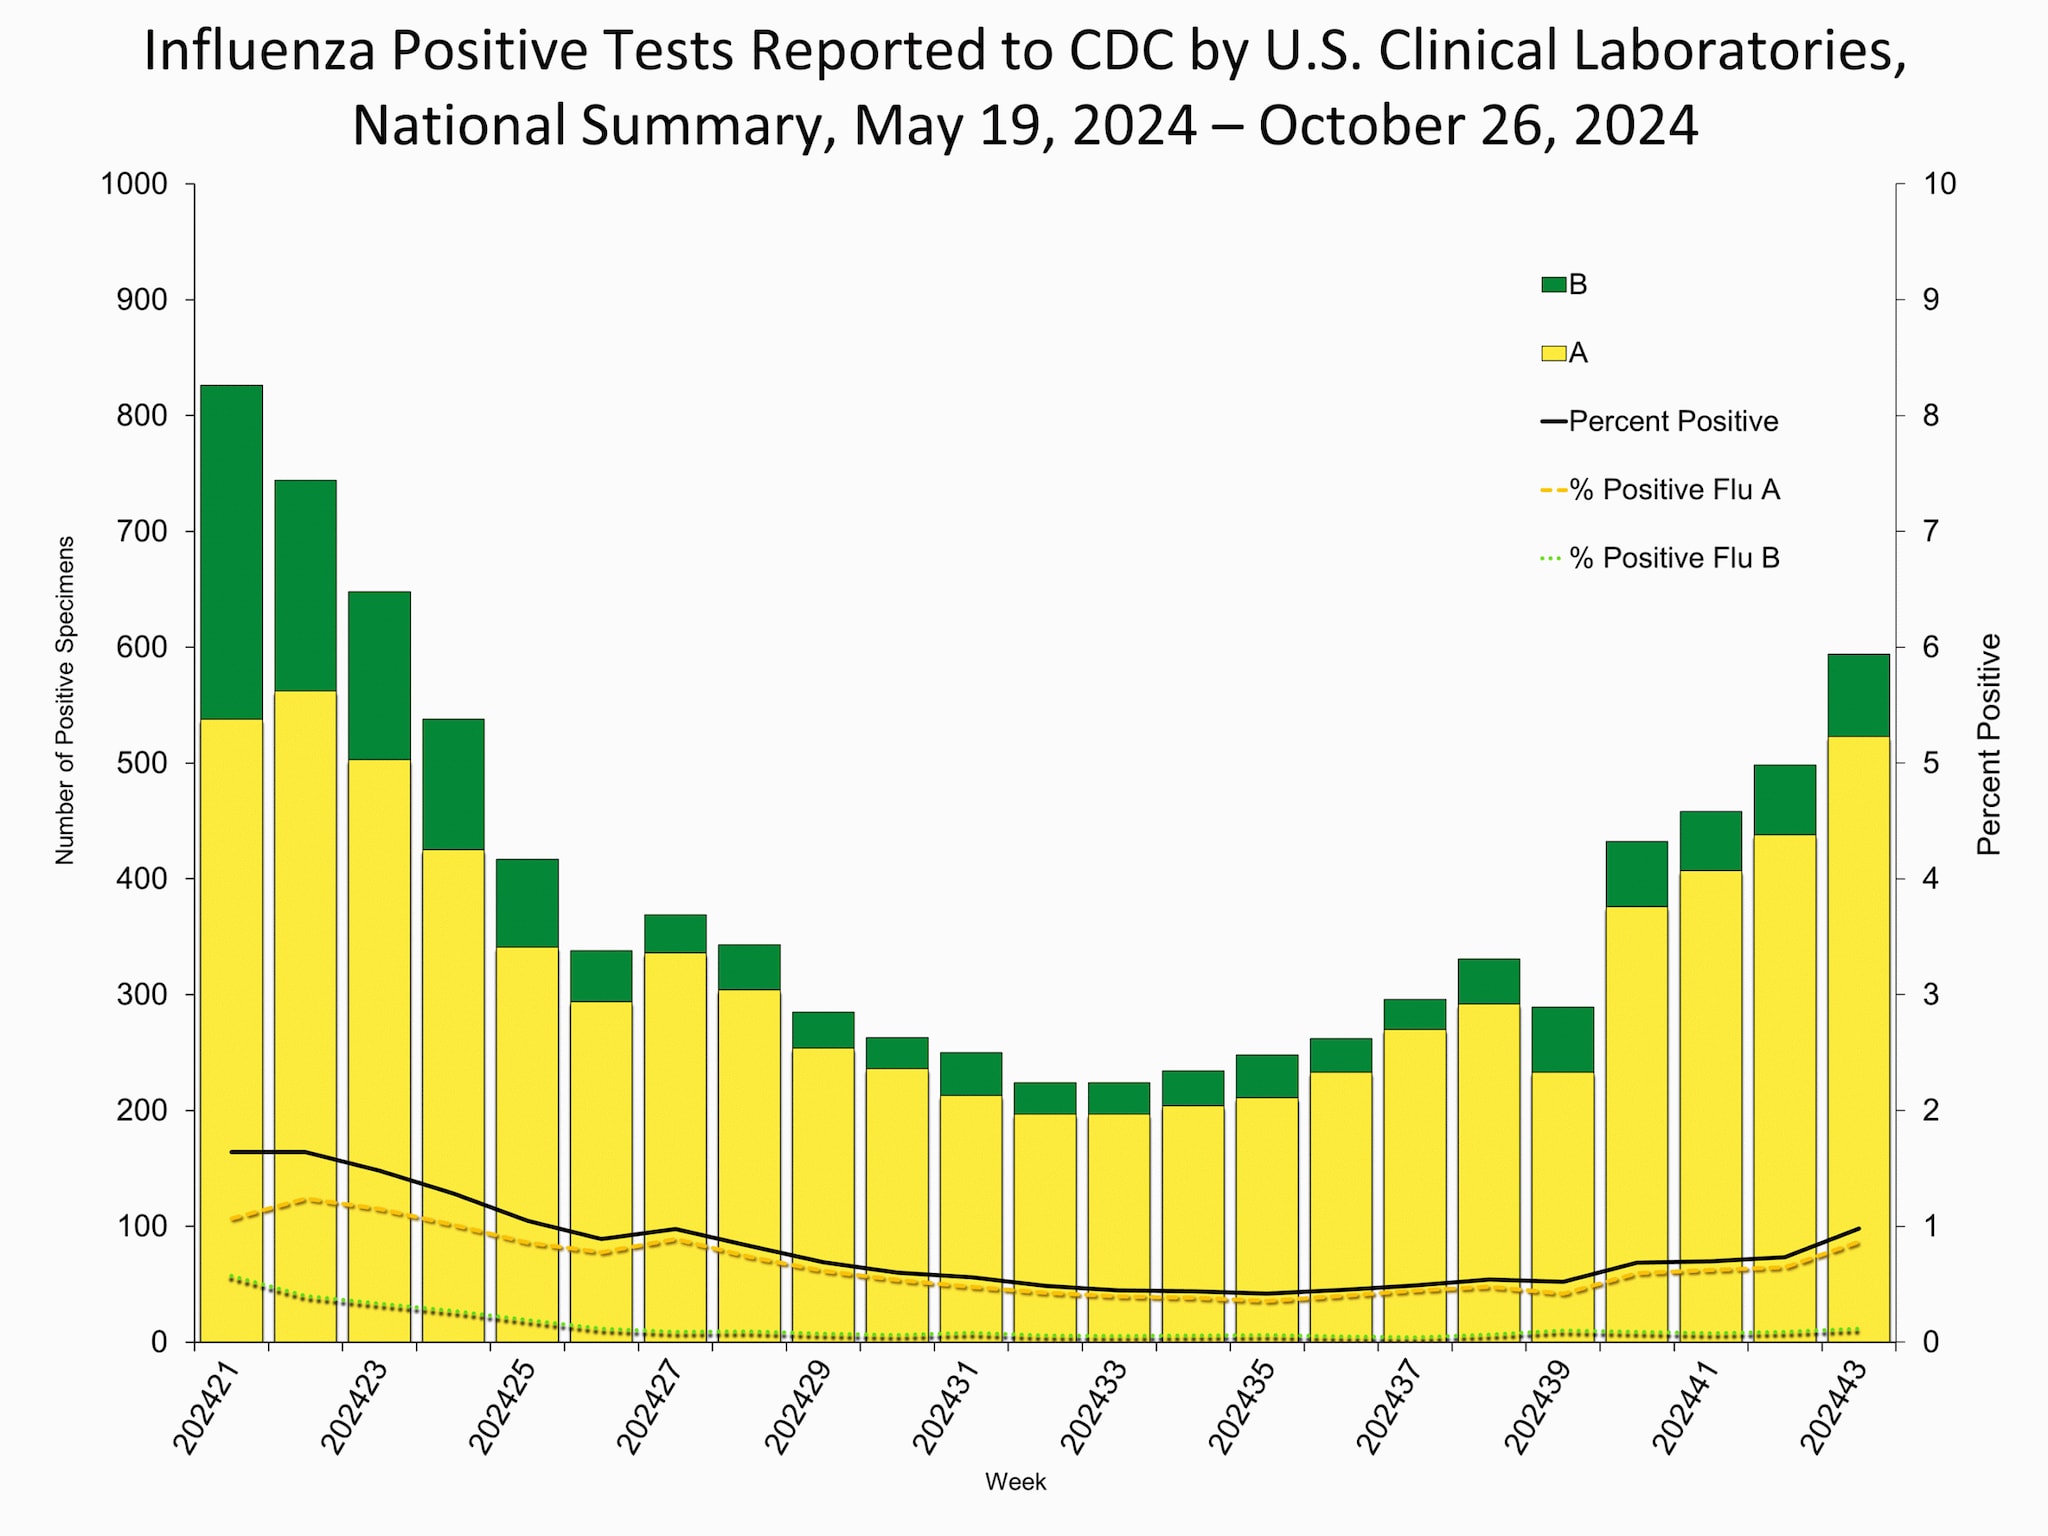
Nationally and in all 10 HHS regions, the percentage of respiratory specimens testing positive for influenza virus in clinical laboratories remained low and stable (change of <0.5 percentage points) compared to the previous week. Influenza A(H1N1)pdm09 and A(H3N2) viruses are co-circulating; however, the distribution of circulating viruses varies by region. For regional and state level data and age group distribution, FluView Interactive. Viruses known to be associated with recent receipt of live attenuated influenza vaccine (LAIV) or found upon further testing to be a vaccine virus are not included, as they are not circulating influenza viruses.
Clinical Laboratories
The results of tests performed by clinical laboratories nationwide are summarized below. Data from clinical laboratories (the percentage of specimens tested that are positive for influenza virus) are used to monitor whether influenza activity is increasing or decreasing.
| Week 43 | Data Cumulative since September 29, 2024 (Week 40) |
|
|---|---|---|
| No. of specimens tested | 60,464 | 256,880 |
| No. of positive specimens (%) | 594 (1.0%) | 1,982 (0.8%) |
| Positive specimens by type | ||
| Influenza A | 523 (88.0%) | 1,744 (88.0%) |
| Influenza B | 71 (12.0%) | 238 (12.0%) |
Public Health Laboratories
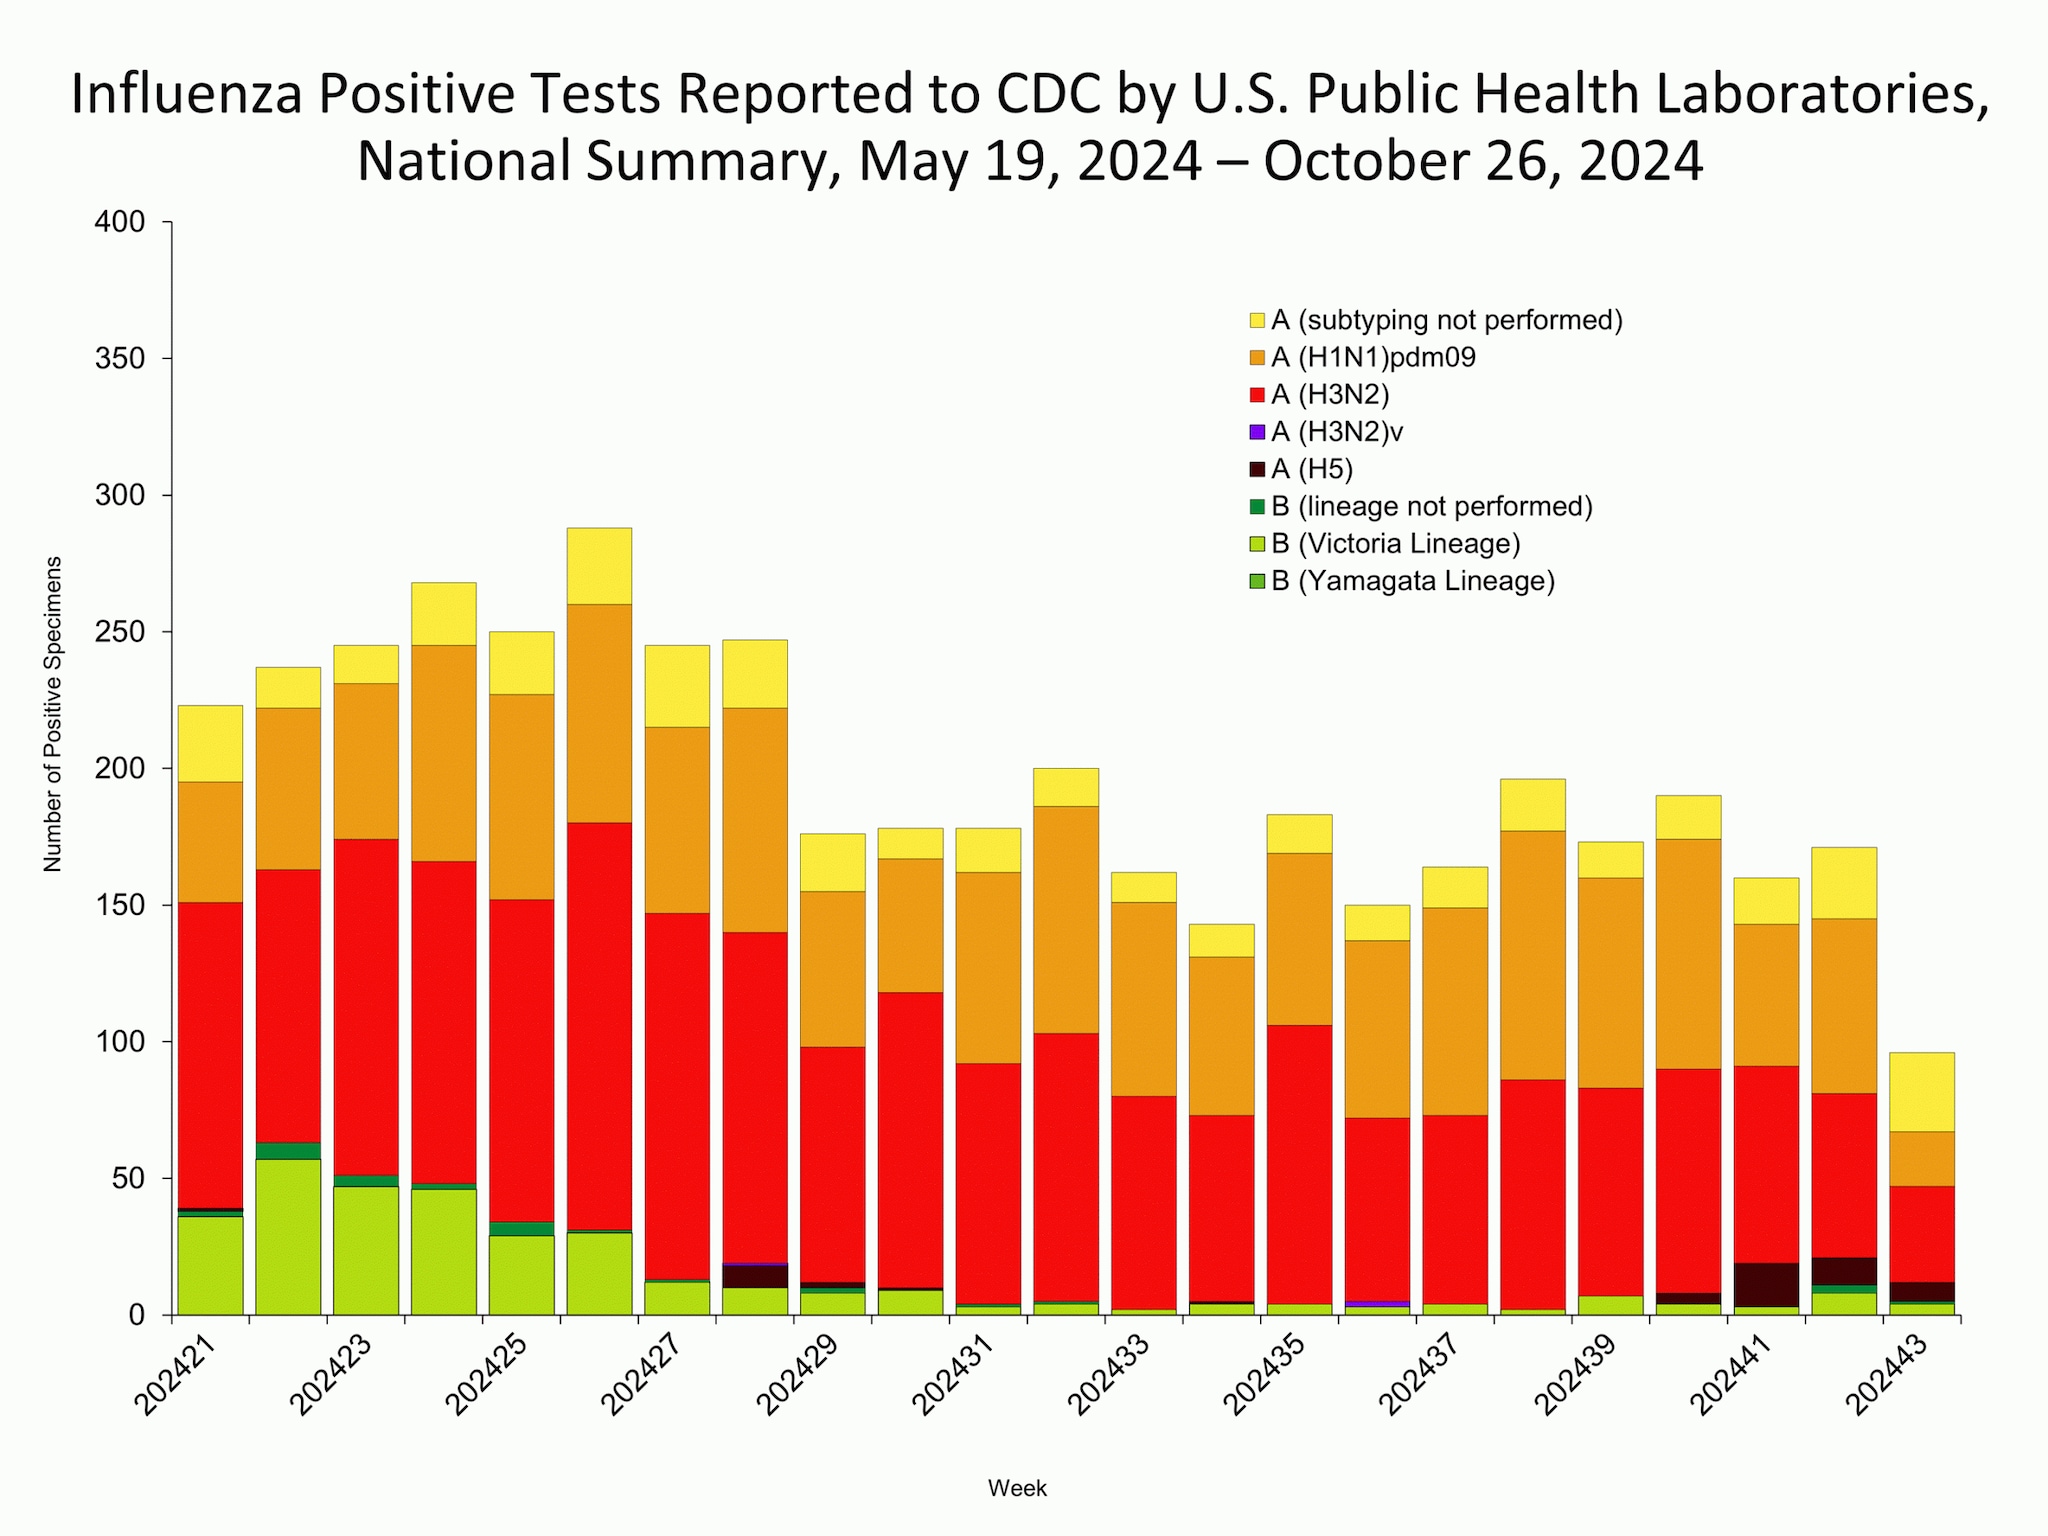
The results of tests performed by public health laboratories nationwide are summarized below. Data from public health laboratories are used to monitor the proportion of circulating influenza viruses that belong to each influenza subtype/lineage.
| Week 43 |
Data Cumulative since September 29, 2024 (Week 40) |
|
|---|---|---|
| No. of specimens tested | 1,234 | 4,707 |
| No. of positive specimens | 96 | 617 |
| Positive specimens by type/subtype | ||
| Influenza A | 91 (94.8%) | 594 (96.3%) |
| Subtyping Performed | 62 (68.1%) | 506 (85.2%) |
| (H1N1)pdm09 | 20 (32.3%) | 220 (43.4%) |
| H3N2 | 35 (56.5%) | 249 (49.2%) |
| H3N2v | 0 (0.0%) | 0 (0.0%) |
| H5* | 7 (11.3%) | 37 (7.3%) |
| Subtyping not performed | 29 (31.9%) | 88 (14.8%) |
| Influenza B | 5 (5.1%) | 23 (3.7%) |
| Lineage testing performed | 4 (80.0%) | 19 (82.6%) |
| Yamagata lineage | 0 (0.0%) | 0 (0.0%) |
| Victoria lineage | 4 (100%) | 19 (100%) |
| Lineage not performed | 1 (20.0%) | 4 (17.4%) |
*This data reflects specimens tested and the number determined to be positive for influenza viruses at the public health labs (specimens tested is not the same as cases). It does not reflect specimens tested only at CDC and could include more than one specimen tested per person. The guidance for influenza A/H5 testing recommends testing both a conjunctival and respiratory swab for people with conjunctivitis which has resulted in more specimens testing positive for influenza A/H5 than the number of human H5 cases. For more information on the number of people infected with A/H5, please visit the "How CDC is monitoring influenza data among people to better understand the current avian influenza A (H5N1) situation"
Novel Influenza A Virus Infections
Eight confirmed human infections with influenza A(H5) viruses were reported to CDC this week. To date, human-to-human transmission of influenza A(H5) virus has not been identified in the United States.
One confirmed case was reported by the California Department of Public Health. This case occurred in a worker at a commercial dairy cattle farm where highly pathogenic avian influenza (HPAI) A(H5N1) viruses had been detected in cows. There have now been 16 total confirmed human cases in California.
Seven confirmed cases were reported by the Washington State Department of Health. These cases occurred among workers performing depopulation activities at a commercial poultry facility where HPAI A (H5N1) viruses had been detected in birds. There have now been nine total confirmed human cases in Washington.
All 8 individuals with confirmed influenza A(H5) virus infection reported to CDC this week are aged >18 years. These individuals had mild symptoms, which they reported to local health department officials. Specimens were collected from the individuals and were initially tested at state or local public health laboratories using the CDC influenza A(H5) assay before being sent to CDC for further testing. Specimens from the individuals were positive for influenza A(H5) virus using diagnostic rRT-PCR at CDC. Additional analysis including genetic sequencing is underway.
In response to these detections, additional case investigations and surveillance activities are being conducted by public health officials in California and Washington.
An up-to-date human case summary during the 2024 outbreak by state and exposure source is available at www.cdc.gov/bird-flu/situation-summary/index.html
Information about avian influenza is available at https://www.cdc.gov/flu/avianflu/index.htm.
Interim recommendations for Prevention, Monitoring, and Public Health Investigations are available at https://www.cdc.gov/bird-flu/prevention/hpai-interim-recommendations.html.
The latest case reports on avian influenza outbreaks in wild birds, commercial poultry, backyard or hobbyist flocks, and mammals in the United States are available from the USDA at https://www.aphis.usda.gov/aphis/ourfocus/animalhealth/animal-disease-information/avian/avian-influenza/2022-hpai.
Influenza Virus Characterization
CDC performs genetic and antigenic characterization of U.S. viruses submitted from state and local public health laboratories according to the Right Size Roadmap submission guidance. These data are used to compare how similar the currently circulating influenza viruses are to the reference viruses representing viruses contained in the current influenza vaccines. The data are also used to monitor evolutionary changes that continually occur in influenza viruses circulating in humans. CDC also tests susceptibility of circulating influenza viruses to antiviral medications including the neuraminidase inhibitors (oseltamivir, zanamivir, and peramivir) and the PA endonuclease inhibitor baloxavir. The HA clade and subclades were assigned using Nextclade (https://clades.nextstrain.org).
CDC has genetically characterized 746 influenza viruses collected since May 19, 2024.
| Virus Subtype or Lineage | Genetic Characterization | ||||
|---|---|---|---|---|---|
| Total No. of Subtype/Lineage Tested |
HA Clade |
Number (% of subtype/lineage tested) |
HA Subclade |
Number (% of subtype/lineage tested) |
|
| A/H1 | 239 | ||||
| 5a.2a |
133 (44.5%) | C.1 | 1 (0.3%) | ||
| C.1.9 | 132 (44.1%) | ||||
| 5a.2a.1 | 166 (55.5%) | C.1.1 | 2 (0.7%) | ||
| D | 150 (50.2%) | ||||
| D.1 | 1 (0.3%) | ||||
| D.2 | 1 (0.3%) | ||||
| D.3 | 8 (2.7%) | ||||
| D.4 | 4 (1.3%) | ||||
| A/H3 | 344 | ||||
| 2a.3a | 1 (0.3%) | G.1.3.1 | 1 (0.3%) | ||
| 2a.3a.1 | 343 (99.7%) | J.1 | 10 (2.7%) | ||
| J.2 | 366 (97.1%) | ||||
| B/Victoria | 66 | ||||
| 3a.2 | 66 (100%) | C.5 | 2 (2.9%) | ||
| C.5.1 | 54 (77.1%) | ||||
| C.5.6 | 9 (12.9%) | ||||
| C.5.7 | 5 (7.1%) | ||||
| B/Yamagata | 0 | ||||
| Y3 | 0 | Y3 | 0 | ||
CDC antigenically characterizes influenza viruses by hemagglutination inhibition (HI) (H1N1pdm09, H3N2, B/Victoria, and B/Yamagata viruses) or neutralization-based HINT (H3N2 viruses) using antisera that ferrets make after being infected with reference viruses representing the 2023-2024 Northern Hemisphere recommended cell or recombinant-based vaccine viruses. Antigenic differences between viruses are determined by comparing how well the antibodies made against the vaccine reference viruses recognize the circulating viruses that have been grown in cell culture. Ferret antisera are useful because antibodies raised against a particular virus can often recognize small changes in the surface proteins of other viruses. In HI assays, viruses with similar antigenic properties have antibody titer differences of less than or equal to 4-fold when compared to the reference (vaccine) virus. In HINT, viruses with similar antigenic properties have antibody neutralization titer differences of less than or equal to 8-fold. Viruses selected for antigenic characterization are a subset representing the genetic changes in the surface proteins and may not be proportional to the number of such viruses circulating in the United States.
Influenza A Viruses
- A (H1N1)pdm09: 64 A(H1N1)pdm09 viruses were antigenically characterized by HI, and 61 (95.3%) were well-recognized (reacting at titers that were within 4-fold of the homologous virus titer) by ferret antisera to cell-grown A/Wisconsin/67/2022-like reference viruses representing the A(H1N1)pdm09 component for the cell- and recombinant-based influenza vaccines.
- A (H3N2): 166 A(H3N2) viruses were antigenically characterized by HI or HINT, and 127 (76.5%) were well-recognized (reacting at titers that were within 4-fold of the homologous virus titer in HI or reacting at titers that were less than or equal to 8-fold of the homologous virus in HINT) by ferret antisera to cell-grown A/Massachusetts/18/2022-like reference viruses representing the A(H3N2) component for the cell- and recombinant-based influenza vaccines.
Influenza B Viruses
- B/Victoria: 26 influenza B/Victoria-lineage virus were antigenically characterized by HI, and all were well-recognized (reacting at titers that were within 4-fold of the homologous virus titer) by ferret antisera to cell-grown B/Austria/1359417/2021-like reference viruses representing the B/Victoria component for the cell- and recombinant-based influenza vaccines.
- B/Yamagata: No influenza B/Yamagata-lineage viruses were available for antigenic characterization.
Assessment of Virus Susceptibility to Antiviral Medications
CDC assesses susceptibility of influenza viruses to the antiviral medications including the neuraminidase inhibitors (oseltamivir, zanamivir, and peramivir) and the PA endonuclease inhibitor baloxavir using next generation sequence analysis supplemented by laboratory assays. Information about antiviral susceptibility test methods can be found at U.S. Influenza Surveillance: Purpose and Methods.
Viruses collected in the U.S. since May 19, 2024, were tested for antiviral susceptibility as follows:
| Antiviral Medication | Total Viruses | A/H1 | A/H3 | B/Victoria | ||
|---|---|---|---|---|---|---|
| Neuraminidase Inhibitors | Oseltamivir | Viruses Tested | 736 | 296 | 374 | 66 |
| Reduced Inhibition | 0 | 0 | 0 | 0 | ||
| Highly Reduced Inhibition | 2 (0.3%) | 2 (0.7%) | 0 | 0 | ||
| Peramivir | Viruses Tested | 736 | 296 | 374 | 66 | |
| Reduced Inhibition | 0 | 0 | 0 | 0 | ||
| Highly Reduced Inhibition | 2 (0.3%) | 2 (0.7%) | 0 | 0 | ||
| Zanamivir | Viruses Tested | 736 | 296 | 374 | 66 | |
| Reduced Inhibition | 0 | 0 | 0 | 0 | ||
| Highly Reduced Inhibition | 0 | 0 | 0 | 0 | ||
| PA Cap-Dependent Endonuclease Inhibitor | Baloxavir | Viruses Tested | 690 | 254 | 366 | 70 |
| Decreased Susceptibility | 0 | 0 | 0 | 0 | ||
Two A(H1N1)pdm09 viruses had NA-H275Y amino acid substitution conferring highly reduced inhibition by oseltamivir and peramivir.
High levels of resistance to the adamantanes (amantadine and rimantadine) persist among influenza A(H1N1)pdm09 and influenza A(H3N2) viruses (the adamantanes are not effective against influenza B viruses). Therefore, use of these antivirals for treatment and prevention of influenza A virus infection is not recommended and data from adamantane resistance testing are not presented.
Outpatient and Emergency Department Illness Surveillance
Outpatient respiratory illness visits
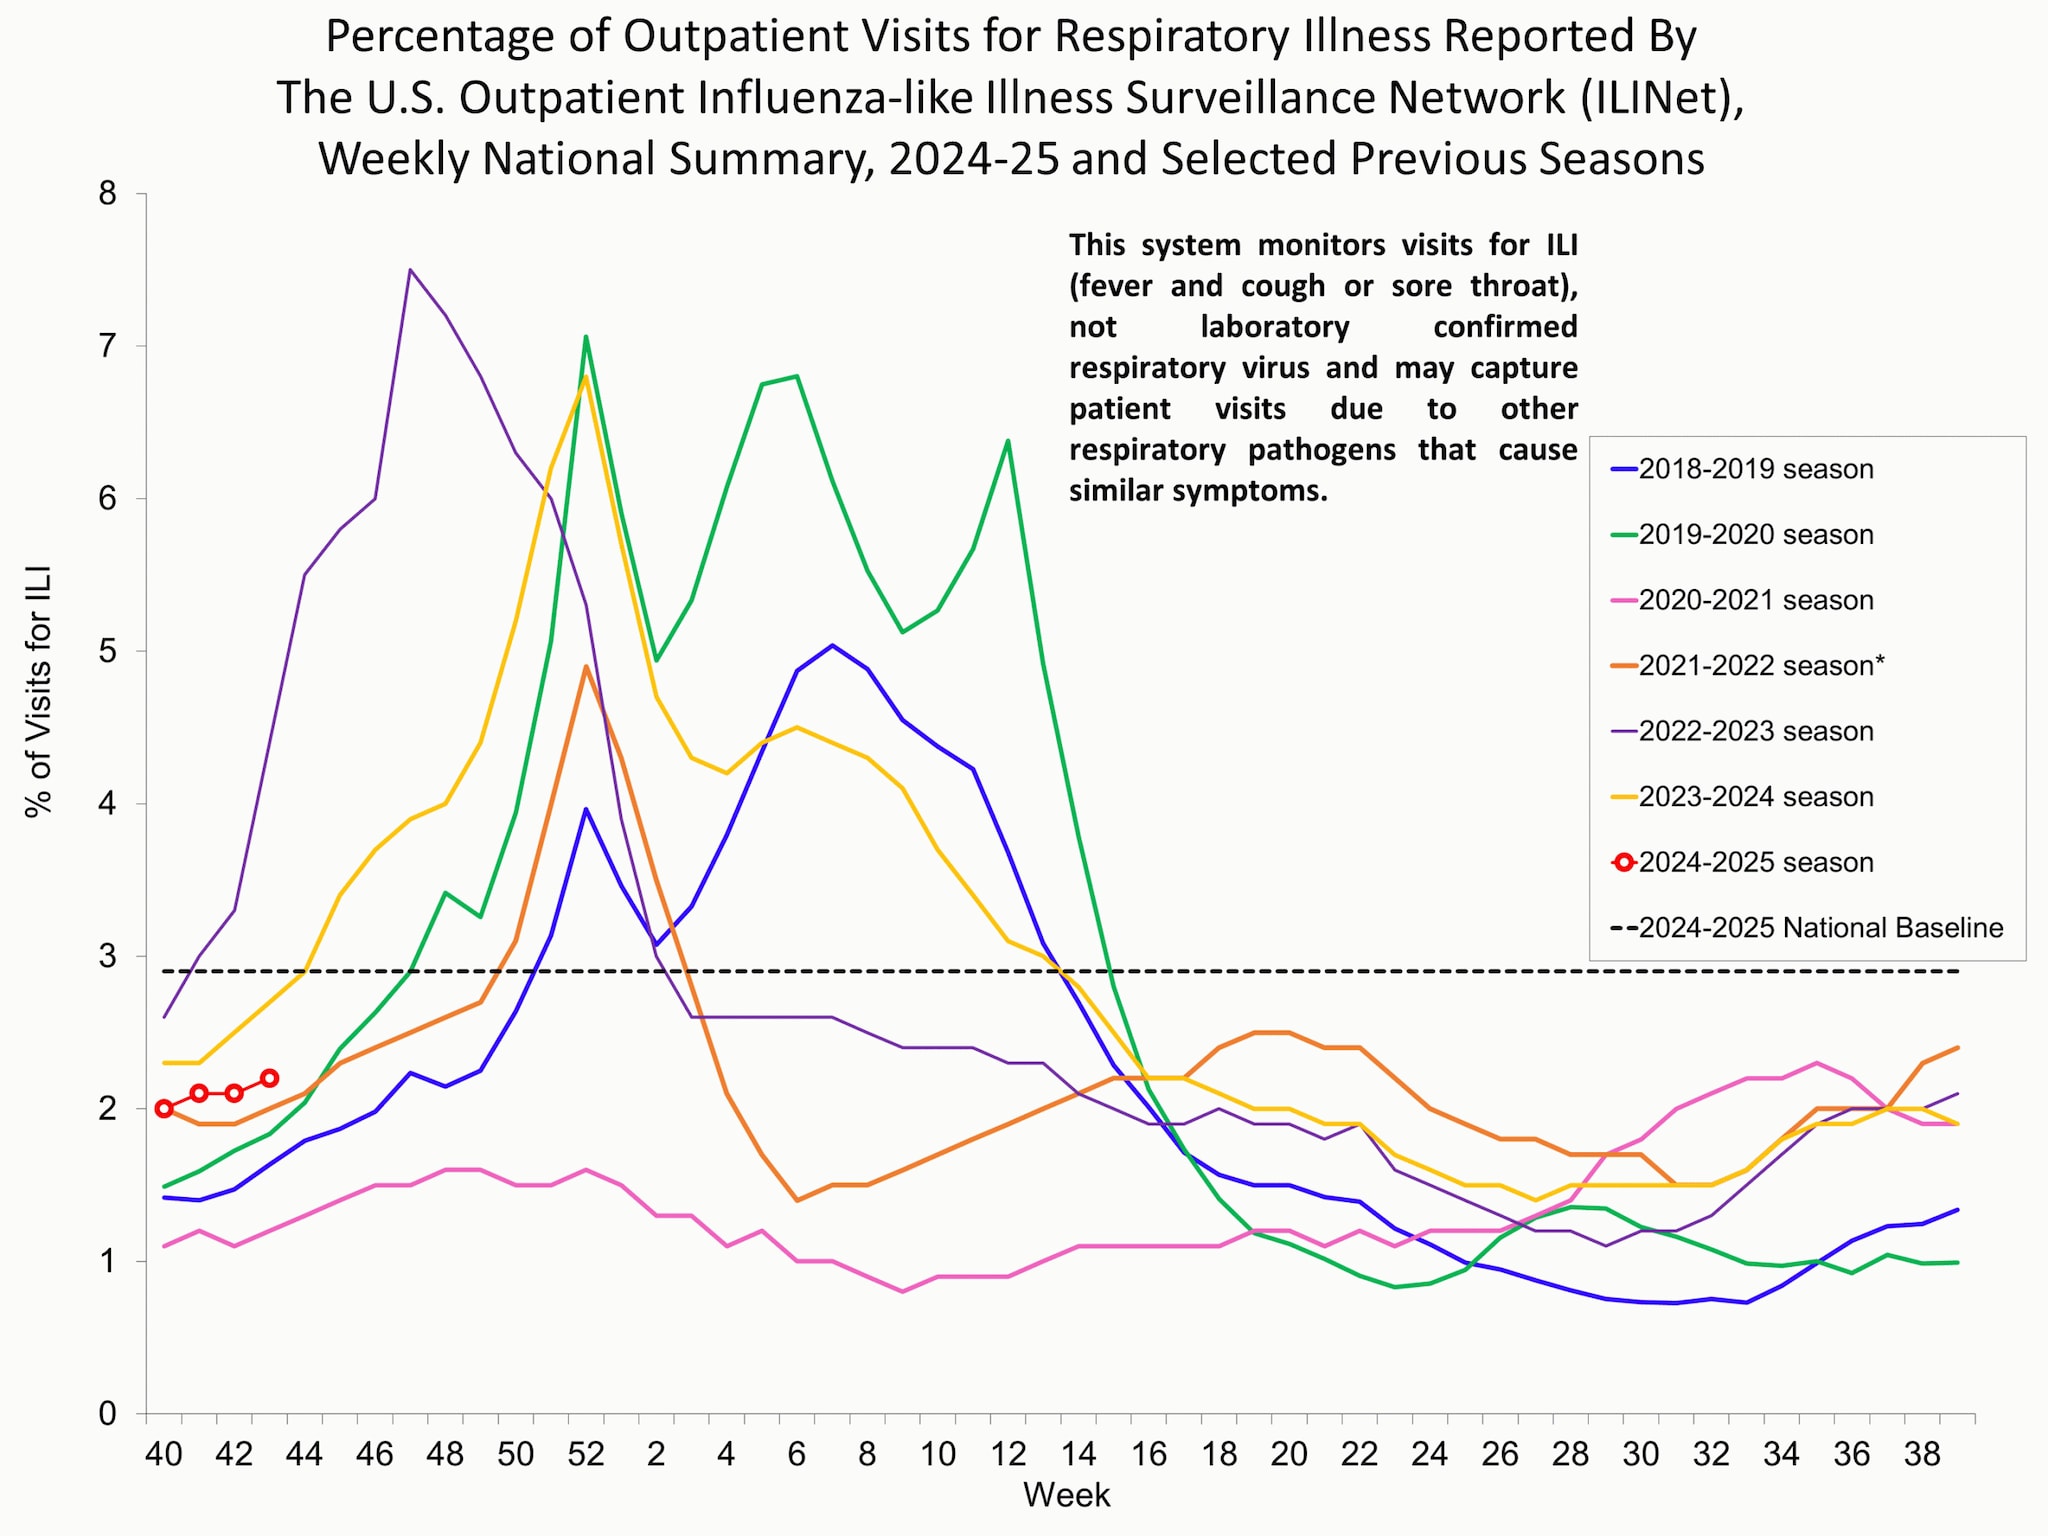
The U.S. Outpatient Influenza-like Illness Surveillance Network (ILINet) monitors outpatient visits for respiratory illness referred to as influenza-like illness [ILI (fever plus cough or sore throat)], not laboratory-confirmed influenza, and will therefore capture respiratory illness visits due to infection with any pathogen that can present with similar symptoms, including influenza virus, SARS-CoV-2, and RSV. It is important to evaluate syndromic surveillance data, including that from ILINet, in the context of other sources of surveillance data to obtain a complete and accurate picture of influenza, SARS-CoV-2, and other respiratory virus activity.
Nationally, during Week 43, 2.2% of patient visits reported through ILINet were due to respiratory illness that included fever plus a cough or sore throat, also referred to as ILI. This week's percentage remained stable (change of ≤ 0.1 percentage points) compared to Week 42 but is trending upwards slightly since early October. Nationally and in all 10 HHS regions, the percentage of visits for ILI are below their respective baselines. The percentage of visits for ILI increased in regions 4, 6, and 9, and remained stable in all other regions (1, 2, 3, 5, 7, 8, and 10) in Week 43 compared to Week 42. Multiple respiratory viruses are co-circulating, and the relative contribution of influenza virus infection to ILI varies by location.
Outpatient respiratory illness visits by age group
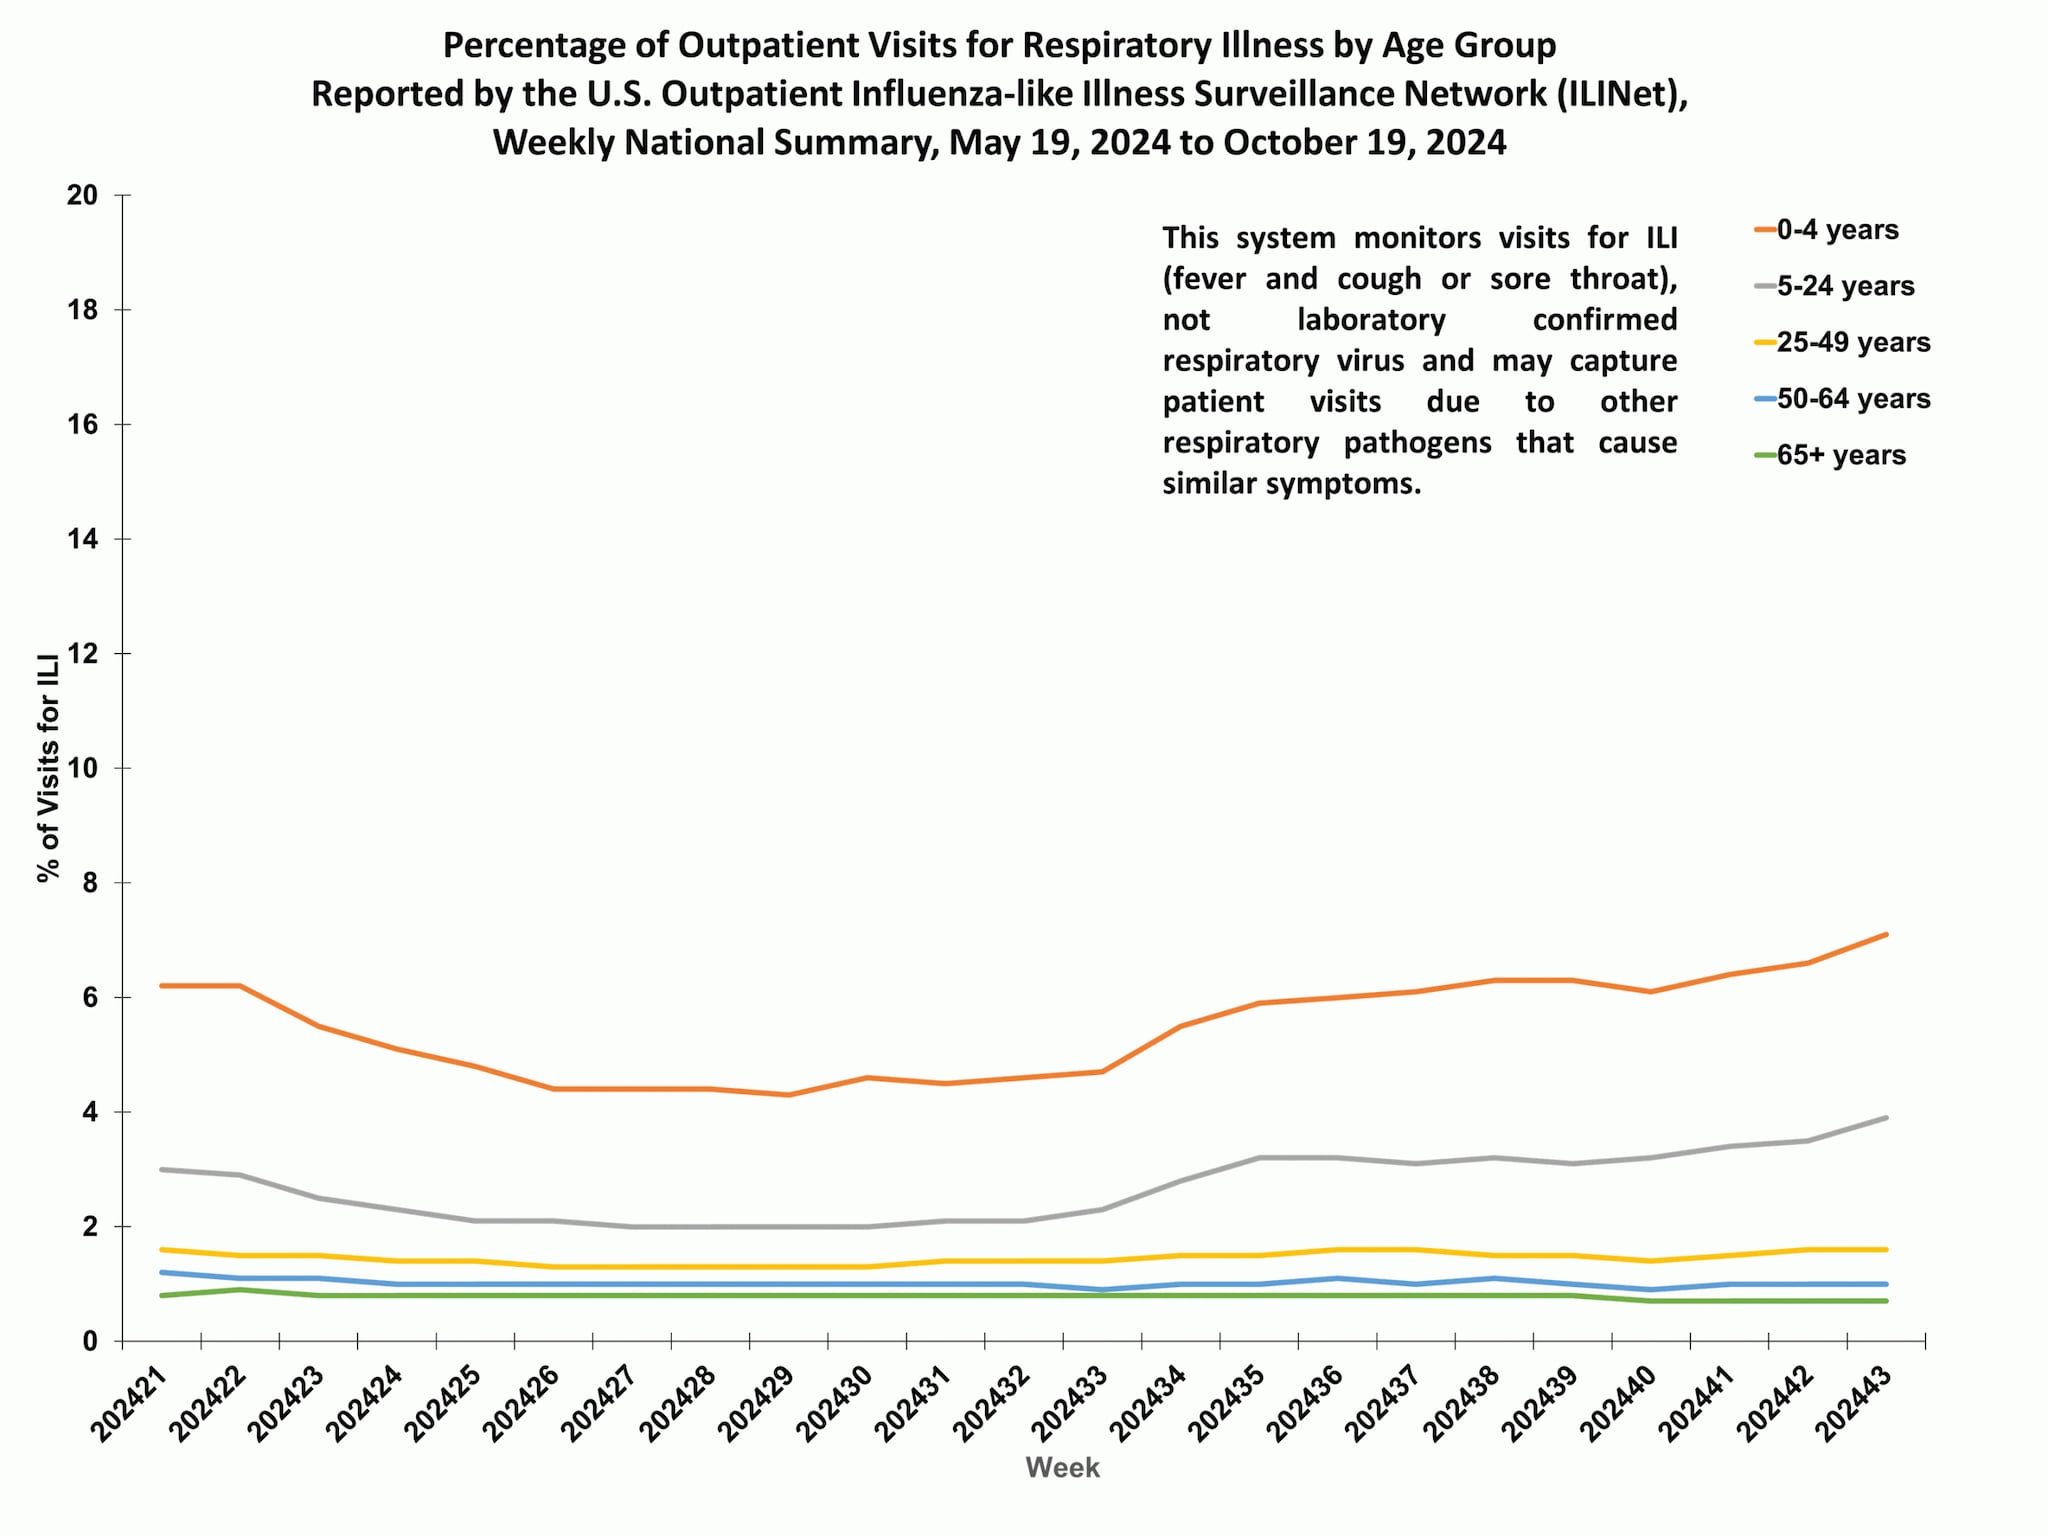
About 70% of ILINet participants provide both the number of patient visits for respiratory illness and the total number of patient visits for the week broken out by age group. Based on these data, the percentage of visits for respiratory illness increased (change of ≥ 0.1 percentage point) in the 0-4 years and 5-24 years age groups and remained stable (change of ≤ 0.1 percentage point) in the 25-49 years, 50-64 years, and 65+ years age groups in Week 43 compared to Week 42.
Outpatient respiratory illness activity map
Data collected in ILINet are used to produce a measure of ILI activity* by state/jurisdiction and Core Based Statistical Areas (CBSA).
| Activity Level | Number of Jurisdictions | Number of CBSAs | ||
|---|---|---|---|---|
| Week 43 (Week ending Oct. 26, 2024) |
Week 42 (Week ending Oct. 19, 2024) |
Week 43 (Week ending Oct. 26, 2024) |
Week 42 (Week ending Oct. 19, 2024) |
|
| Very High | 0 | 0 | 0 | 0 |
| High | 0 | 0 | 4 | 2 |
| Moderate | 1 | 1 | 14 | 9 |
| Low | 7 | 4 | 66 | 61 |
| Minimal | 47 | 50 | 612 | 636 |
| Insufficient Data | 0 | 0 | 233 | 221 |
*Data collected in ILINet may disproportionally represent certain populations within a jurisdiction or CBSA, and therefore, may not accurately depict the full picture of influenza activity for the entire jurisdiction or CBSA. Differences in the data presented here by CDC and independently by some health departments likely represent differing levels of data completeness with data presented by the health department likely being the more complete.
National Syndromic Surveillance System (NSSP)
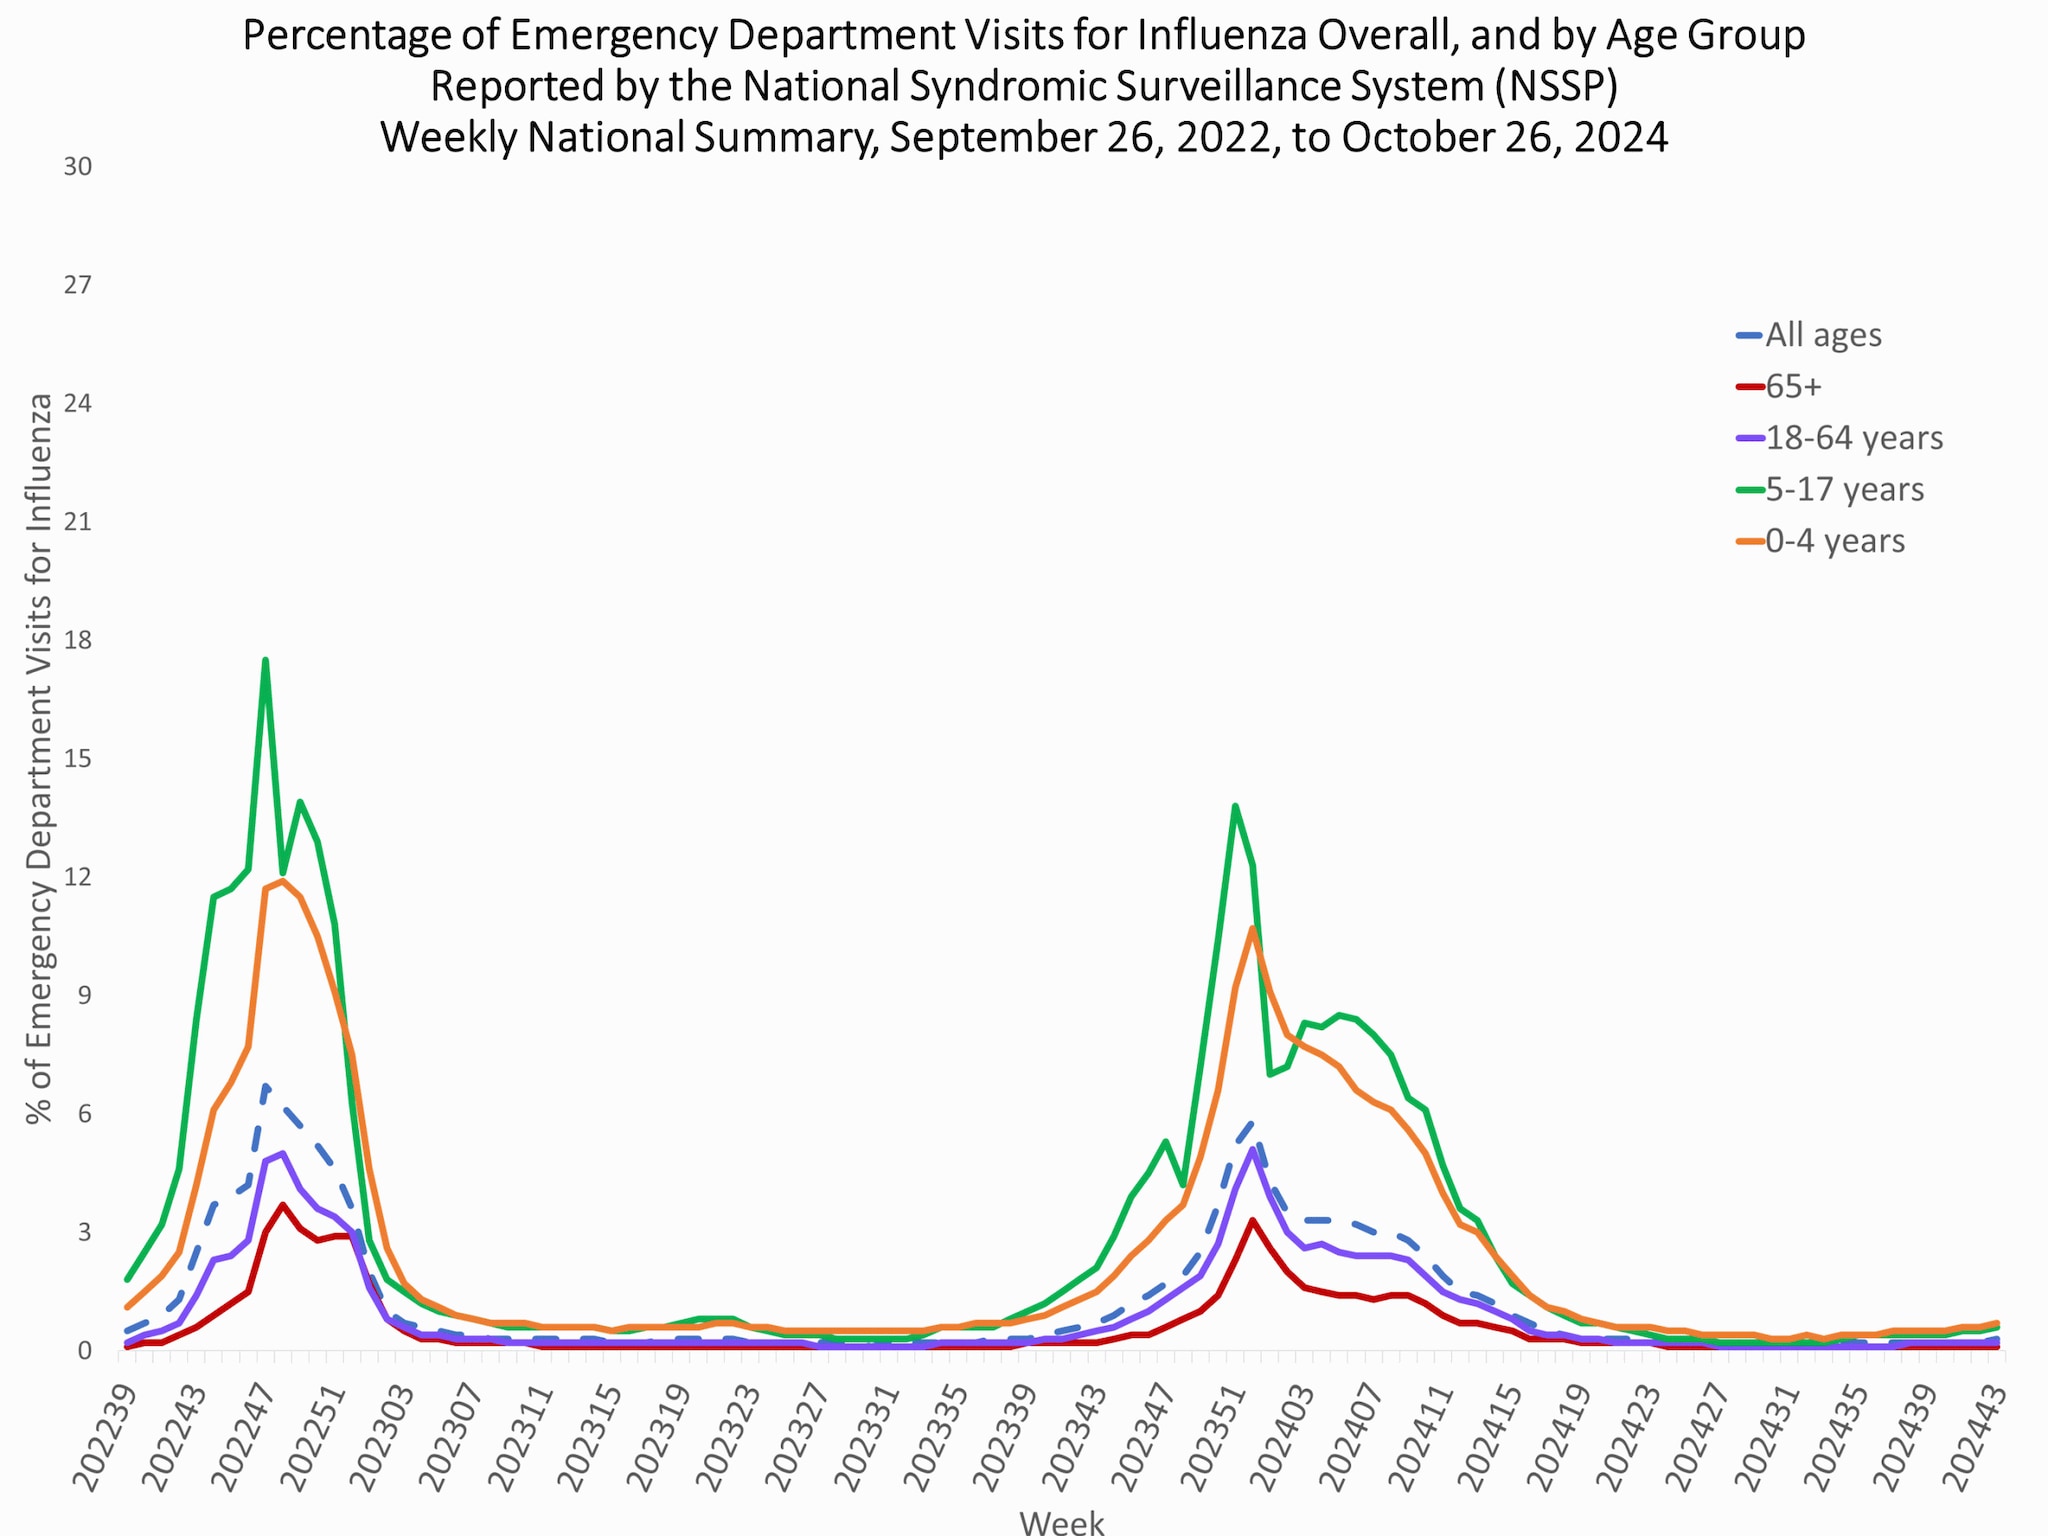
The overall percentage of emergency department (ED) visits with a discharge diagnosis of influenza reported in NSSP was 0.3% during Week 43. Nationally, in all ten HHS regions and among all age groups, the percentage ED visits for influenza remained stable compared to the previous week (change of ≤ 0.1 percentage point).
Hospitalization surveillance
FluSurv-Net
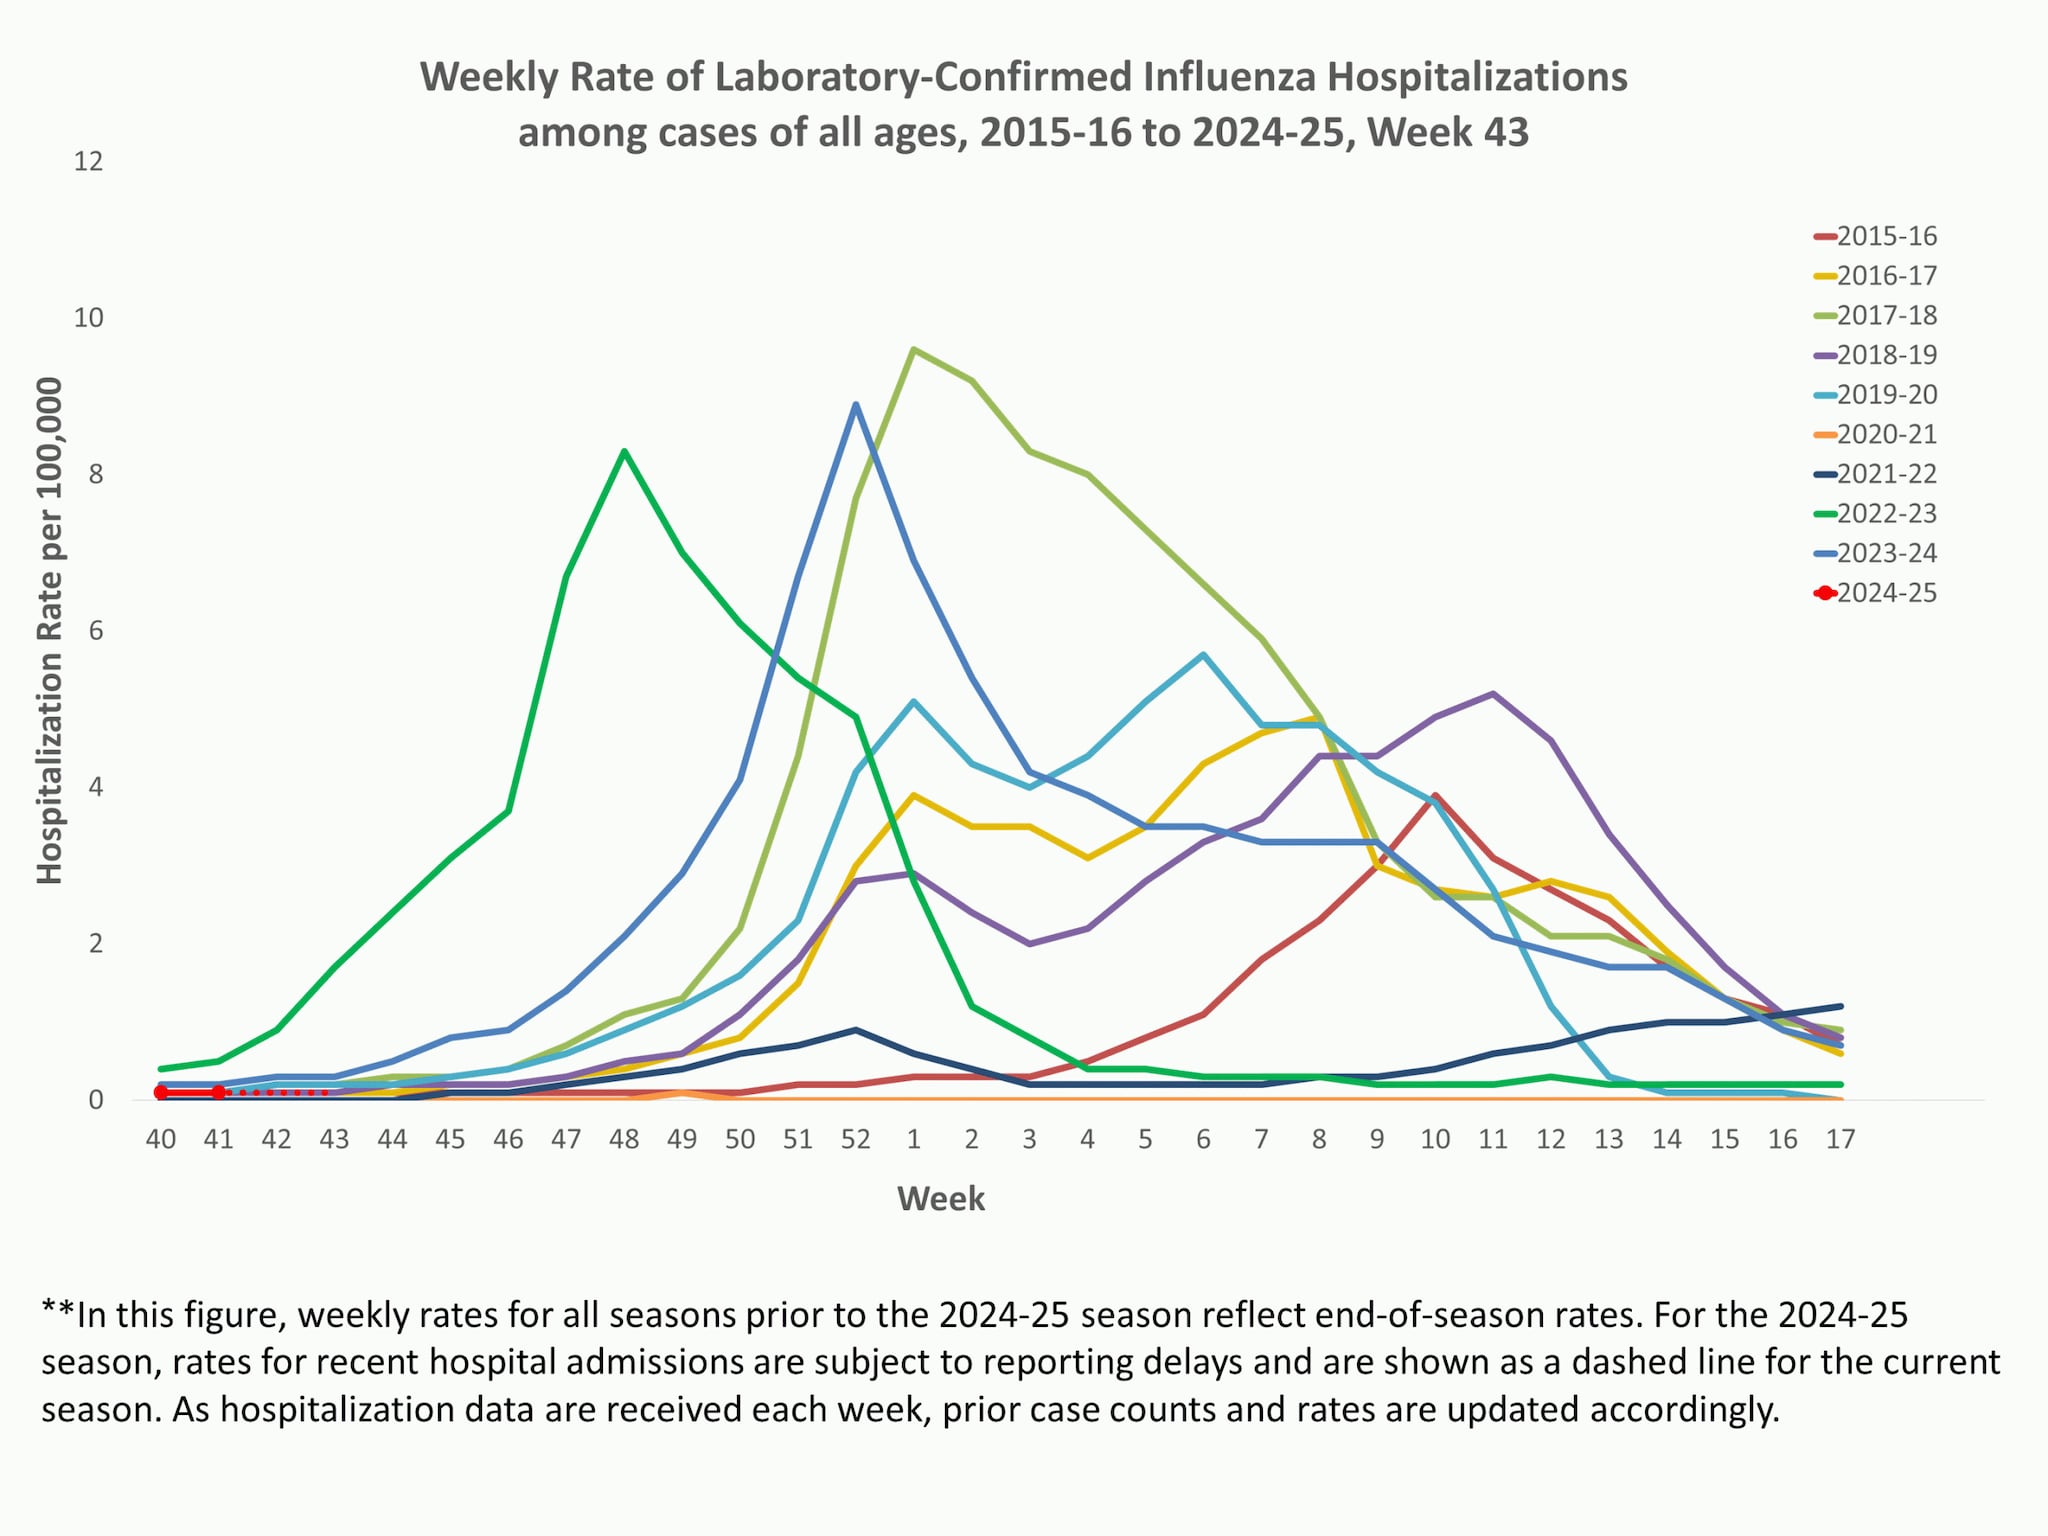
The Influenza Hospitalization Surveillance Network (FluSurv-NET) conducts population-based surveillance for laboratory-confirmed influenza-related hospitalizations in select counties in 14 states and represents approximately 9% of the U.S. population. FluSurv-NET hospitalization data are preliminary. As data are received each week, prior case counts and rates are updated accordingly.
A total of 134 laboratory-confirmed influenza-associated hospitalizations were reported by FluSurv-NET sites between October 1 and October 26, 2024. The weekly hospitalization rate observed in Week 43 was 0.1 per 100,000 population. The cumulative hospitalization rate observed in Week 43 was 0.4 per 100,000 population.
National healthcare safety network (NHSN) hospitalization surveillance
Effective May 1, 2024, hospitals are no longer required to report hospital admissions, hospital capacity, or hospital occupancy data to HHS through NHSN. Voluntarily reported NHSN hospital data can found at Weekly United States Hospitalization Metrics by Jurisdiction.
Mortality surveillance
National Center for Health Statistics (NCHS) Mortality Surveillance
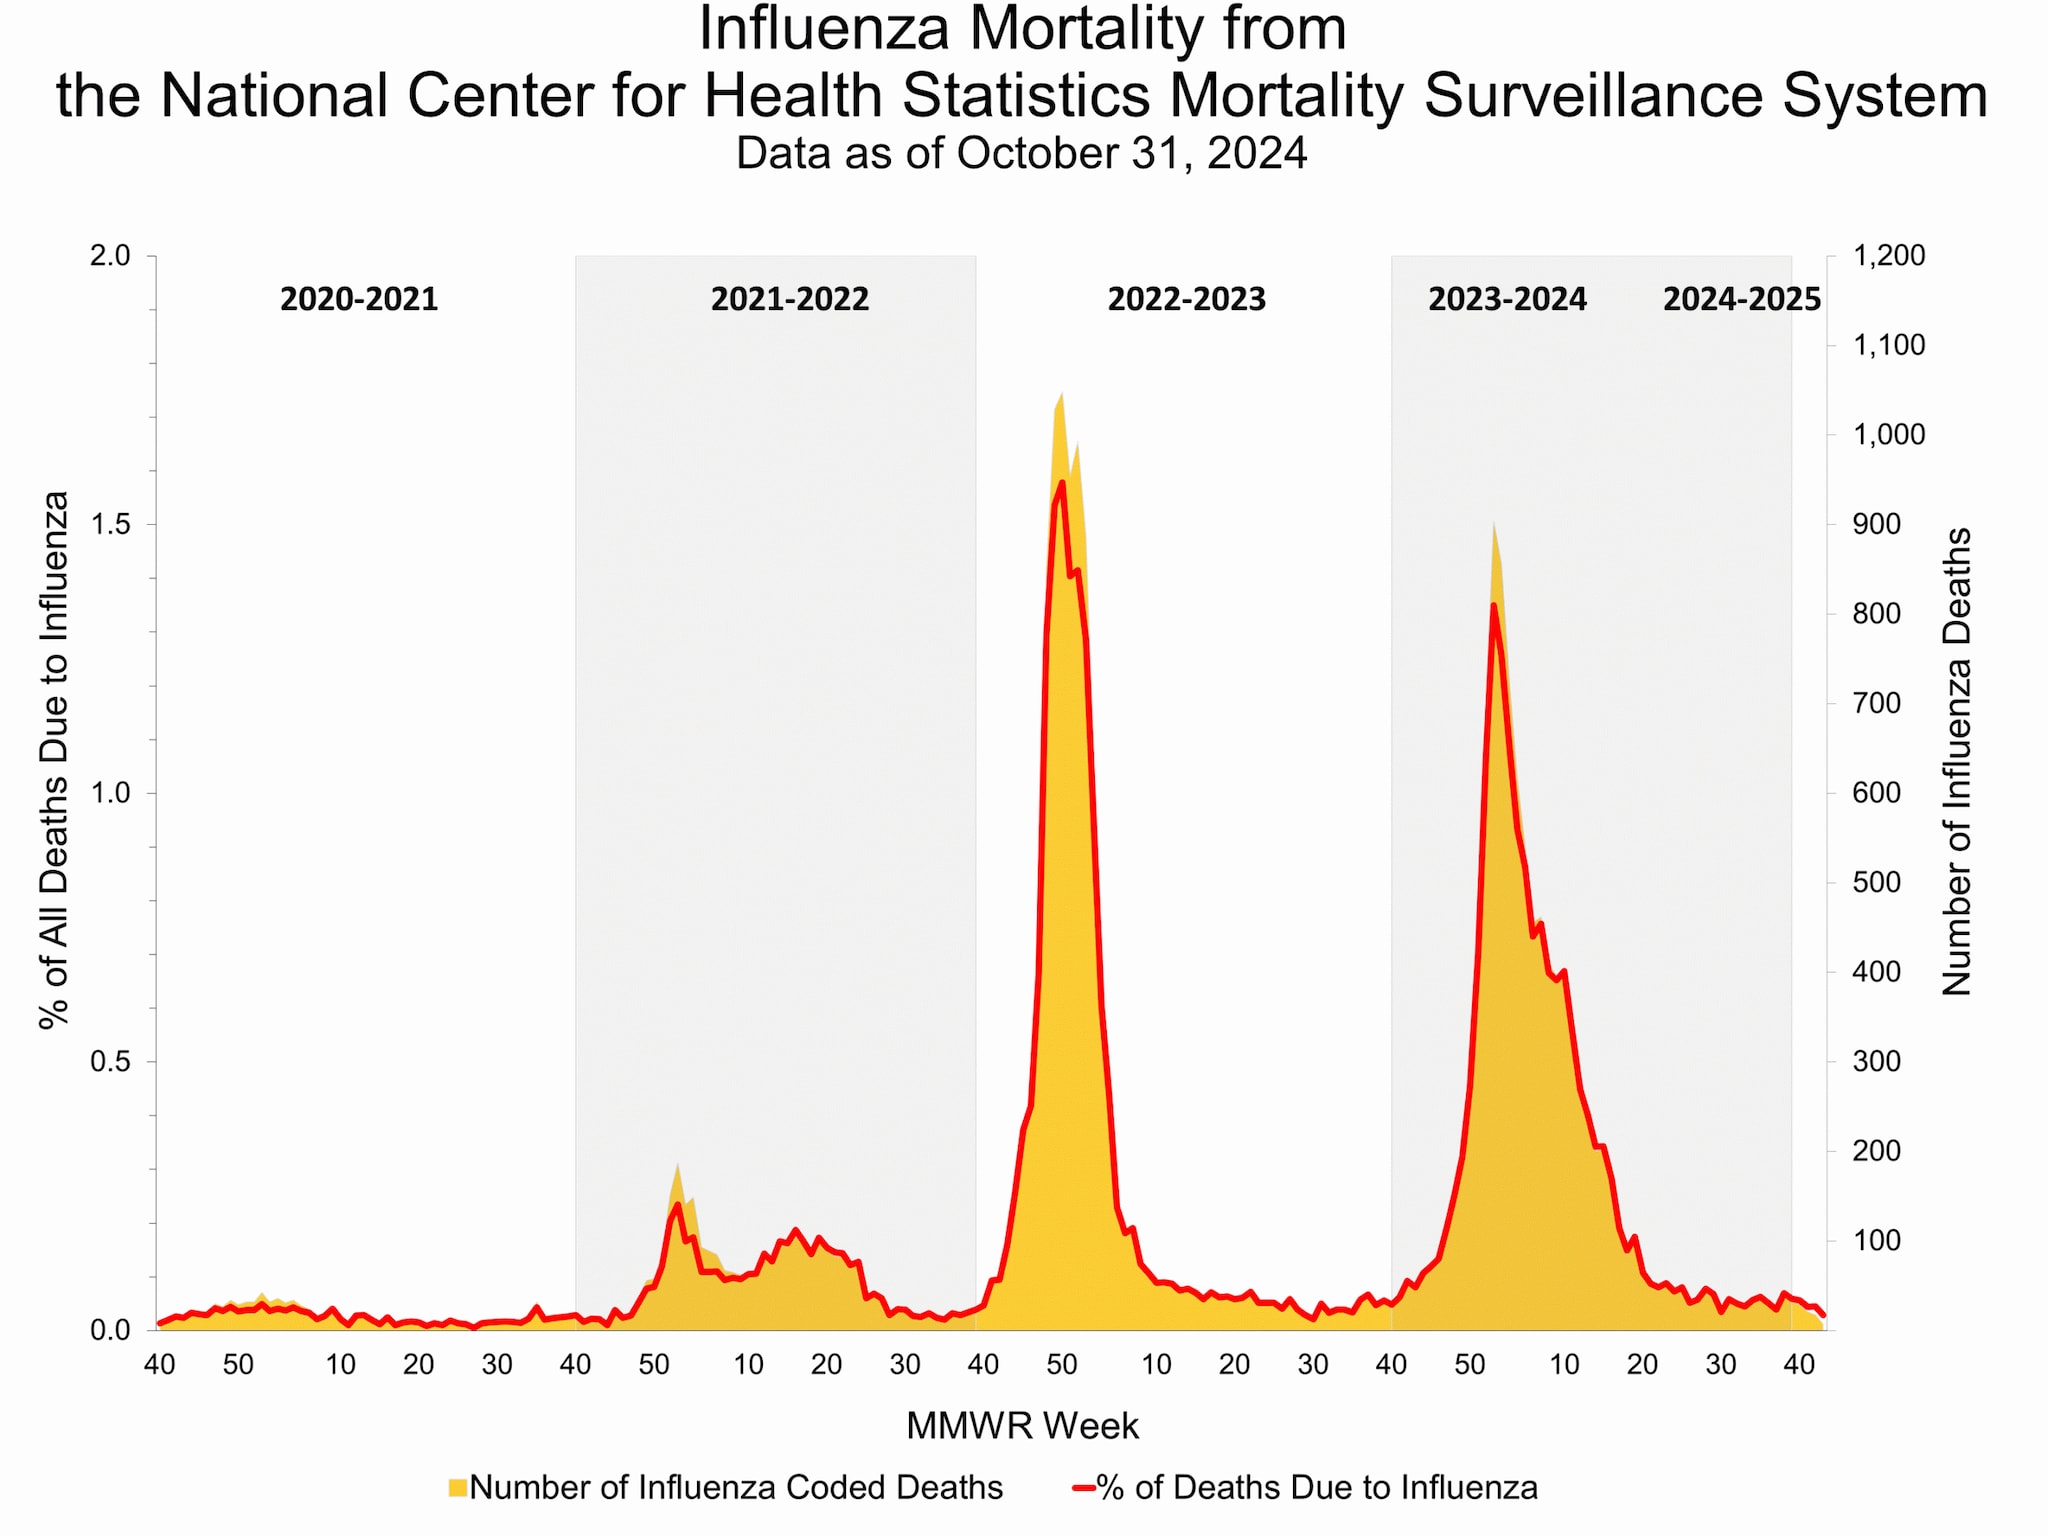
Based on NCHS mortality surveillance data available on October 31, 2024, 0.03% of the deaths that occurred during the week ending October 26, 2024 (Week 43), were due to influenza. This percentage remained stable (≤ 0.1 percentage point change) compared to Week 42. The data presented are preliminary and may change as more data are received and processed.
Influenza-Associated Pediatric Mortality
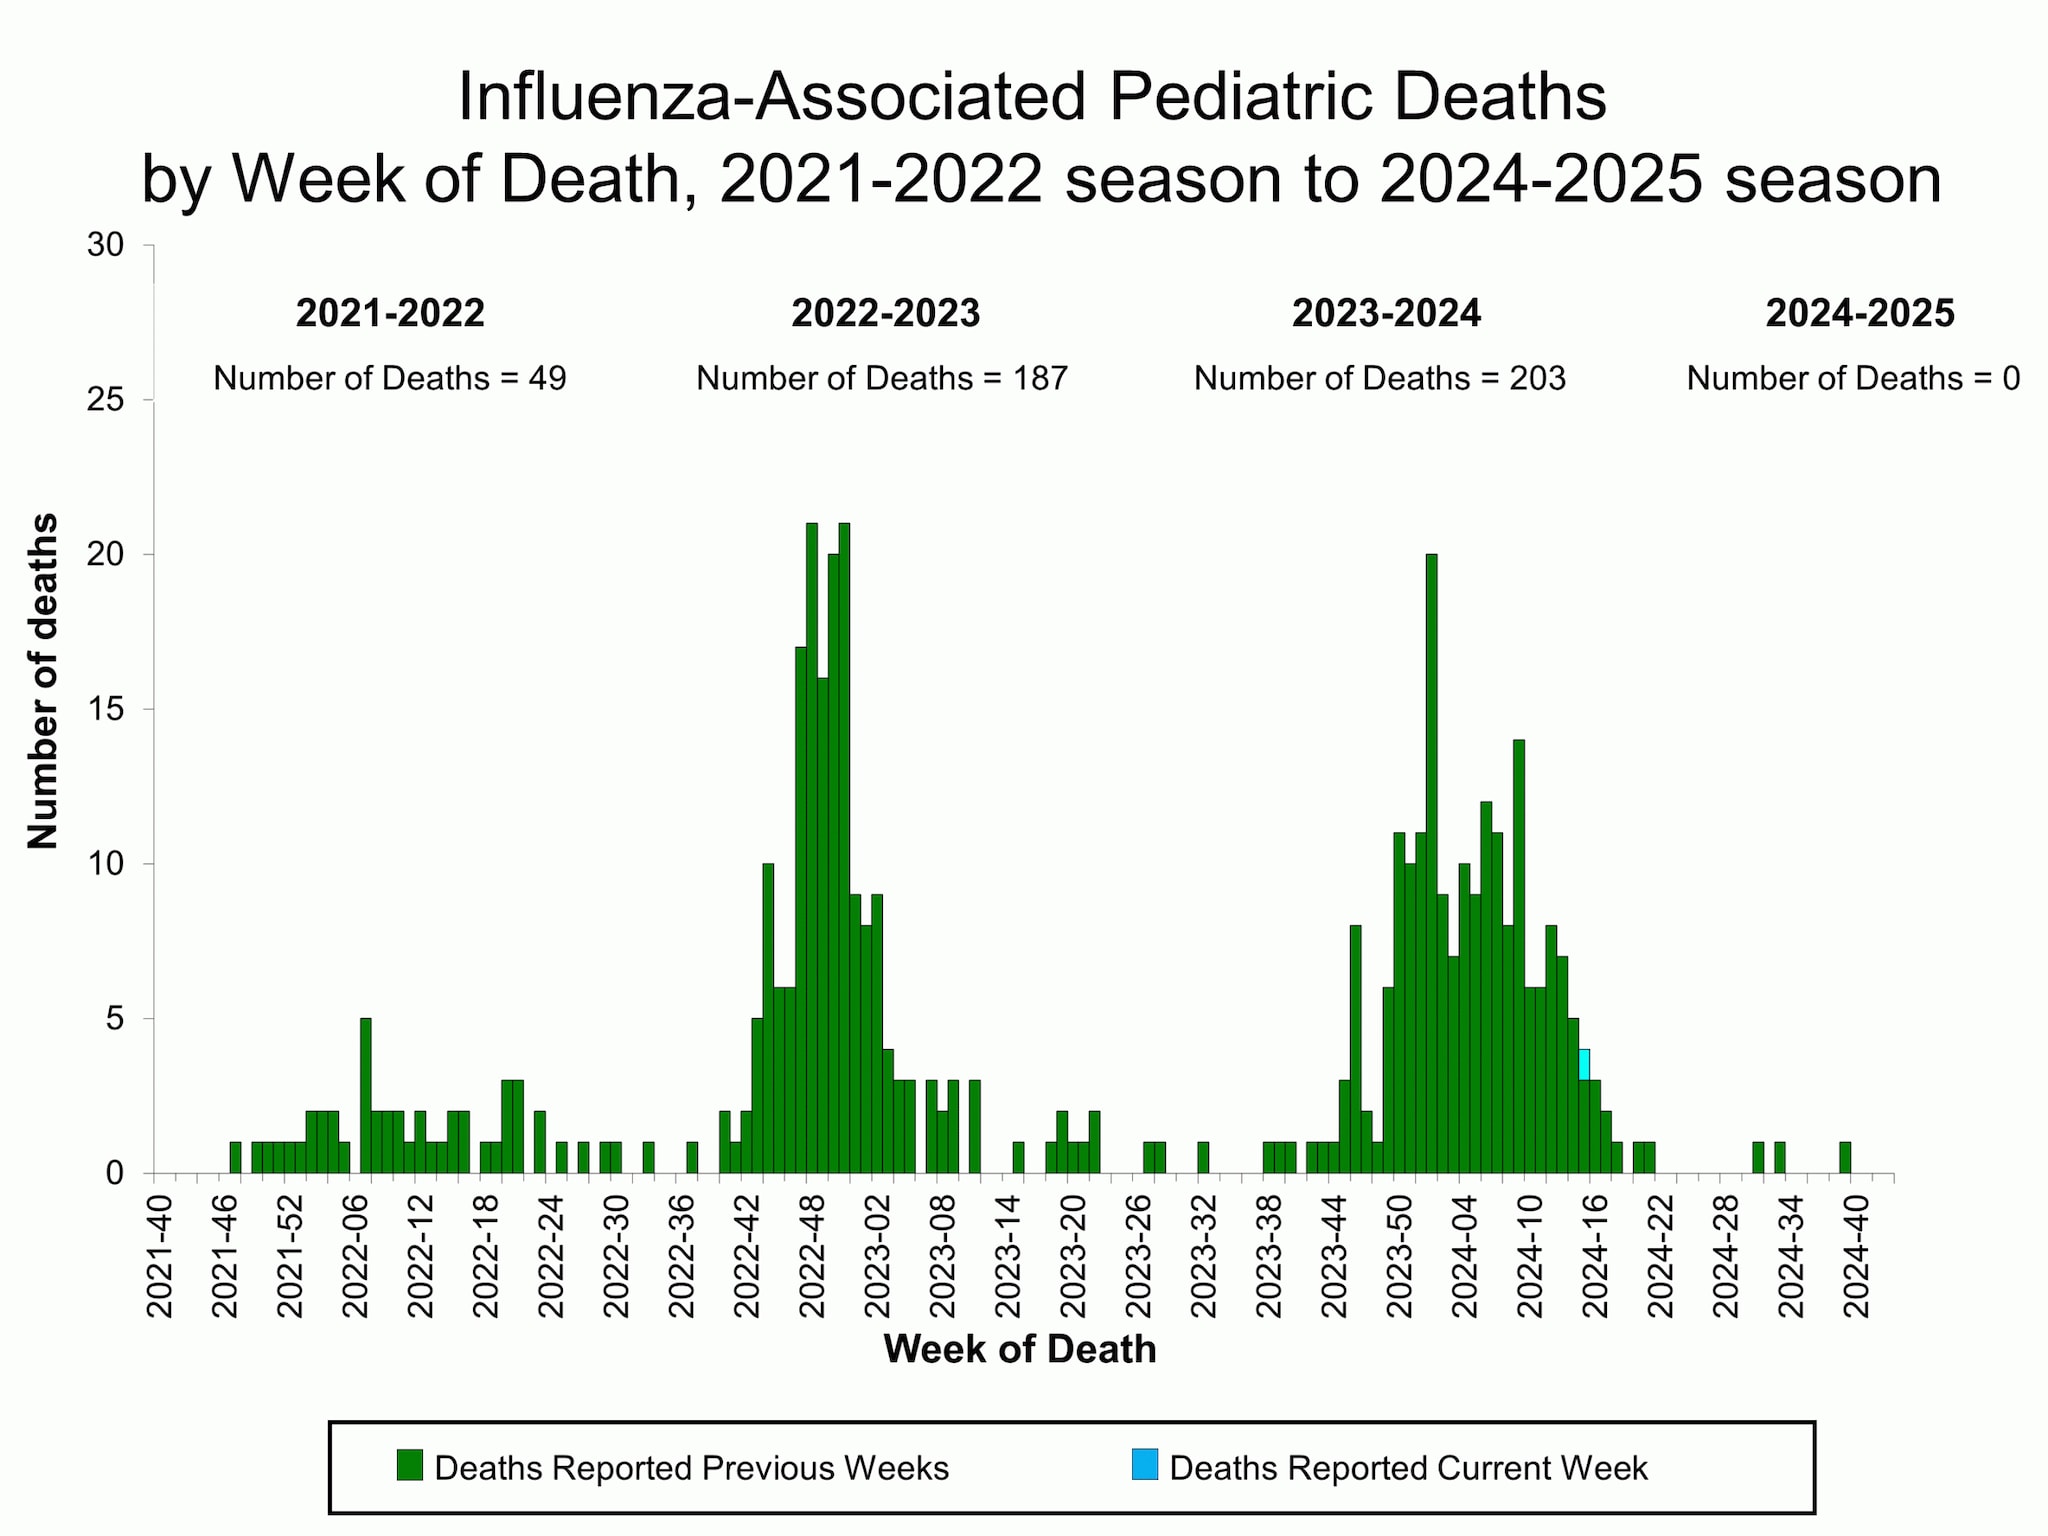
No influenza-associated pediatric deaths occurring during the 2024-2025 season have been reported to CDC.
One influenza-associated pediatric death occurring during the 2023-2024 season was reported to CDC during Week 43. This death was associated with an influenza A(H3) virus and occurred during Week 15 of 2024 (the week ending April 13, 2024). A total of 203 influenza-associated pediatric deaths that occurred during the 2023-2024 season have been reported to CDC.
Additional National and International Influenza Surveillance Information
Increasing: 
Decreasing: 
Stable: 
Clinical Labs: Up or down arrows indicate a change of greater than or equal to 0.5 percentage points in the percent of specimens positive for influenza compared to the previous week.
Outpatient Respiratory Illness (ILINet): Up or down arrows indicate a change of greater than 0.1 percentage points in the percent of visits due to respiratory illness (ILI) compared to the previous week.
NHSN Hospitalizations: Up or down arrows indicate change of greater than or equal to 5% of the number of patients admitted with laboratory-confirmed influenza compared to the previous week.
NCHS Mortality: Up or down arrows indicate change of greater than 0.1 percentage points of the percent of deaths due to influenza compared to the previous week.
FluView Interactive: FluView includes enhanced web-based interactive applications that can provide dynamic visuals of the influenza data collected and analyzed by CDC. These FluView Interactive applications allow people to create customized, visual interpretations of influenza data, as well as make comparisons across flu seasons, regions, age groups and a variety of other demographics.
National Institute for Occupational Safety and Health: Monthly surveillance data on the prevalence of health-related workplace absenteeism among full-time workers in the United States are available from NIOSH.
U.S. State and local influenza surveillance: Select a jurisdiction below to access the latest local influenza information.
World Health Organization:
Additional influenza surveillance information from participating WHO member nations is available through FluNet and the Global Epidemiology Reports.
WHO Collaborating Centers for Influenza:
Australia, China, Japan, the United Kingdom, and the United States (CDC in Atlanta, Georgia)
Europe:
The most up-to-date influenza information from Europe is available from WHO/Europe and the European Centre for Disease Prevention and Control.
Public Health Agency of Canada:
The most up-to-date influenza information from Canada is available in Canada's weekly FluWatch report.
Public Health England:
The most up-to-date influenza information from the United Kingdom is available from Public Health England.
Any links provided to non-Federal organizations are provided solely as a service to our users. These links do not constitute an endorsement of these organizations or their programs by CDC or the Federal Government, and none should be inferred. CDC is not responsible for the content of the individual organization web pages found at these links.
A description of the CDC influenza surveillance system, including methodology and detailed descriptions of each data component is available on the surveillance methods page.
- U.S. Influenza Surveillance: Purpose and Methods (2023 Oct). Centers for Disease Control and Prevention. https://www.cdc.gov/flu/weekly/overview.htm#ILINet.
- Influenza Antiviral Medications: Summary for Clinicians (2023 Sept). Centers for Disease Control and Prevention. https://www.cdc.gov/flu/professionals/antivirals/summary-clinicians.htm.
