Volume 27, Number 5—May 2021
Research
Prevalence and Clinical Profile of Severe Acute Respiratory Syndrome Coronavirus 2 Infection among Farmworkers, California, USA, June–November 2020
Abstract
During the ongoing coronavirus disease (COVID-19) pandemic, farmworkers in the United States are considered essential personnel and continue in-person work. We conducted prospective surveillance for severe acute respiratory syndrome coronavirus 2 (SARS-CoV-2) infection and antibody prevalence among farmworkers in Salinas Valley, California, during June 15–November 30, 2020. We observed 22.1% (1,514/6,864) positivity for SARS-CoV-2 infection among farmworkers compared with 17.2% (1,255/7,305) among other adults from the same communities (risk ratio 1.29, 95% CI 1.20–1.37). In a nested study enrolling 1,115 farmworkers, prevalence of current infection was 27.7% among farmworkers reporting >1 COVID-19 symptom and 7.2% among farmworkers without symptoms (adjusted odds ratio 4.16, 95% CI 2.85–6.06). Prevalence of SARS-CoV-2 antibodies increased from 10.5% (95% CI 6.0%–18.4%) during July 16–August 31 to 21.2% (95% CI 16.6%–27.4%) during November 1–30. High SARS-CoV-2 infection prevalence among farmworkers underscores the need for vaccination and other preventive interventions.
In response to the ongoing coronavirus disease (COVID-19) pandemic, the United States and other countries have implemented broad interventions to mitigate community transmission of severe acute respiratory syndrome coronavirus 2 (SARS-CoV-2) (1). Workers in food supply and other industries deemed essential to continuity of public health and safety have continued in-person work (2). COVID-19 outbreaks have been reported among various essential workforce groups, including employees in food processing facilities (3,4), but studies prospectively assessing risk for infection among essential workers involved in food production are lacking.
Agriculture and related food production industries comprise one of the lowest-paid sectors of the US economy; 29% of full-time workers earn an annual individual income of <$12,760 or $26,200 for a family of 4 (5). Agriculture in particular draws on a predominantly Latino immigrant workforce (6), who work longer hours, receive lower wages, and experience higher levels of household poverty than their US-born counterparts (7). Among immigrant farmworkers, ≈54% are undocumented and thus have reduced access to federal benefits under the Coronavirus Aid, Relief, and Economic Security Act (8). Working conditions, poverty, and immigration status have compounded legal and economic challenges faced by farmworkers during the COVID-19 pandemic (9,10).
We initiated surveillance of SARS-CoV-2 infection among farmworkers in Salinas Valley, California, to monitor the COVID-19 epidemic. We previously described impacts of the pandemic on economic well-being, mental health, and food insecurity within this population (A.M. Mora, unpub. data, https://doi.org/10.1101/2020.12.18.20248518). Here, we report on the prevalence of SARS-CoV-2 infection among farmworkers tested during June–November 2020 and on symptoms and antibody responses within a subset of farmworkers enrolled in a cross-sectional study.
Study Setting
The Salinas Valley is a 90-mile stretch of agricultural land in Monterey County, California; prominent farmed crops include leafy greens, berries, broccoli, artichokes, and wine grapes. The agricultural workforce comprises ≈50,000 resident farmworkers, and an additional ≈40,000 seasonal workers support the peak summer and fall seasons (11). The overall population of Salinas Valley is 75% Latino, and 30%–60% of the region’s farmworkers are believed to be undocumented (12). Severe overcrowding and household disrepair are common among farmworkers (13), and many live in multigenerational households (14) or in labor camps, vehicles, and informal dwellings (15). Many farmworkers travel long distances to work, often in shared trucks or buses, and might work in close proximity to one another. The living and working conditions of farmworkers have led to concern about the difficulty of preventing SARS-CoV-2 transmission among farmworkers and in their communities (16).
We undertook this study in partnership with Clínica de Salud del Valle de Salinas (CSVS), a federally qualified community and migrant health center in Monterey County. As the main healthcare provider for the region’s farmworkers and their families, CSVS operates a network of 12 comprehensive primary care centers serving >52,000 low-income, primarily Spanish-speaking patients. The study was reviewed and approved by the Committee for Protection of Human Subjects at University of California, Berkeley.
SARS-CoV-2 Testing
Testing for SARS-CoV-2 infection at CSVS clinics began on June 15, 2020, and was offered to all persons at clinics during weekday business hours. Medical personnel collected oropharyngeal specimens for detection of SARS-CoV-2 RNA via the qualitative Aptima SARS-CoV-2 Assay (Hologic, https://www.hologic.com), a nucleic acid transcription-mediated amplification (TMA) assay with an analytical sensitivity of 62.5 RNA transcript copies/mL (17) and clinical specificity of 99.9% (18). Patients receiving care from CSVS for any reason were encouraged by their healthcare providers to receive SARS-CoV-2 testing, regardless of symptoms; testing also was made available to persons who were not CSVS patients. No-cost testing for persons without insurance was supported by funding from the US Department of Health and Human Services Health Resources and Services Administration. In addition, CSVS conducted outreach testing via mobile testing facilities at community sites including low-income and employer-provided housing, agricultural fields, homeless shelters, food banks, and CSVS-run health fairs where free SARS-CoV-2 testing was offered alongside seasonal influenza vaccination and food donations.
Clinical Surveillance Study
As part of routine clinical intake, all patients >18 years of age were asked about employment. We considered farmworkers to include all persons engaged in work in agriculture, including crop, nursery, and greenhouse laborers; agricultural equipment operators; workers in packing sheds and other food processing facilities; and farm and ranch animal workers and breeders.
Cross-Sectional Study
Enrollment
To determine the distribution, dynamics, and clinical profile of infection among farmworkers, we invited farmworkers who were receiving a SARS-CoV-2 TMA test at CSVS to participate in a more in-depth cross-sectional study during July 16–November 30, 2020. This study included SARS-CoV-2 antibody testing and a detailed questionnaire. To advertise the study, Spanish- and English-language fliers were designed describing the opportunity to receive free SARS-CoV-2 testing from CSVS and participate in the study. The fliers were hung in CSVS clinics and distributed in the community and to area growers. We stationed the study team at CSVS testing facilities and aimed to approach all patients receiving SARS-CoV-2 TMA tests to screen for study eligibility and invite them to participate in the cross-sectional study. When time allowed, study personnel called patients who had scheduled SARS-CoV-2 testing appointments at CSVS on the day before their visit to advertise the study and screen for eligibility. Participants in an ongoing longitudinal study of farmworker families (12) and those living in housing for farmworkers also were invited to participate and to bring other farmworkers.
Eligible participants were nonpregnant adult farmworkers >18 years of age receiving SARS-CoV-2 TMA testing at CSVS. Participants were eligible if they had conducted farm work <14 days before their testing date, had not participated previously, and spoke sufficient English or Spanish to give consent and complete study procedures. To accommodate the end of the growing season, from October 5 onward we enrolled persons who had engaged in farm work any time since March 2020.
Study Procedures
The study team obtained a blood sample from each participant by venipuncture, measured participants’ height by using large-print tape measurers adhered to a post or wall, and measured their weight by using digital scales. The study team administered a 45-minute computer-guided questionnaire by telephone in Spanish or English within 48 hours of the enrollment visit and before SARS-CoV-2 testing results were available. Questionnaire items addressed participant demographics, socioeconomic status, symptoms since December 2019 and in the 2 weeks preceding enrollment, COVID-19 risk factors and exposures, and impacts of the pandemic on daily life and wellbeing (A.M. Mora et al., unpub. data, https://doi.org/10.1101/2020.12.18.20248518; A.M. Mora et al., unpub. data, https://doi.org/10.1101/2021.02.01.21250963). After participants completed all components of the study, the study team provided a $50 incentive via prepaid gift cards.
Blood specimens were stored immediately at 4°C–7°C and centrifuged <48 hours after collection. After centrifugation, plasma aliquots were heat-inactivated at 56°C for 30 minutes and stored at –80°C, then used for assessment of IgG reactivity against the SARS-CoV-2 spike protein via in-house ELISAs (19). In brief, recombinant full-length SARS-CoV-2 spike protein (courtesy of John Pak, Chan Zuckerberg Biohub, San Francisco, California) was coated on Nunc Maxisorp ELISA plates (Thermo Fisher Scientific, https://www.thermofisher.com) at 1.5 µg/mL. Plates were blocked with 2.5% nonfat dry milk in 1× phosphate-buffered saline (PBS) for 2 hours at 37°C. Plates were then washed 3 times in 1× PBS. Plasma samples diluted 1:100 in 1% nonfat dry milk in 1× PBS were added to the plate in duplicate wells. After a 1-hour incubation at 37°C, plates were washed 5 times in 1× PBS with 0.05% Tween-20 (Millipore Sigma, https://www.sigmaaldrich.com). Bound antispike IgG was detected by using horseradish peroxidase-conjugated goat anti-human IgG (Thermo Fisher Scientific). Plates were developed by using a 3,3′,5,5′-tetramethylbenzidine solution, and the reaction was stopped with 2 mol sulfuric acid after 6 minutes. We performed prior assay validation using convalescent serum samples collected >8 days post symptom onset from 60 hospitalized, PCR-confirmed COVID-19 cases, 57 of which were mild or subclinical and serum samples collected before 2020 from 131 unexposed persons.
We considered specimens positive for anti-SARS-CoV-2 spike IgG if the ELISA optical density (OD) value was >0.096. This cutoff maximized area under the receiver operating characteristic curve, yielding 94.0% sensitivity and 98.5% specificity. We processed all specimens in duplicate; conducted reflex testing if >1 OD measurement fell in the borderline range of 0.07–0.3 or if the coefficient of variation between replicates was >30% and >1 OD measure was >0.07. We confirmed positive specimens by noting presence of IgG against the receptor-binding domain (RBD) of SARS-CoV-2 spike protein (courtesy of John Pak, Chan Zuckerberg Biohub) using the protocol described above and substituting the coating antigen with RBD at 3 µg/mL. We considered specimens positive when RBD ELISA OD values were >0.205, determined via a similar validation process as described above for spike protein.
Statistical Analyses
Clinical Surveillance Study
We tabulated results for all patients tested at CSVS during June 15–November 30, 2020, by age, sex, and farmworker status. We also computed 2-week moving averages in the daily proportion of tests yielding positive results and estimates of the final proportion of positive tests by patient age, sex, and farmworker status. We used beta distribution to define 2.5% and 97.5% quantiles for the proportion positive.
Cross-Sectional Study
We computed adjusted odds ratios (aORs) using logistic regression models accounting for age, sex, and venue to determine the association of symptoms experienced in the previous 2 weeks with a positive test result. We used the same logistic regression framework to estimate aORs for the association of each symptom experienced in the prior 2 weeks or at any time since December 2019 with continuous SARS-CoV-2 antibody OD measures.
We computed stabilized sampling weights (20) to correct for differences in the population enrolled in the study over time when estimating prevalence of infection to generate weights for each recruitment period, July 16–August 31, September 1–30, October 1–31, or November 1–30. We fit a multinomial logistic regression model that included a list of possible exposures (Table 1), the number of symptoms participants reported in the preceding 2 weeks, and the recruitment venue as predictors.
We estimated period-specific prevalence of SARS-CoV-2 infection and seropositivity, accounting for inverse sampling weights, by using a generalized linear model with a log-binomial link function. Models accounted for the 4 recruitment periods, presence of any symptoms, and recruitment venue. We used the model parameter estimates to summarize period-specific prevalence of TMA-positive and seropositive status for persons with and without symptoms whom we would expect to reach via community outreach. To account for missing data (1.1% of observations across all outcome and predictor variables), we sampled estimates from 5 independent iterations of the analysis carried out on multiple-imputed datasets. We conducted analyses in R version 4.0.3 (R Foundation for Statistical Computing, https://www.r-project.org); we used the Amelia II package (21) for multiple imputation and fit the multinomial logistic model using the nnet package (22).
Clinical Surveillance Study
Figure 1
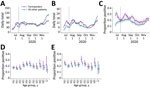
Figure 1. Cases of severe acute respiratory syndrome coronavirus 2 (SARS-CoV-2) diagnosed at Clínica de Salud del Valle de Salinas (CSVS), Monterey County, California, USA, June 15–November 30, 2020. We plotted the...
During June 15–November 30, CSVS administered 14,169 SARS-CoV-2 TMA tests to adults, including 6,864 tests among farmworkers and 7,305 among other adults living in the same communities (Figure 1, panel A). In total, 1,514 (22.1%) tests among farmworkers had positive results, compared with 1,255 (17.2%) among other adults in the same communities, which corresponds to a 28.5% (95% CI 20.1%–37.4%) higher probability of positive test results among farmworkers (Figure 1, panels B, C). The test-positive fraction was similarly higher among men than among women, for both farmworkers (men 23.7% vs. women 20.5%; risk ratio [RR] 1.16, 95% CI 1.06–1.27) and nonfarmworkers (men 21.7% vs. women 18.8%; RR 1.15, 95% CI 1.09–1.23). Point estimates of the test-positive fraction were consistent with equal or higher prevalence of infection among farmworkers across all age and sex strata (Figure 1, panels D, E).
Among farmworkers, multiple peaks in the proportion of TMA tests yielding positive results were evident, with the moving average of the test-positive fraction reaching 32.0% (95% CI 27.2%–37.0%) over the period of June 23–July 7 and 30.4% (95% CI 27.0%–34.0%) over the period of August 7–21 (Figure 1, panel C). After declining from mid-September to early October, both the number of tests and the proportion yielding positive results increased through the remainder of the study period. During October 10–November 23, the 2-week moving average of the number of tests conducted daily increased from 35.5 to 69.5 among farmworkers and from 38.7 to 104.5 among other adults. The proportion positive tests increased from 15.4% (95% CI 12.2%–18.8%) to 22.7% (95% CI 20.0%–25.5%) among farmworkers and from 12.1% (95% CI 9.4%–15.1%) to 19.9% (95% CI 17.9%–22.1%) among other adults. This increase in case volume among nonfarmworker adults in November, without a commensurate rise among farmworkers, coincided with the annual migration of many Salinas Valley farmworkers to Yuma, Arizona, and elsewhere (23).
Cross-Sectional Study
Figure 2
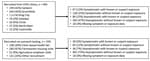
Figure 2. Participants recruited into the cross-sectional study of coronavirus disease (COVID-19) among farmworkers, Monterey County, California, USA, July 16–November 30, 2020. Number of farmworkers recruited at each participating CSVS clinic and...
Our cross-sectional study recruited 1,115 farmworkers, including 565 who were tested at clinics and 550 tested through outreach efforts (Figure 2). SARS-CoV-2 TMA test results were obtained for 1,111 (99.6%) participants and ELISAs conducted for 1,058 (94.9%) participants (Table 2). Most of the farmworkers in this study were born in Mexico, spoke Spanish at home, had primary school-level education or less, earned <25,000 $US per year (Table 2), and worked in the fields (Table 1); 36.3% lived in crowded housing (Table 1). Most (81.8%) were overweight or obese, but only 4.4% were current smokers (Table 1). Compared with farmworkers recruited via outreach, farmworkers recruited at clinics had lower levels of educational attainment and had been in the United States fewer years. More spoke indigenous languages at home (14.9% vs. 4.7%; Table 2) and reported contact with an individual experiencing respiratory symptoms in the 2 weeks prior to testing (17.9% vs. 3.3%; Table 1).
Overall, 27.2% of participants reported symptoms potentially related to COVID-19 in the previous 2 weeks and 41.2% reported symptoms since the start of the pandemic (Table 3). A higher proportion of farmworkers recruited at clinics compared with those recruited via outreach reported >1 symptom potentially attributable to COVID-19 in either the 2 weeks before testing (35.8% vs. 18.4%) or the period since December 2019 (47.7% vs. 34.7%) (Table 2). Among all farmworkers, 12.7% tested TMA-positive for current SARS-CoV-2 infection, including 18.7% of farmworkers tested at clinics and 6.6% of those tested via outreach (Table 2). In contrast, 19.0% of farmworkers tested via ELISA were found to have antibody evidence of prior infection; similar prevalence was found among those tested in the clinics (18.4%) and via outreach (19.4%).
Figure 3
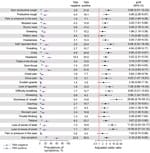
Figure 3. Association of symptoms and current TMA-positive severe acute respiratory syndrome coronavirus 2 (SARS-CoV-2) infection in cross-sectional study of farmworkers, Monterey County, California, USA, July 16–November 30, 2020. Illustration of the...
Of all farmworkers who had TMA-positive test results, 58.9% reported symptoms in the preceding 2 weeks, including 64.8% among those recruited from the clinic and 41.7% of those recruited via outreach (Table 3). Overall, 27.2% of those who had any potential COVID-19 symptoms in the 2 weeks before enrollment had current TMA-positive SARS-CoV-2 infection. Prevalence of current infection among farmworkers recruited in the clinic was 34.2% for those reporting any symptoms and prevalence was 10.1% for those reporting no symptoms. Among farmworkers recruited from outreach testing, current TMA-positive SARS-CoV-2 infection was detected in 14.9% of those reporting any symptoms and 4.7% among those reporting no symptoms (Table 3). After adjustment for age, sex, and recruitment setting, the aOR of a TMA-positive SARS-CoV-2 test result was 4.16 (95% CI 2.85–6.06) among farmworkers reporting any of the solicited symptoms in the previous 2 weeks compared with those reporting no symptoms (Figure 3).
Symptoms most strongly associated with current SARS-CoV-2 infection included shortness of breath (aOR 26.86, 95% CI 8.78–83.31), loss of smell (aOR 14.06, 95% CI 6.37–31.15), loss of taste (aOR 11.62, 95% CI 5.52–24.77), and self-reported fever (aOR 9.06, 95% CI 5.02–16.39). Each of these symptoms, however, was reported by <25% of persons with current SARS-CoV-2 infection. For the most commonly reported symptoms among persons testing positive, headache (33.0%) was associated with 3.52-fold (95% CI 2.31–5.33) higher adjusted odds of SARS-CoV-2 RNA detection, and myalgia (31.6%) was associated with 6.13-fold (95% CI 3.83–9.77) higher adjusted odds.
Figure 4
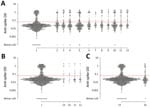
Figure 4. Scatter plot of anti-spike IgG reactivity and association with recalled coronavirus disease (COVID-19) symptoms in a cross-sectional study of farmworkers, Monterey County, California, USA, July 16–November 30, 2020. A) Reactivity...
Persons who recalled experiencing a blocked nose, sweating, chills, headache, a tickling sensation in the throat, a feeling of pain or pressure in the sinuses, loss of appetite, shortness of breath, fatigue, loss of taste, or loss of smell since December 2019 had higher antibody reactivity, on average, than persons who did not recall experiencing such symptoms (Figure 4, panel A). We also identified higher antibody reactivity among persons experiencing wheezing or loss of taste in the preceding 2 weeks, and suggestive associations of higher antibody measurements with persons reporting chest pain and loss of smell in the preceding 2 weeks (Figure 4, panel B). We found no statistically significant difference in quantitative antibody reactivity measures among persons who were currently infected with SARS-CoV-2 compared with persons who were not (p = 0.3), suggesting associations of antibody reactivity with recent symptoms were not attributable to current infection. Among 129 TMA-positive cases 30 (18%) met the threshold for IgG seropositivity, as did 168/925 (23%) TMA-negative cases.
Figure 5
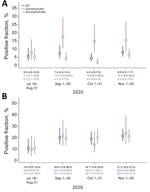
Figure 5. Prevalence of severe acute respiratory syndrome coronavirus 2 (SARS-CoV-2) positivity by transcription-mediated amplification (TMA) and seropositivity over time, Monterey County, California, USA, July 16–November 30, 2020. A) SARS-CoV-2 TMA; B)...
Reweighting the sample to adjust for differences among persons tested over time, we estimated the prevalence of current, TMA-positive SARS-CoV-2 infection within the population reached by outreach testing was 5.6% (95% CI 2.9%–10.6%) during July 16–August 31, 7.4% (95% CI 4.4%–12.4%) during September 1–30, 4.5% (95% CI 2.6%–7.5%) during October 1–31, and 8.0% (95% CI 5.5%–11.7%) during November 1–30 (Figure 5, panel A). These results closely tracked patterns in the proportion of tests yielding positive results among all farmworkers tested by CSVS (Figure 1, panel C). Over this period, we estimated 2.0% (95% CI 0.9%–4.4%) to 6.4% (95% CI 4.0%–10.2%) prevalence of current SARS-CoV-2 infection among asymptomatic persons and 7.7% (95% CI 3.7%–15.8%) to 17.4% (95% CI 10.4%–29.3%) prevalence of current SARS-CoV-2 infection among persons experiencing >1 symptom. Estimated seroprevalence increased from 10.5% (95% CI 6.0%–18.4%) to 21.2% (95% CI 16.6%–27.4%) over the duration of the study, with similar results among symptomatic and asymptomatic persons during each period (Figure 5, panel B).
Among all adults tested for SARS-CoV-2 infection by clinics serving the Monterey County farmworker population, test positivity was 28% higher for farmworkers than for nonfarmworkers from the same communities. Test positivity was much higher (22.1%) among farmworkers tested by CSVS compared with the overall test-positive fraction (6.1%) observed in Monterey County over the same period (24). Within the cross-sectional study subpopulation, we identified sustained high prevalence of infection: TMA-positive results among 6.6% of persons tested in the community and 18.7% of those tested in clinics. We estimated ≈10% of the farmworker population became infected over a 3-month period during the study, yielding ≈21% seroprevalence by November 2020. This seroprevalence is well above the 5% seroprevalence noted among California adults in a large-scale assessment of blood specimens submitted for routine clinical screening or clinical management in September (25). A previous study in San Francisco likewise identified elevated infection risk in an urban low-income and predominantly Latino population, with 6.0% prevalence of current infection among frontline workers and 7.7% seroprevalence by late April 2020 (26). Our findings demonstrate high infection risk among farmworkers during the ongoing pandemic.
We identified a diverse array of symptoms, including gastrointestinal and other nonrespiratory symptoms, associated with SARS-CoV-2 infection. Among persons found to be TMA-positive for current SARS-CoV-2 infection in our study, 41% did not report experiencing any symptoms in the 2 weeks preceding their test. Similar results have been reported in other studies (27). Of note, persons could have been presymptomatic at the time of their interview; in addition, asymptomatic persons who seek testing might not represent the broader community (for instance, if testing is triggered by known SARS-CoV-2 exposure). The ≈2%–6% prevalence of infection among persons without symptoms in the community suggests substantial risk for exposure to clinically inapparent cases. Guidance issued for growers to screen farmworkers for fever or other COVID-19 symptoms likely is inadequate to prevent workplace infections (28). We also identified associations of higher antibody reactivity with current symptoms, including loss of taste and smell, chest pain, and wheezing. Participants in our study likely experienced these symptoms in a persisting manner beyond the acute infectious stage because seroconversion typically occurs 8–14 days after initial symptoms (29). The clinical profile of long COVID has not been fully clarified, but the same symptoms we noted have been identified as prominent complaints in prior studies of prolonged COVID-19 illness, along with fatigue, joint pain, and headache (30,31; C.H. Sudra et al., unpub. data, https://doi.org/10.1101/2020.10.19.20214494).
Our study’s limitations include that we cannot verify how well our sample represents the farmworker population, many of whom are hidden from population statistical measures (32); our findings should be taken to represent persons reached by testing. Because we excluded persons who did not speak Spanish or English well enough to participate in the cross-sectional study, our study likely underrepresents indigenous populations, which are estimated to be 13% of Salinas Valley farmworkers (11). Roughly half of our cross-sectional study participants were enrolled in clinic-based testing, among whom infection prevalence was higher. For this reason, our statistical framework accounted for differences between clinic-based and outreach samples. Last, waning antibody titers from infections acquired early in the pandemic might have contributed to underestimation of seroprevalence, particularly among persons who experienced mild or asymptomatic infection (33).
The recommendation of the Advisory Committee on Immunization Practices prioritized residents of long-term care facilities and healthcare workers for phase 1 vaccination programs (34), but prioritization of differing essential workforce groups among phase 2 recipients will be determined by states. Our study demonstrates high risk for SARS-CoV-2 infection, and both acute and persisting COVID-19 symptoms, among farmworkers in the Salinas Valley. These findings underscore the need to deliver vaccination and other preventive interventions to help reduce further illness among farmworkers and mitigate spread of COVID-19 in the United States.
This article was preprinted at https://doi.org/10.1101/2020.12.27.20248894.
Dr. Lewnard is an assistant professor of epidemiology at the School of Public Health, University of California, Berkeley, and his research interests include infectious disease transmission dynamics and control. Dr. Mora is an assistant researcher at the University of California, Berkeley, and an associate professor at Universidad Nacional, Heredia, Costa Rica. Her research interests include the health effects of exposures to environmental toxicants.
Members of the CHAMACOS-Project-19 study team include Jose Camacho, Gardenia Casillas, Celeste Castro, Cynthia Chang, Lupe Flores, Lizari Garcia, Madison J. de Vere, Maria Reina Garcia, Terry Gomez, Carly Hyland, Daniel Lampert, Aaron McDowell-Sanchez, Dominic Pina Montes, Jacqueline Montoya, Lilibeth Nunez, Juanita “Liz” Orozco, Marbel Orozco, Nargis Rezai, Maria T. Rodriquez, Monica Romero, Hina Sheth, Jon Yoshiyama, and Litzi Zepeda.
Acknowledgment
This study received financial support from the Innovative Genomics Institute at the University of California Berkeley. J.A.L. discloses receipt of grants and fees from Pfizer unrelated to this study. All other authors declare no conflicts of interest.
References
- Lewnard JA, Lo NC. Scientific and ethical basis for social-distancing interventions against COVID-19. Lancet Infect Dis. 2020;20:631–3. DOIPubMedGoogle Scholar
- The President’s Coronavirus Guidelines for America. 30 days to slow the spread. 2020 Mar 16 [cited 2021 Jan 21]. https://trumpwhitehouse.archives.gov/wp-content/uploads/2020/03/03.16.20_coronavirus-guidance_8.5x11_315PM.pdf
- Dyal JW, Grant MP, Broadwater K, Bjork A, Waltenburg MA, Gibbins JD, et al. COVID-19 among workers in meat and poultry processing facilities—19 states, April 2020. MMWR Morb Mortal Wkly Rep. 2020;69:69. DOIPubMedGoogle Scholar
- Steinberg J, Kennedy ED, Basler C, Grant MP, Jacobs JR, Ortbahn D, et al. COVID-19 outbreak among employees at a meat processing facility—South Dakota, March–April 2020. MMWR Morb Mortal Wkly Rep. 2020;69:1015–9. DOIPubMedGoogle Scholar
- Stephenson J. COVID-19 Outbreaks among food production workers may intensify pandemic’s disproportionate effects on people of color. JAMA Heal Forum. 2020 Jun 19 [Epub ahead of print].
- Martin P. Immigration and farm labor: from unauthorized to H-2A for some? Migration Policy Institute. 2017 [cited 2021 Jan 21]. https://www.migrationpolicy.org/research/immigration-and-farm-labor-unauthorized-h-2a-some
- Barham BL, Melo A, Hertz T. Earnings, wages, and poverty outcomes of US farm and low-skill workers. Appl Econ Perspect Policy. 2020;42:307–34. DOIGoogle Scholar
- Kerwin D, Warren RUS. Foreign-born workers in the global pandemic: essential and marginalized. J Migr Hum Secur. 2020;8:282–300. DOIGoogle Scholar
- Becot F, Inwood S, Bendixsen C, Henning-Smith C. Health care and health insurance access for farm families in the United States during COVID-19: essential workers without essential resources? J Agromed. 2020;25:374–7. DOIPubMedGoogle Scholar
- Carlisle-Cummins I. COVID-19 farmworker study (COFS): Historic pandemic worsens vulnerability of essential workers who feed us all. 2020 [cited 2021 Jan 21]. http://covid19farmworkerstudy.org/preliminary-data
- Villarejo D, Wadsworth G. Farmworker housing study and action plan for Salinas Valley and Pajaro Valley, April 2018. California Institute for Rural Studies. 2018 [cited 2021 Jan 21]. https://www.co.monterey.ca.us/home/showdocument?id=63729
- Eskenazi B, Bradman A, Gladstone EA, Jaramillo S, Birch K, Holland N. CHAMACOS, a longitudinal birth cohort study: lessons from the fields. J Child Health. 2003;1:3–27. DOIGoogle Scholar
- Bradman A, Chevrier J, Tager I, Lipsett M, Sedgwick J, Macher J, et al. Association of housing disrepair indicators with cockroach and rodent infestations in a cohort of pregnant Latina women and their children. Environ Health Perspect. 2005;113:1795–801. DOIPubMedGoogle Scholar
- Goldman L, Eskenazi B, Bradman A, Jewell NP. Risk behaviors for pesticide exposure among pregnant women living in farmworker households in Salinas, California. Am J Ind Med. 2004;45:491–9. DOIPubMedGoogle Scholar
- Villarejo D. California’s hired farm workers move to the cities: the outsourcing of responsibility for farm labor housing. Presented at California Rural Legal Assistance Priorities Conference; Asilomar, California; July 16, 2013 [cited 2021 Jan 21]. https://www.crla.org/sites/all/files/u6/2014/rju0214/VillarejoFrmLbrHsngHlth_CRLA_012414.pdf
- Flocks J. The potential impact of COVID-19 on H-2A agricultural workers. J Agromed. 2020;25:367–9. DOIPubMedGoogle Scholar
- Smith E, Zhen W, Manji R, Schron D, Duong S, Berry GJ. Analytical and clinical comparison of three nucleic acid amplification tests for SARS-CoV-2 detection. J Clin Microbiol. 2020;58:e01134–20. DOIPubMedGoogle Scholar
- Skittrall JP, Wilson M, Smielewska AA, Parmar S, Fortune MD, Sparkes D, et al. Specificity and positive predictive value of SARS-CoV-2 nucleic acid amplification testing in a low-prevalence setting. Clin Microbiol Infect. 2020;
S1198-743X(20)30614-5 ; [Epub ahead of print].PubMedGoogle Scholar - Amanat F, Stadlbauer D, Strohmeier S, Nguyen THO, Chromikova V, McMahon M, et al. A serological assay to detect SARS-CoV-2 seroconversion in humans. Nat Med. 2020;26:1033–6. DOIPubMedGoogle Scholar
- Cole SR, Hernán MA. Constructing inverse probability weights for marginal structural models. Am J Epidemiol. 2008;168:656–64. DOIPubMedGoogle Scholar
- Honaker J, King G, Blackwell M. Amelia II: a program for missing data. J Stat Softw. 2011;45:1–47. DOIGoogle Scholar
- Ripley B, Venables W, Ripley MP. Package ‘nnet.’ 2016 [cited 2021 Jan 21]. https://cran.r-project.org/web/packages/nnet/nnet.pdf
- Matthews J. Salinas and Yuma share a common (salad) bowl. San Francisco Chronicle. 2018 Oct 20 [cited 2021 Jan 21]. https://www.sfchronicle.com/opinion/article/Salinas-and-Yuma-share-a-common-salad-bowl-13319515.php
- Moreno E. COVID-19 data, metrics and updates. Monterey County Health Department, Public Health Bureau. 2020 [cited 2021 Jan 21]. https://www.co.monterey.ca.us/home/showdocument?id=96259
- Havers FP, Reed C, Lim T, Montgomery JM, Klena JD, Hall AJ, et al. Seroprevalence of antibodies to SARS-CoV-2 in 10 sites in the United States, March 23–May 12, 2020. JAMA Intern Med. 2020 Jul 21 [Epub ahead of print].
- Chamie G, Marquez C, Crawford E, Peng J, Petersen M, Schwab D, et al.; CLIAhub Consortium. SARS-CoV-2 Community Transmission disproportionately affects Latinx population during Shelter-in-Place in San Francisco. Clin Infect Dis. 2020;
ciaa1234 ; Epub ahead of print. DOIPubMedGoogle Scholar - Buitrago-Garcia D, Egli-Gany D, Counotte MJ, Hossmann S, Imeri H, Ipekci AM, et al. Occurrence and transmission potential of asymptomatic and presymptomatic SARS-CoV-2 infections: A living systematic review and meta-analysis. PLoS Med. 2020;17:
e1003346 . DOIPubMedGoogle Scholar - Advisory for agricultural worker protection during COVID-19 crisis on the Central Coast of California. Monterey County Health Department 2020 [cited 2021 Jan 21]. https://www.co.monterey.ca.us/home/showdocument?id=88063
- Long QX, Liu BZ, Deng HJ, Wu GC, Deng K, Chen YK, et al. Antibody responses to SARS-CoV-2 in patients with COVID-19. Nat Med. 2020;26:845–8. DOIPubMedGoogle Scholar
- Mandal S, Barnett J, Brill SE, Brown JS, Denneny EK, Hare SS, et al.; ARC Study Group. ‘Long-COVID’: a cross-sectional study of persisting symptoms, biomarker and imaging abnormalities following hospitalisation for COVID-19. Thorax. 2020;
thoraxjnl-2020-215818 ; Epub ahead of print. DOIPubMedGoogle Scholar - Carfì A, Bernabei R, Landi F; Gemelli Against COVID-19 Post-Acute Care Study Group. Persistent symptoms in patients after acute COVID-19. JAMA. 2020;324:603–5. DOIPubMedGoogle Scholar
- Bail KM, Foster J, Dalmida SG, Kelly U, Howett M, Ferranti EP, et al. The impact of invisibility on the health of migrant farmworkers in the southeastern United States: a case study from georgia. Nurs Res Pract. 2012;2012:
760418 . DOIPubMedGoogle Scholar - Choe PG, Kang CK, Suh HJ, Jung J, Song KH, Bang JH, et al. Waning antibody responses in asymptomatic and symptomatic SARS-CoV-2 infection. Emerg Infect Dis. 2021;27:327–9. DOIPubMedGoogle Scholar
- Dooling K; ACIP COVID-19 Vaccines Work Group. Phased allocation of COVID-19 vaccines. Presented at the ACIP Meeting 2020 Dec 1 [cited 2021 Jan 21]. https://www.cdc.gov/vaccines/acip/meetings/downloads/slides-2020-12/COVID-02-Dooling.pdf
Figures
Tables
Cite This ArticleOriginal Publication Date: March 03, 2021
1These authors contributed equally to this article.
2Members of the CHAMACOS-Project-19 Study Team are listed at the end of this article.
Table of Contents – Volume 27, Number 5—May 2021
| EID Search Options |
|---|
|
|
|
|
|
|
Please use the form below to submit correspondence to the authors or contact them at the following address:
Joseph A. Lewnard, University of California, Berkeley, 2121 Berkeley Way, Rm 5410, Berkeley, CA 94720, USA
Top