Disability Impacts All of Us Infographic

For Everyone

About

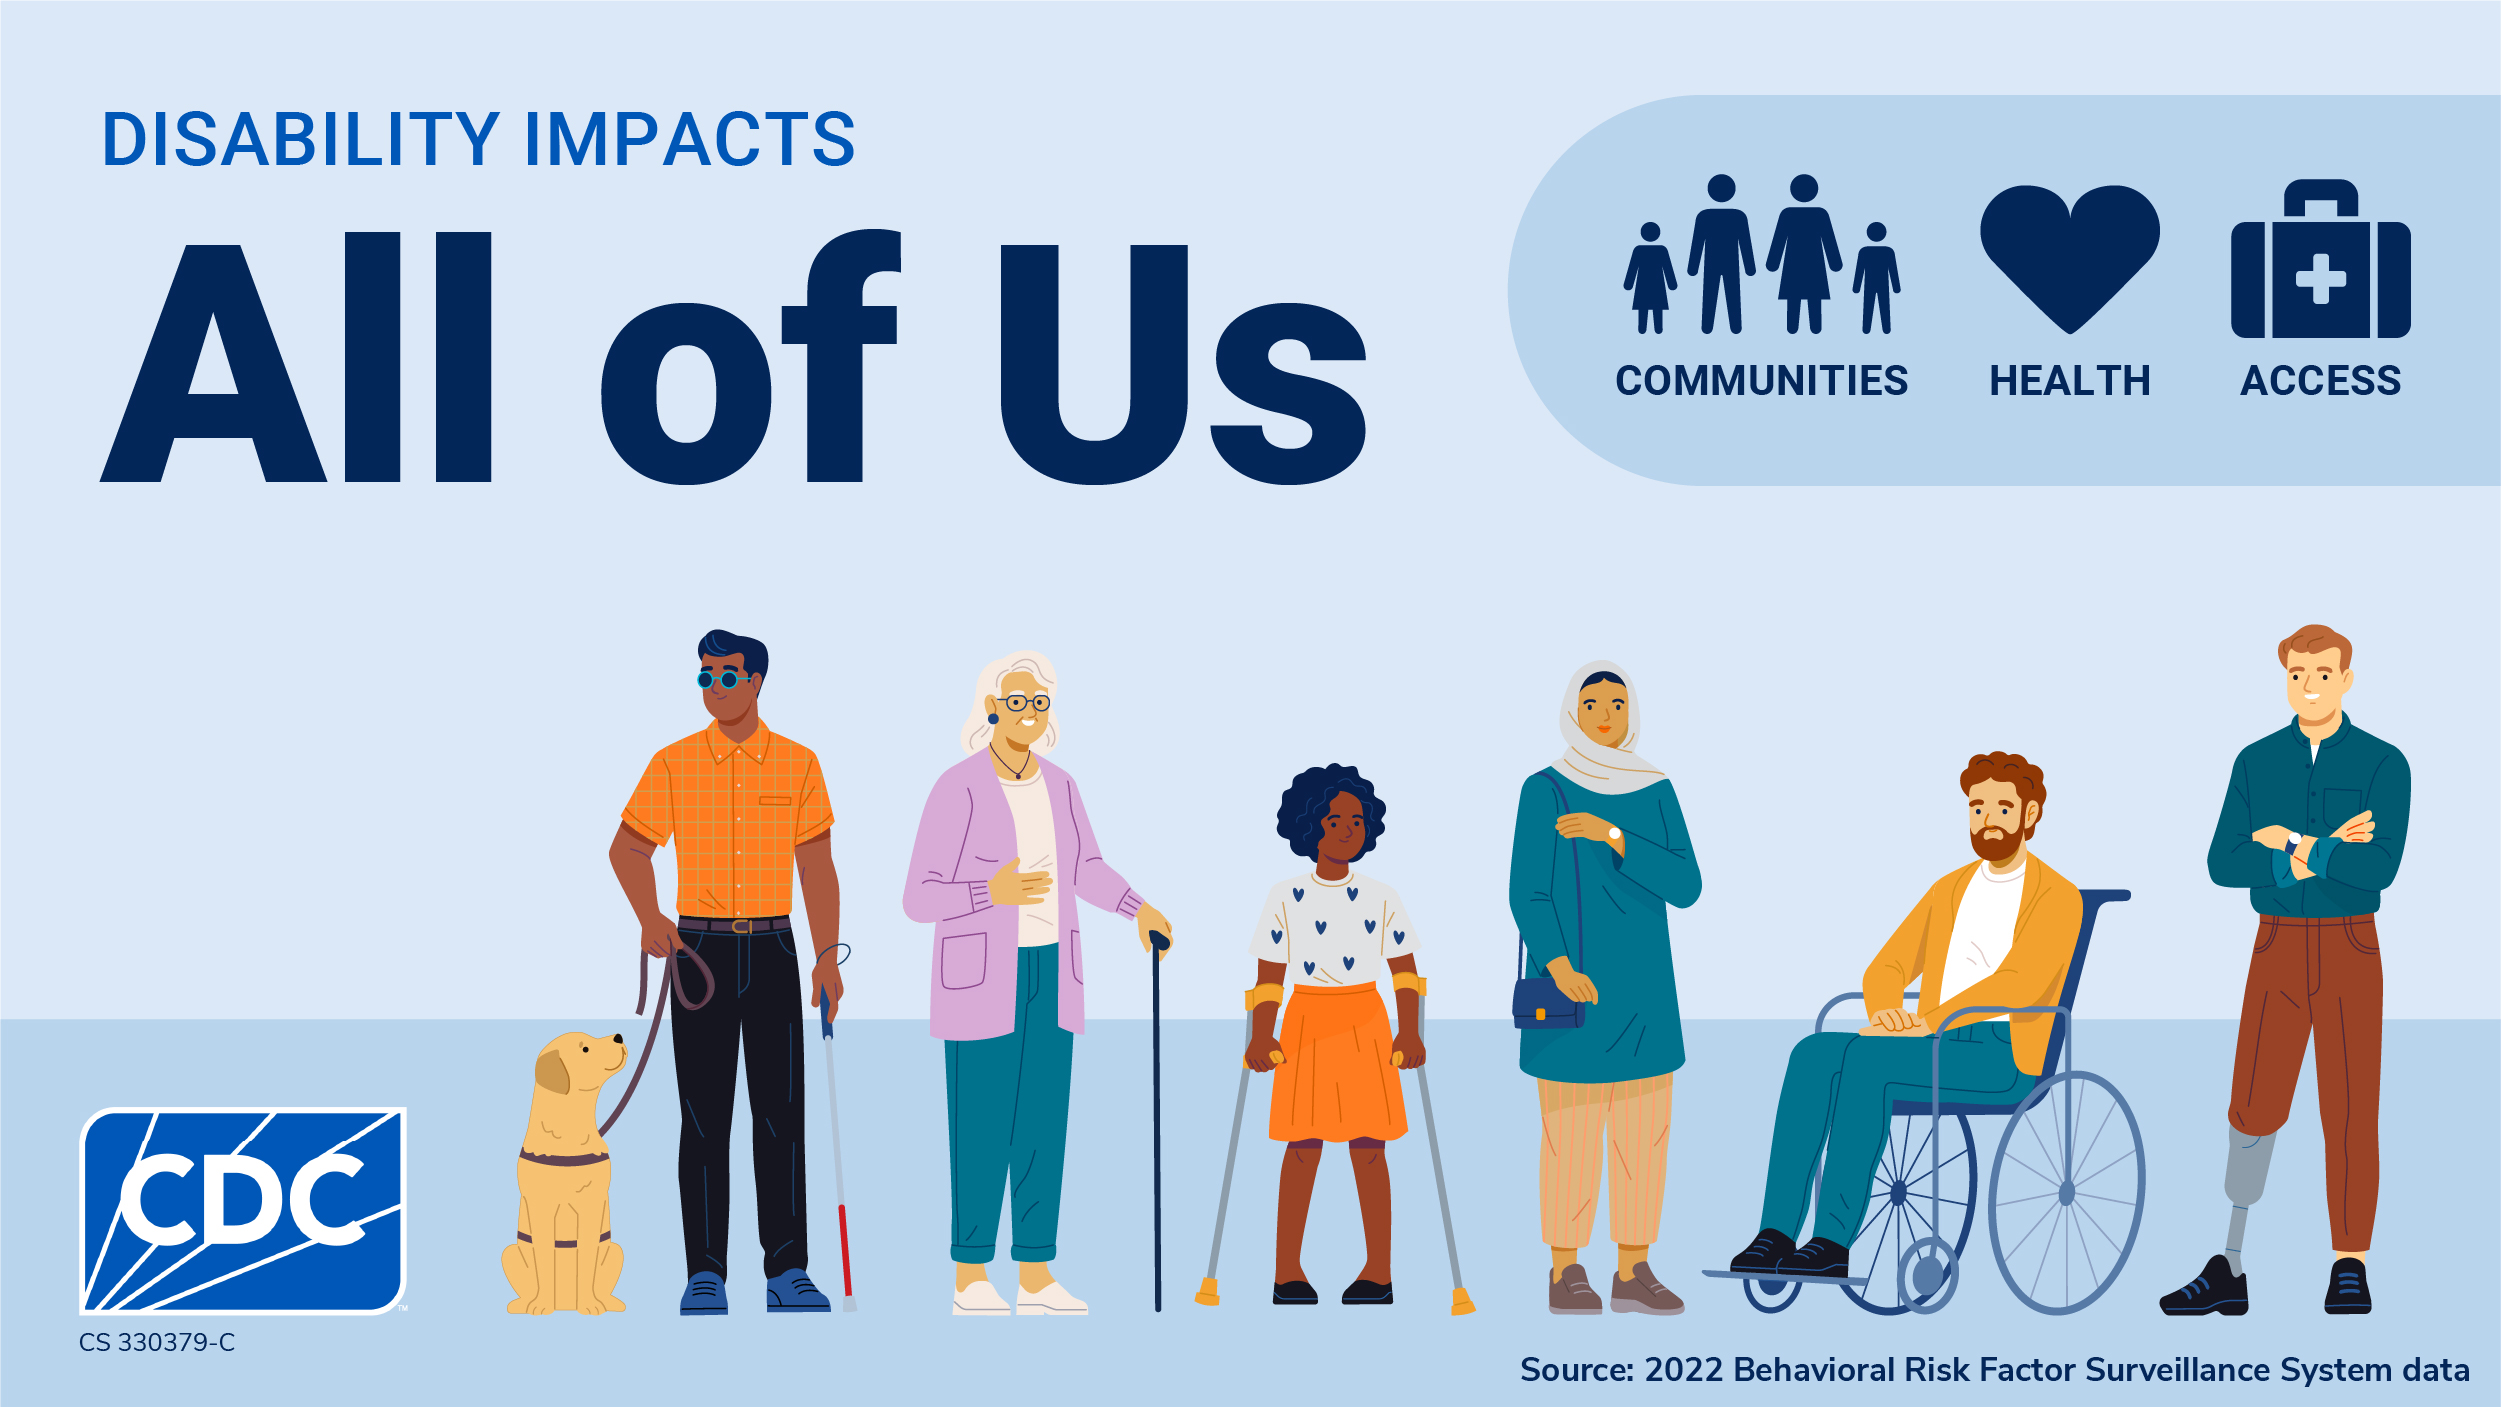
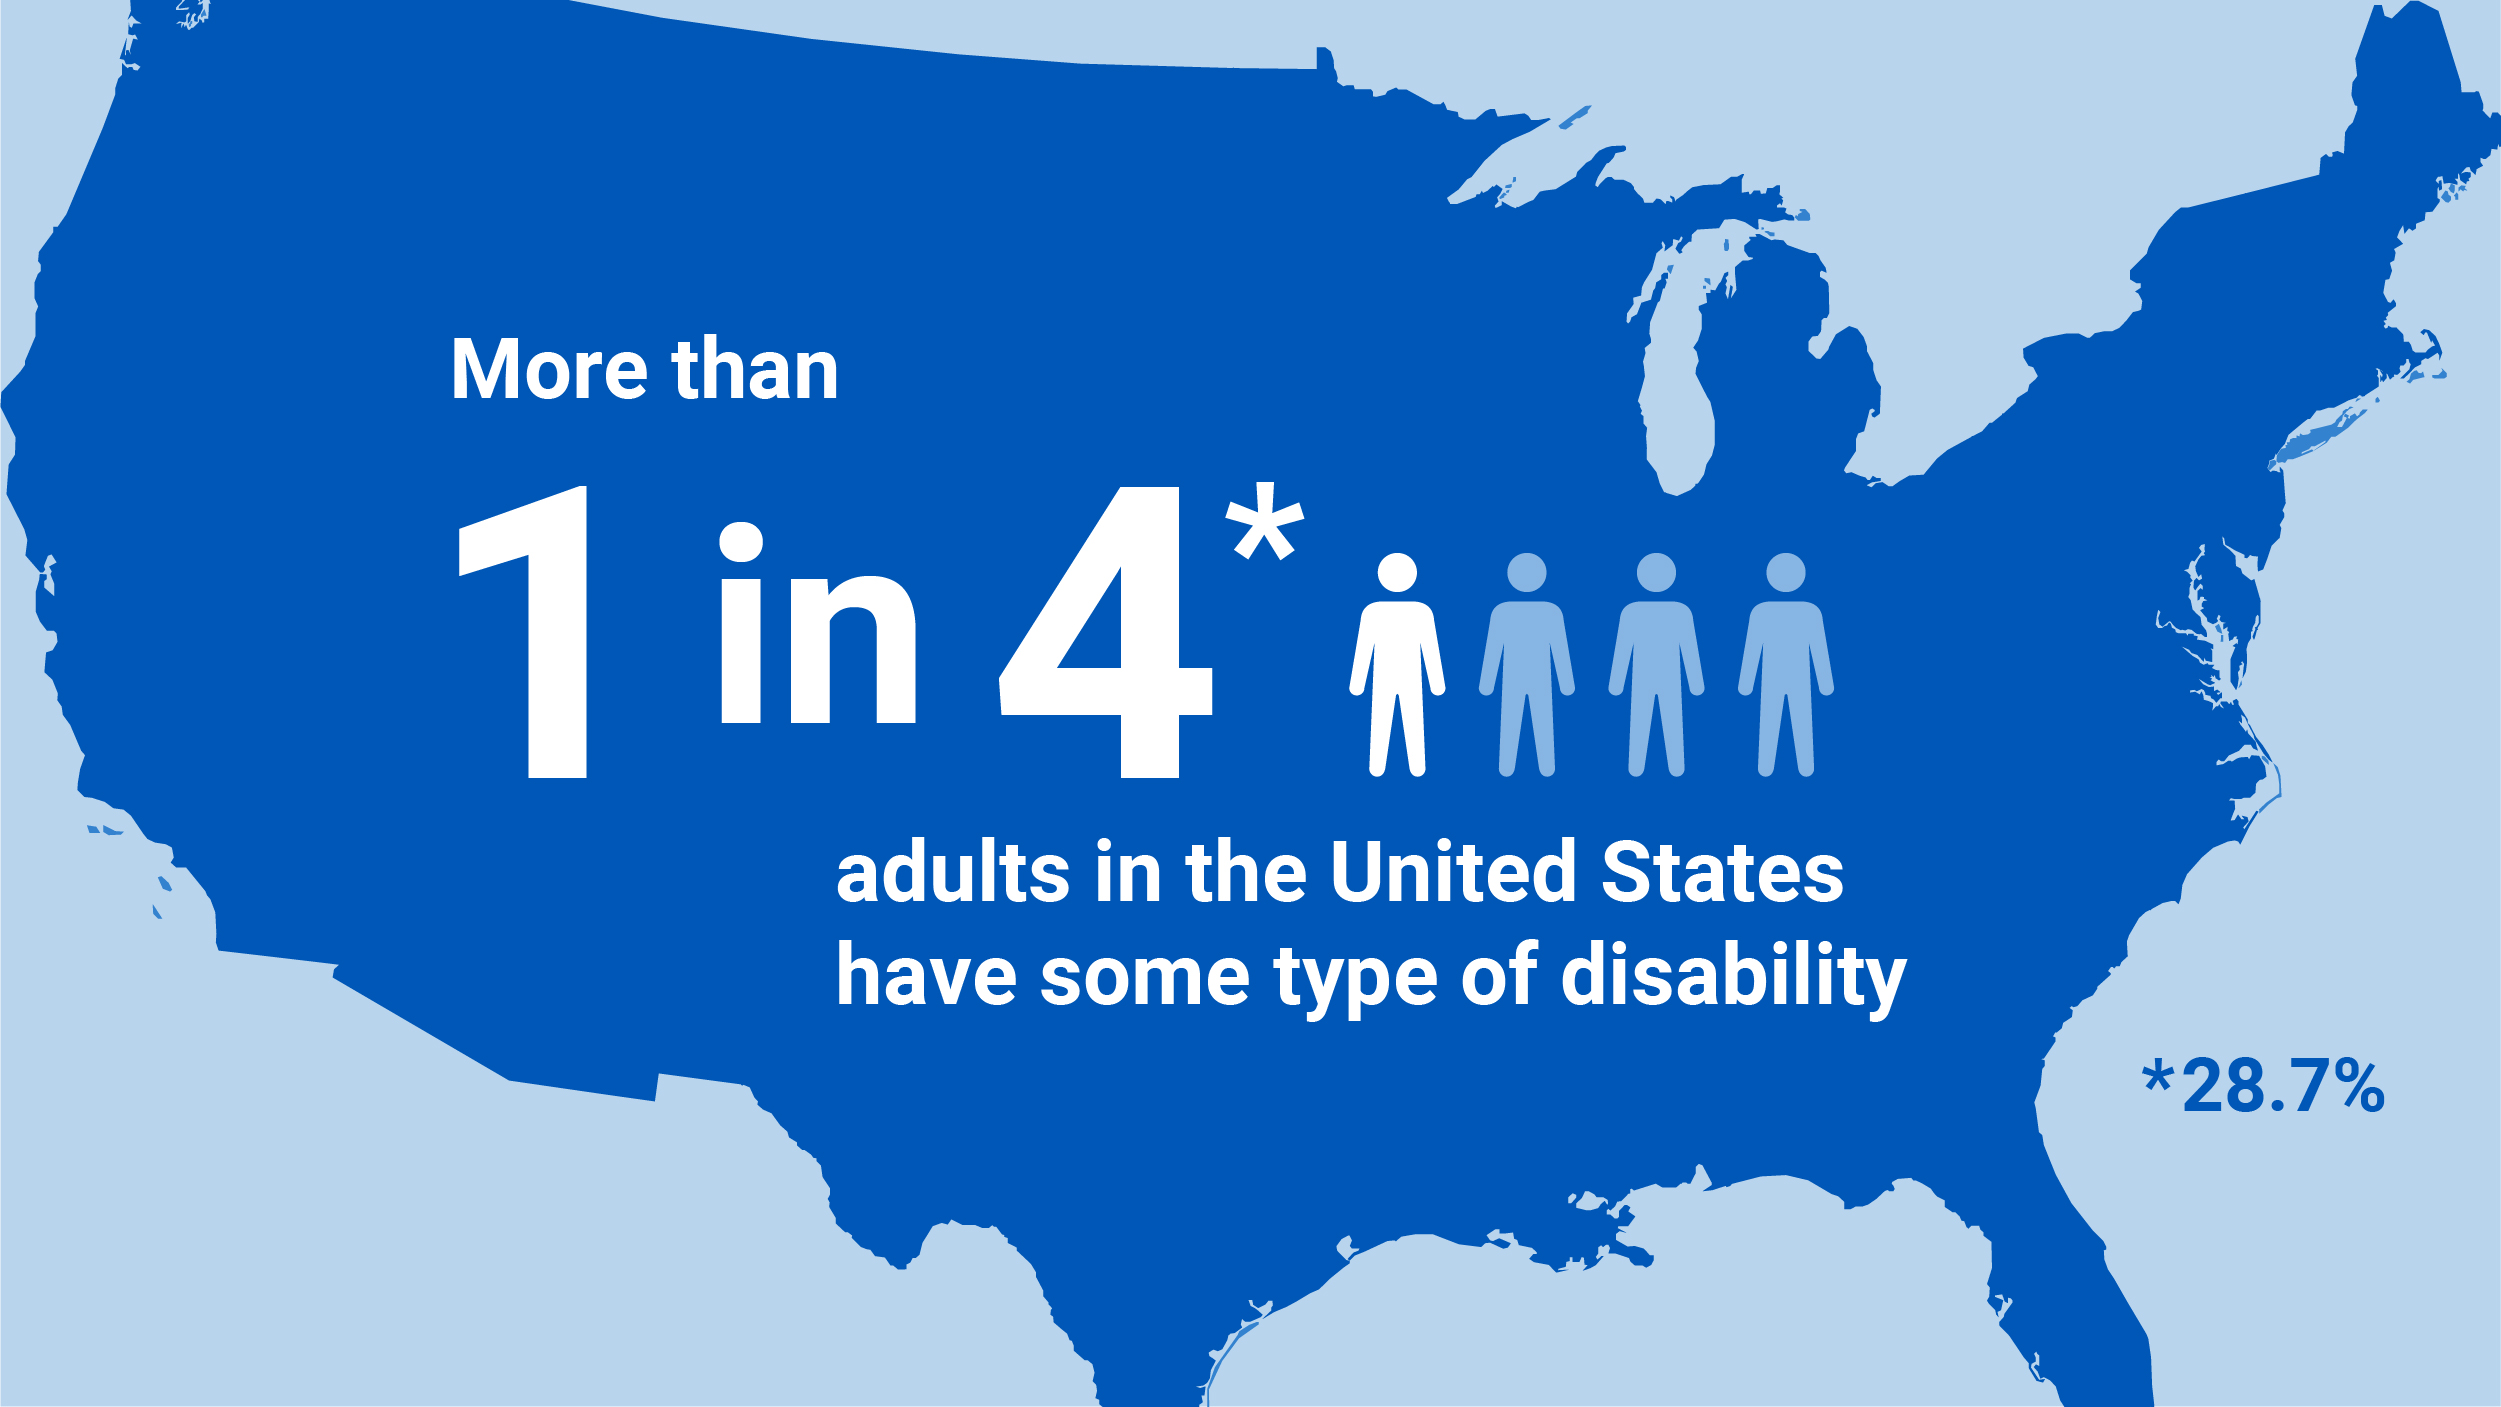
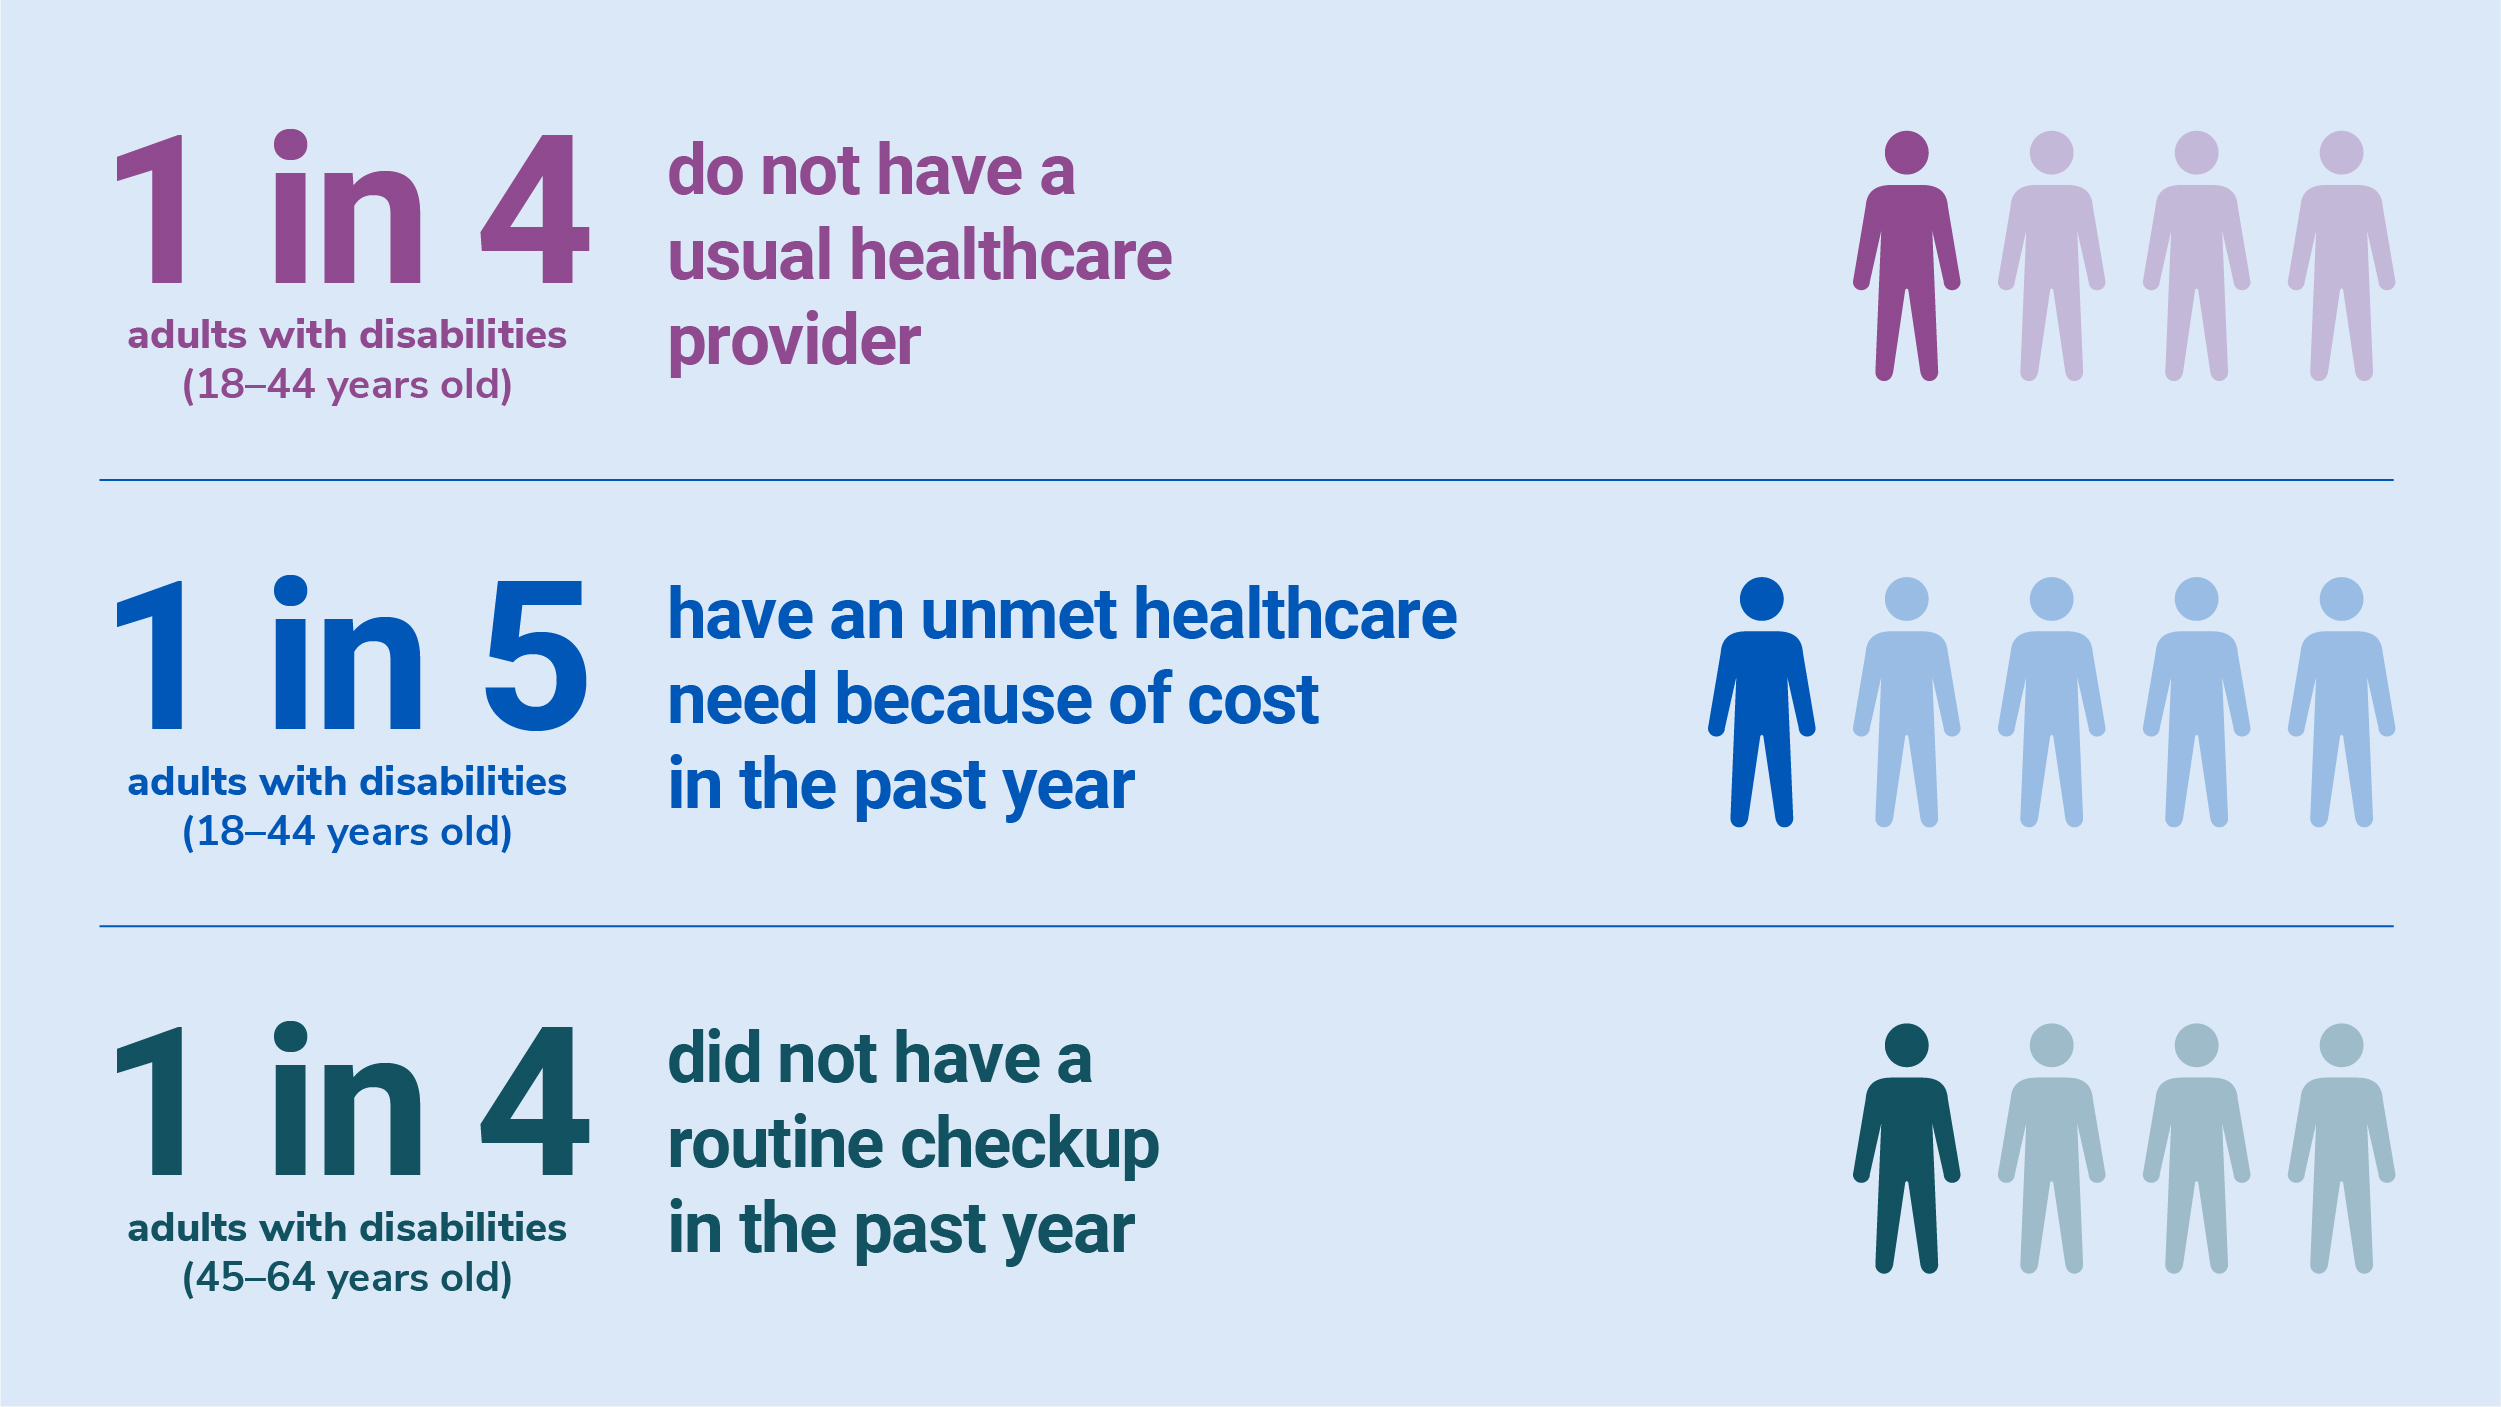
This infographic shows healthcare access barriers for adults with disabilities. It also shows how many adults in the United States have a disability.

Infographic

Graphic shows illustration of people with various disabilities. Title reads, "Disability impacts all of us."
Disability Impacts All of Us
Map of the U.S. with icons showing 1 in 4 people highlighted beside the 1 in 4 statistic.
More than 1 in 4 U.S. adults have some type of disability.
Cognition - 13.9%, mobility - 12.2%, independent living - 7.7%, hearing - 6.2%, vision - 5.5%, self-care - 3.6%.
Most common disabilities include those that affect cognition, mobility, independent living, hearing, vision, and self-care.
Table shows a higher percent of adults with a disability have various conditions, compared to those with no disability.
Adults with a disability are more likely than those with no disablity to smoke or have obesity, diabetes or heart disease.
Graphic shows proportion of adults with disabilties that have an unmet healthcare need, ranging from 1 in 4 to 1 in 5.
Adults with disabilities have limited healthcare access.
Graphic includes people with disabilities. Join CDC and its partners to improve the health of people with disabilities.
CDC is committed to improving the health of people with disabilites.
  • Centers for Disease Control and Prevention. Disability and Health Data System (DHDS) [Internet]. [updated 2024 July; cited 2024 July 15]. Available from: http://dhds.cdc.gov