At a glance

Summary
The U.S. Food and Drug Administration (FDA) authorized the Pfizer-BioNTech COVID-19 vaccine for children aged 16-17 years old on December 11, 2020 and children aged 12–15 years old on May 10, 2021 under Emergency Use Authorization1. On August 23, 2021, Pfizer-BioNTech (COMIRNATY) received full FDA approval for children aged 16–17 years old2. As of September 13, 2021, 54.6% of children aged 12–17 years old had received at least 1 dose of vaccine, based on administration data reported on the CDC COVID Data Tracker website3. The Delta variant is the predominant COVID-19 variant across the country and is more transmissible than previous variants; however, vaccines are still effective against severe illness and may limit the spread of the Delta variant4. Understanding vaccination intent among households with eligible children may inform efforts to increase vaccination coverage in children aged 12–17 years old.
This report describes adult respondents' intent to vaccinate children overall and by sociodemographic characteristics (e.g., sex, race/ethnicity, income, education, receipt of public assistance); examines the associations between the adult respondents' own vaccination status and intent with the vaccination status and intent for their child or children; and examines variations in reasons for not vaccinating children. Data were collected from the U.S. Census Bureau's Household Pulse Survey (HPS) during August 18–August 30, 2021 and September 1–September 13, 2021, which included 19,847 respondents in the analytic sample. The child(ren)'s vaccination status, the respondents' intent to vaccinate the child(ren), and reasons for not vaccinating varied by the adult respondents' race/ethnicity, income, education, number of children in the household, previous COVID-19 diagnosis, and vaccination status [Table].
Table. Sociodemographic characteristics associated with reported receipt of ≥1 dose of COVID-19 vaccine and vaccination intent for children aged 12–17 years old, Household Pulse Survey, August 18–September 13, 2021, United States
| Respondent Characteristics | No. (weighted %) | % (95% CI) | ||||
|---|---|---|---|---|---|---|
| Overall | ≥1 Child received ≥ 1 doses of COVID-19 vaccine | Child(ren) unvaccinated and will definitely get vaccinated | Child(ren) unvaccinated and will probably get or unsure about getting vaccinated | Child(ren) unvaccinated and will probably/ definitely not get vaccinated | ||
| Overall | 19,847 | 63.0(61.8–64.2) | 7.1(6.2–8.1) | 13.2(12.4–14.1) | 16.7(15.8–17.7) | |
| Respondent Vaccine Intent for Self | ||||||
| Received or will definitely get vaccine (referent) | 16,649(79.3) | 76.9 (75.2–78.4) | 8.6(7.5–9.9) | 10.2(9.2–11.3) | 4.3(3.8–4.9) | |
| Probably or unsure if would get vaccinated | 966(7.2) | 16.4(12.6–20.9)* | 3.0(1.3–5.8)* | 61.9(56.7–66.9)* | 18.6(14.1–24.0)* | |
| Probably or definitely would not get vaccinated | 2,207(13.5) | 7.0(5.2–9.2)* | 0.2(0.1–0.5)* | 4.8(3.4–6.6)* | 87.9(85.2–90.3)* | |
| Previously Diagnosed with COVID-19 | ||||||
| Yes (referent) | 3,687(22.2) | 56.2(53.1–59.3) | 6.3(5.1–7.8) | 18.5(16.5–20.7) | 19.0(17.0–21.1) | |
| No | 15,773(77.8) | 65.4(63.9–66.9)* | 7.5(6.4–8.7) | 11.6(10.6–12.7)* | 15.4(14.4–16.5)* | |
| Sex | ||||||
| Male (referent) | 7,009(45.5) | 64.5(62.3–66.7) | 7.6(6.1–9.3) | 11.3(9.7–13.1) | 16.6(15.0–18.2) | |
| Female | 12,838(54.5) | 61.8(60.0–63.5) | 6.7(5.6–7.8) | 14.8(13.5–16.1)* | 16.8(15.6–18.1) | |
| Age | ||||||
| 18–29 years | 866(13.1) | 64.5(59.8–69.0)* | 6.6(4.3–9.5) | 10.9(7.5–15.1)* | 18.0(14.3–22.2)* | |
| 30–39 years (referent) | 3,271(20.4) | 46.5(43.5–49.5) | 8.7(6.6–11.2) | 19.4(16.8–22.2) | 25.4(22.5–28.5) | |
| 40–49 years | 9,105(36.5) | 67.1(65.3–68.9)* | 6.0(4.9–7.2) | 12.0(10.8–13.2)* | 14.9(13.6–16.4)* | |
| ≥50 years | 6,605(30.0) | 68.6(66.1–71.0)* | 7.6(5.9–9.5) | 11.6(10.0–13.3)* | 12.3(10.7–14.1)* | |
| Race/ethnicity† | ||||||
| Hispanic | 2,580(24.0) | 66.7(62.9–70.4)* | 10.5 (7.9-13.6)* |
12.4(10.3–14.7) | 10.4(8.5–12.5)* | |
| Non-Hispanic White only (referent) | 13,342(51.1) | 61.6(60.2–63.1) | 4.1(3.4–4.9) | 13.1(12.0–14.2) | 21.2(19.9–22.6) | |
| Non-Hispanic Black only | 1,875(14.4) | 56.2(51.9–60.4)* | 12.2 (9.3-15.5)* |
18.0(15.0–21.3)* | 13.7(10.7–17.1)* | |
| Non-Hispanic Asian only | 1,183(6.2) | 86.1(80.6–90.4)* | ** | 4.6(3.0–6.8)* | ** | |
| Non-Hispanic Other/multiple races‡ | 867(4.3) | 48.0(41.4–54.6)* | 9.1(5.3–14.3)* | 16.2(11.4–22.0) | 26.7(20.9–33.2) | |
| Highest Level of Education Completed | ||||||
| High school or less (referent) | 2,903(43.2) | 55.6(52.7–58.4) | 10.4(8.6–12.6) | 15.9(14.0–17.9) | 18.1(16.2–20.2) | |
| Some college or college graduate | 12,010(44.5) | 65.4(64.3–66.5)* | 5.1(4.5–5.9)* | 12.4(11.5–13.4)* | 17.1(16.0–18.2) | |
| Above college graduate | 4,934(12.3) | 80.5(78.6-82.3)* | 2.3(1.8–2.9)* | 6.9(6.0–7.9)* | 10.3(8.9–11.8)* | |
| 2019 Total Household Income | ||||||
| <$35,000 (referent) | 2,276(15.9) | 54.6(51.0–58.1) | 9.6(7.3–12.5) | 18.5(15.7–21.5) | 17.3(14.8–20.1) | |
| $35,000–$49,999 | 1,388(8.6) | 57.5(52.4–62.5) | 7.7(5.7–10.2) | 17.5(13.9–21.6) | 17.3(13.3–21.9) | |
| $50,000–$74,999 | 2,184(10.5) | 61.6(57.8–65.2)* | 7.9(5.3–11.2) | 14.4(11.9–17.2)* | 16.1(13.9–18.6) | |
| ≥$75,000 | 9,233(33.0) | 73.4(71.9–74.9)* | 3.1(2.6–3.7)* | 9.4(8.2–10.6)* | 14.1(13.0–15.3)* | |
| Did not report | 4,766(32.1) | 58.4(55.3–61.5) | 9.5(7.6–11.7) | 13.1(11.4–14.9)* | 19.0(17.2–21.0) | |
| Worked for Pay in Last 7 Days | ||||||
| Yes (referent) | 14,229(65.1) | 65.1(63.5–66.6) | 5.8(4.8–7.0) | 11.8(10.6–13.0) | 17.3(16.2–18.4) | |
| No | 5,220(34.9) | 60.8(58.6–63.0)* | 9.3(7.6–11.2)* | 15.6(14.0–17.4)* | 14.2(12.6–16.0)* | |
| Number of Children Living in the Household | ||||||
| 1 child in household (referent) | 7,816(40.3) | 69.1(67.0–71.2) | 6.9(5.6–8.4) | 11.4(10.0–12.9) | 12.6(11.2–14.1) | |
| 2 children in household | 6,984(31.6) | 64.7(62.7–66.6)* | 6.1(4.9–7.5) | 13.6(12.0–15.3) | 15.7(13.9–17.6)* | |
| ≥3 children in household | 5,045(28.1) | 52.3(49.6–55.0)* | 8.5(6.6–10.7) | 15.5(13.7–17.4)* | 23.7(21.8–25.7)* | |
| Students Received Free Meals or Food Assistance from School | ||||||
| Yes (referent) | 8,166(52.0) | 62.3(60.4–64.2) | 8.1(6.5–9.9) | 15.4(13.9–17.0) | 14.2(13.0–15.5) | |
| No | 9,479(48.0) | 65.4(63.7–67.1)* | 5.0(4.2–6.0)* | 11.0(9.5–12.6)* | 18.6(16.9–20.3)* | |
| Received SNAP Benefits | ||||||
| Yes (referent) | 2,219(19.6) | 53.1(49.3–56.8) | 9.5(7.3–12.0) | 19.5(16.9–22.3) | 18.0(15.6–20.6) | |
| No | 15,325(80.4) | 66.5(65.0–67.9)* | 5.9(4.9–7.0)* | 11.8(10.6–13.1)* | 15.8(14.6–17.0) | |
| Uses Public Health Insurance§ | ||||||
| Yes (referent) | 3,838(30.7) | 59.8(56.9–62.7) | 8.0(5.9–10.4) | 16.6(14.7–18.6) | 15.6(14.1–17.3) | |
| No | 11,951(69.3) | 65.8(64.1–67.5)* | 5.9(4.8–7.1) | 11.8(10.5–13.2)* | 16.5(15.2–17.8) | |
| US Census Region | ||||||
| Northeast (referent) | 2,720(17.2) | 69.1(65.1–73.0) | 5.8(3.9–8.3) | 11.8(9.8–14.1) | 13.3(11.1–15.7) | |
| Midwest | 4,006(19.9) | 62.1(58.8–65.4)* | 5.3(3.6–7.4) | 12.0(10.3–13.9) | 20.6(18.0–23.4)* | |
| South | 6,586(39.6) | 57.1(55.0–59.3)* | 9.2(7.6–11.0)* | 16.2(14.5–18.0)* | 17.4(15.8–19.2)* | |
| West | 6,535(23.4) | 69.2(66.3–71.9) | 6.0(4.4–7.9) | 10.3(8.7–12.0) | 14.6(12.6–16.8) | |
Abbreviation: CI = confidence interval; SNAP = Supplemental Nutrition Assistance Program.
* Statistically significant difference from the referent group by contrast test for difference in proportions (p<.05).
†Race is reported by respondent. Persons of Hispanic ethnicity may be of any race.
‡Includes American Indian/Alaska Native, Native Hawaiian, Chamorro, Samoan, or other Pacific Islander, and persons of multiple races. Persons identified as multiple races selected more than 1 of the race categories.
§Public health insurance includes Medicare, Medicaid, any kind of government-assistance plan for those with low incomes or disability, and Veterans Affairs (including those who have ever used or enrolled for VA health care).
**Estimate is considered unreliable based on National Center for Health Statistics guidelines for proportions: www.cdc.gov/nchs/data/series/sr_02/sr02_175.pdf.
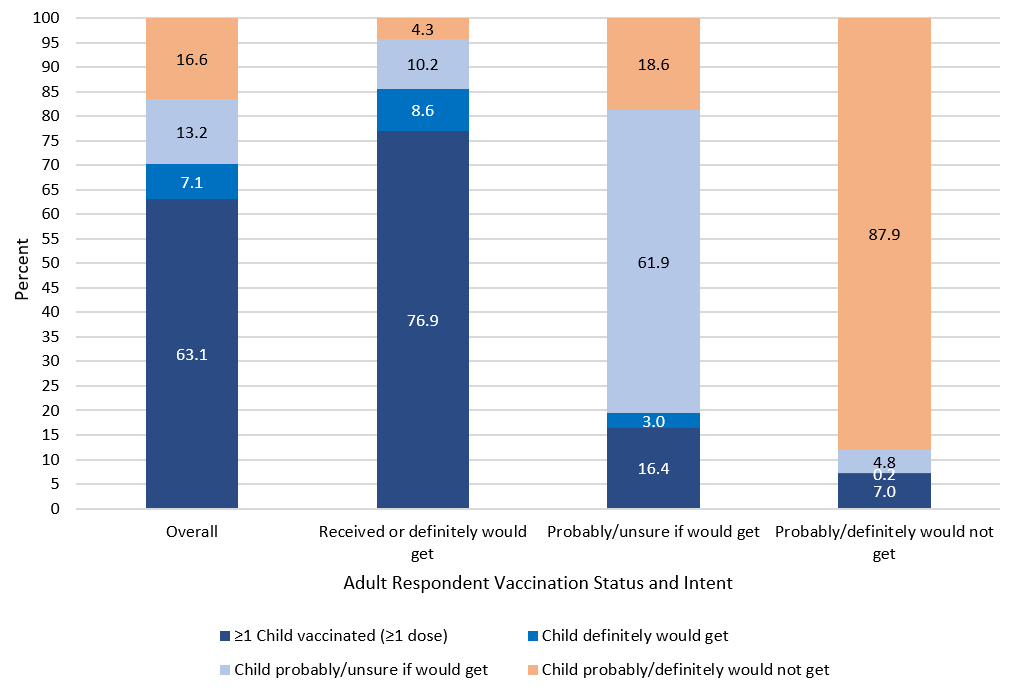
Sixty-three percent of households reported at least 1 child aged 12–17 years old had received at least a single dose of vaccine; an additional 7.1% of households reported they "will definitely get" the children a vaccine. Just over 13% of households reported they would "probably get" or were "unsure about getting" the children vaccinated, and 16.7% of households reported they "probably or definitely would not" get the children vaccinated. Among adult respondents who were vaccinated or definitely plan to get vaccinated, 76.9% of the children were vaccinated; among those who would probably or definitely not get the vaccine, 87.9% would also probably or definitely not vaccinate the children [Table and Figure 1]. The most common reason for not vaccinating children were concerns about safety, which varied by intent. Healthcare professionals, health departments, and community organizations can implement evidence-based strategies to promote vaccine confidence and uptake5.
Figure 1. Receipt of ≥1 dose of COVID-19 vaccine and intent for vaccination of children aged 12–17 years old, by adult respondent’s receipt of vaccine and intent for vaccination, Household Pulse Survey, August 18–September 13, 2021, United States
Methods
Household Pulse Survey (HPS)
The HPS is a nationally representative online survey of almost 70,000 participants conducted by the U.S. Census Bureau every two weeks, in partnership with other Federal agencies, to examine how the COVID-19 pandemic is impacting households across the country. HPS uses the Census Bureau's Master Address File as the source to select a very large sample, sufficient to accommodate lower response rates and still produce estimates at the state level and for 15 metropolitan statistical areas. Additional details about the HPS are available on the Census Bureau website67.
Questions about COVID-19 vaccination status and intent were added to the survey beginning in January 2021. Beginning on July 21, 2021, three more questions were added about COVID-19 vaccinations for household children aged 12–17 years old and reasons for not vaccinating children in the household.
Measures
Adult respondents who reported having children aged 12–17 years old in the household were asked, "Have any of the children aged 12–17 years old living in your household received at least 1 dose of a COVID-19 vaccine?". Respondents who reported that none of the children in the household had received the vaccine were asked if they would "definitely get," "probably get," "be unsure about getting," "probably not get," or "definitely not get" the children a vaccine, or "I do not know the plans for vaccination of the children aged 12-17 years old in my household." Vaccination status and levels of intent for children overall were collapsed into the following 4 categories: respondents with (1) at least 1 child who had received a single dose of COVID-19 vaccine; (2) unvaccinated child(ren), respondent will definitely get at least 1 of the children vaccinated; (3) unvaccinated child(ren), respondent will probably get or is unsure about getting the children vaccinated; and (4) unvaccinated child(ren), respondent will probably not or definitely not get the children vaccinated. Respondents who reported they did not know the plans to vaccinate the children were excluded.
Vaccination intent for the adult respondent was collapsed into 3 categories: (1) respondent had received or will definitely get the vaccine, (2) respondent probably will get or is unsure about getting the vaccine, and (3) respondent probably or definitely will not get the vaccine.
There were 14 reasons for not intending to get a vaccine asked of respondents with unvaccinated children (excluding respondents who reported they would definitely get the children vaccinated). The reasons were categorized into 6 themes: safety concerns, efficacy, mistrust in government and vaccines, believing the vaccine is unnecessary for children, access, and other reasons.
This study included adult respondents' previous COVID-19 diagnosis and sociodemographic characteristics (e.g., sex, race/ethnicity, household income, education, employment [measured as having worked for pay within the last 7 days], receipt of public assistance [i.e., school meal assistance, Supplemental Nutrition Assistance Program {SNAP/food stamps}, and public health insurance], and U.S. Census region). All information about the respondents and the children in the household was self-reported by respondents.
Analysis
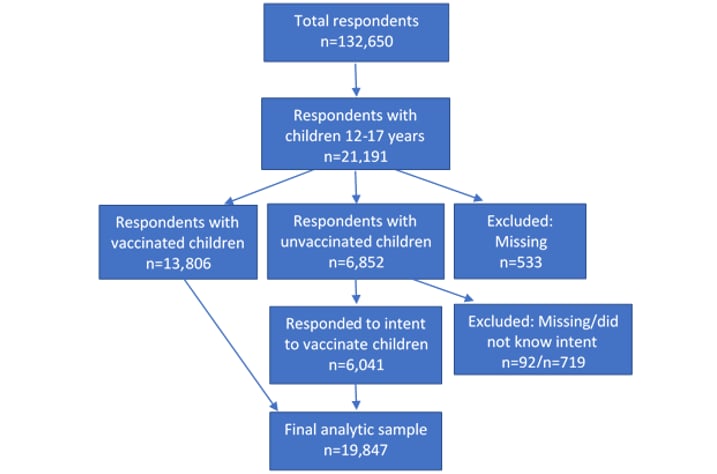
Data for these analyses were collected during two HPS data collection periods referred to as Weeks 36 (August 18–30, 2021) and 37 (September 1–13, 2021). The survey had a total number of 132,650 respondents with response rates of 6.5% and 6.0% during the two data collection periods, respectively6. The analytic sample is based on the 21,191 (16%) respondents with at least 1 child between the ages of 12–17 years old in the household. Among the 6,852 respondents with children who had not been vaccinated, 6,760 responded to the question about vaccination intent. A total of 719 respondents reported they did not know the vaccination plans for children in the household and were excluded. The resulting analytic sample included 19,847 respondents.
Figure 2. Analytic sample, Household Pulse Survey, August 18-September 13, 2021, United States
Unadjusted proportions with 95% confidence intervals (CIs) were estimated using survey design and replicate weights with the balanced repeated replication method in SAS-callable SUDAAN (version 11.0.3, RTI) and SAS version 9.4 (SAS Institute, Inc.). Missing data were excluded on a variable-by-variable basis. All differences reported in the Results section between proportions are statistically significant based on tests for proportions at the p<.05 level.
Results
Intent to get child(ren) vaccinated against COVID-19
From mid-August through mid-September, 63.0% of respondents reported at least 1 child in the household aged 12–17 years old had received at least 1 dose of a COVID-19 vaccine, with an additional 7.1% of adults reporting they would definitely get the children a vaccine, 13.2% would probably get or were unsure about getting it, and 16.7% reported they probably or definitely would not get the children a vaccine [Table and Figure 1, overall].
Intent to vaccinate the children in the household was associated with the adult respondents' vaccination status and intent for themselves [Table and Figure 1]. Among adult respondents who had received a COVID-19 vaccine or definitely plan to, 76.9% reported at least 1 child in the household had received a single dose of COVID-19 vaccine; this percentage was only 7.0% among households in which the adult reported they were unvaccinated and probably or definitely would not get vaccinated. Among adult respondents who were unvaccinated, unsure, or probably would get a vaccine, 61.9% were unsure or probably would get the children vaccinated, compared to 10.2% among the respondents who were vaccinated or definitely plan to get vaccinated. Over 87% of respondents who probably or definitely would not vaccinate themselves would also probably or definitely not vaccinate the children. Figure 1 shows this strong concordance of adult respondent vaccination and intent (x-axis) with intent to vaccinate the children (stacked bars) graphically.
A higher percentage of respondents who had never had a diagnosis of COVID-19 had vaccinated children in the household (65.4%) compared to those with a COVID-19 diagnosis (56.2%) [Table]. Child vaccination intent varied by several sociodemographic characteristics of adult respondents. Respondents ages 30–39 years old were less likely to have the children in the household vaccinated (46.5%) and more likely to probably or definitely not vaccinate the children (25.4%) than other age groups.
Non-Hispanic Asian and Hispanic respondents were more likely to vaccinate the children (86.1%; 66.7%) than non-Hispanic White respondents (61.6%) [Table and Figure 3]. A higher percentage of non-Hispanic White respondents and respondents of other/multiple races reported they would probably or definitely not vaccinate the children (21.2% and 26.7%, respectively) compared to all other racial and ethnic groups. Although non-Hispanic Black respondents were less likely to have vaccinated children than non-Hispanic White respondents (56.2% vs 61.6%), a greater percentage reported that they would definitely get the children vaccinated (12.2%) or would probably get or be unsure about getting the children vaccinated (18.0%), compared to non-Hispanic White respondents (4.1% and 13.1%, respectively). Similarly, non-Hispanic respondents of some other or multiple races were less likely to have vaccinated children (48.0%) but were more likely to report they would definitely get the children vaccinated (9.1%) than non-Hispanic White respondents.
Figure 3. Receipt of ≥ 1 dose of COVID-19 vaccine and intent for vaccination of children aged 12–17 years old, by respondent’s race/ethnicity, Household Pulse Survey, August 18–September 13, 2021, United States
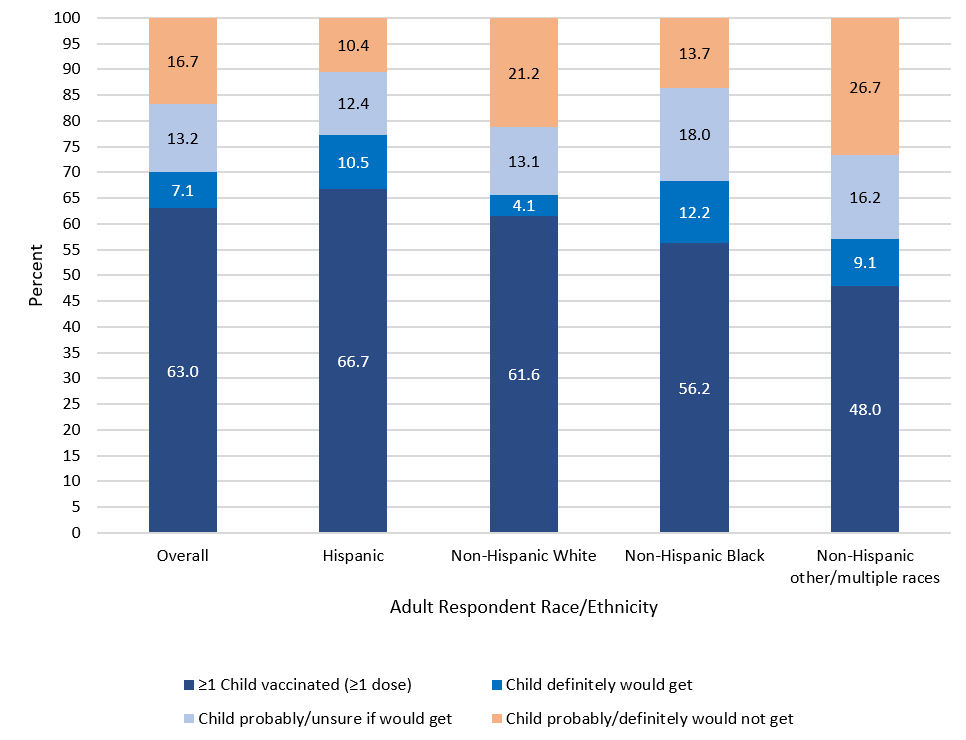
NOTE: Figure excludes bar for Non-Hispanic Asian respondents because estimates for "definitely would get" and "probably/definitely would not get" were considered unreliable based on National Center for Health Statistics guidelines for proportions: www.cdc.gov/nchs/data/series/sr_02/sr02_175.pdf.
Respondents with at least some college education or more; with household income levels of $50,000–$74,999 and ≥$75,000; who were employed; and who had only 1 child living in the household reported a higher percentage of children with at least 1 dose of vaccine in the household than those with a high school education or less, income levels less than $50,000, who were not employed, or had ≥2 children in the household [Table]. Respondents who received public assistance reported a lower percentage of children with at least 1 dose of vaccine in the household than respondents who did not receive these types of assistance. Respondents in the Northeast, Midwest, and West reported a higher percentage of children with at least 1 dose of vaccine in the household than respondents in the South.
Reasons for not intending to get the child vaccinated against COVID-19
The 14 reasons for not vaccinating or not definitely planning to vaccinate the children in the household are displayed in Figure 4. The most common reasons reported were concerns about side effects (62.6%), planning to wait and see if the vaccine(s) were safe (36.3%), don't trust the COVID-19 vaccine (34.9%), and don't trust the government (29.0%).
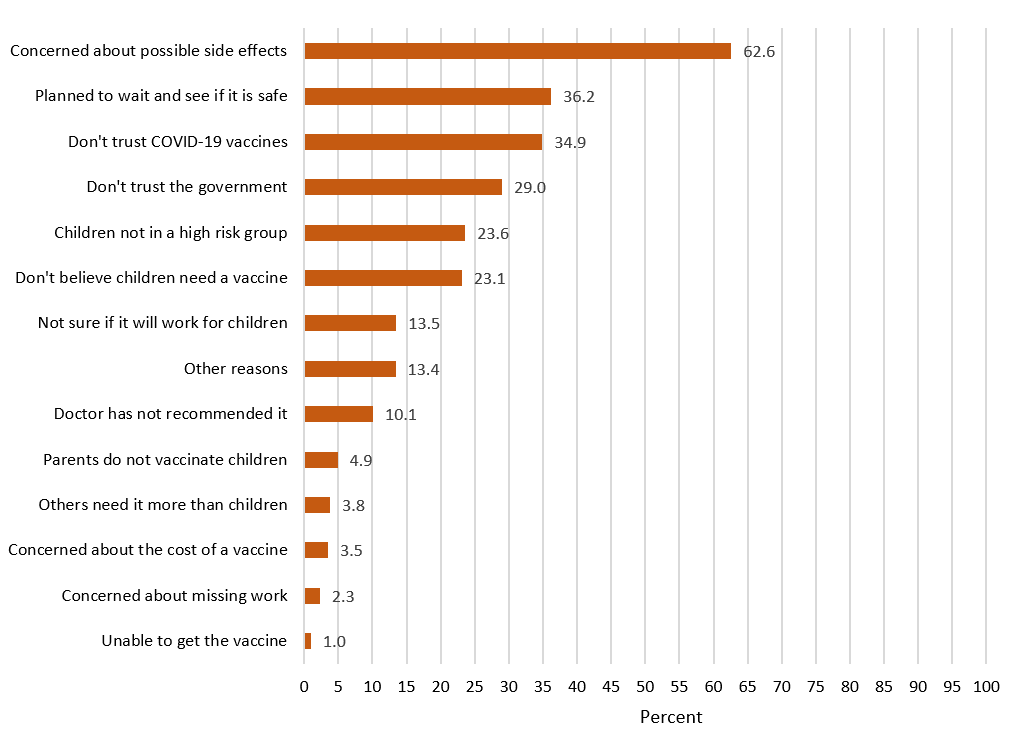
NOTE: n = 5,081.
These 14 reasons were categorized into themes and are displayed in Figure 5 overall and show variation by levels of intent to vaccinate the children. Safety concerns were the most reported reason among respondents who probably would get (80.5%), were unsure about getting (85.6%), or probably would not get (71.3%) the children vaccinated. Mistrust of vaccines and government was the most common reason among respondents who definitely would not get the children vaccinated (71.1%), followed by 41.5% among respondents who would probably not get and 20.5% among respondents who were unsure about getting the children vaccinated. The highest percentage of respondents who believed the vaccine is unnecessary for children was among respondents who definitely would not get the children vaccinated (56.0%), followed by respondents who would probably not get (43.1%) and respondents who were unsure about (22.1%) getting the vaccine for children.
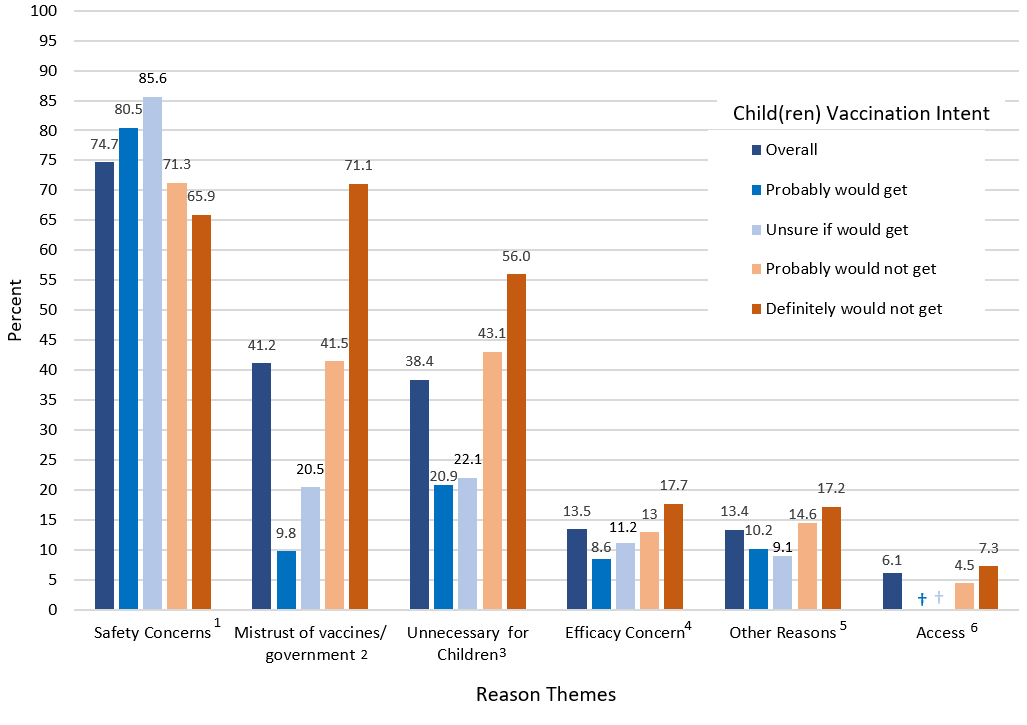
NOTE: n = 5,081.1 Includes "concern about side effects" and "plan to wait and see if it is safe."
2 Includes "do not trust COVID-19 vaccine," "do not trust government," and "parent/guardian do not vaccinate the children."
3 Includes "children are not members of a high- risk group," "don't believe children need the vaccine," "doctor has not recommended it," and "other people need it more."
4 Includes "not sure if it will work for children."
5 Includes "other."
6 Includes "concern about cost," "concern about missing work," and "unable to get it."
† Estimate is considered unreliable based on National Center for Health Statistics guidelines for proportions: www.cdc.gov/nchs/data/series/sr_02/sr02_175.pdf.
Discussion
By mid-September 2021, 63.0% of households with children aged 12–17 years old reported at least 1 child vaccinated with a single dose of a COVID-19 vaccine. About 20% of respondents had not yet vaccinated the children but represent those who may be more likely to vaccinate children than the 17% who would probably or definitely not vaccinate the children. The intent to vaccinate eligible children was strongly associated with the intent to vaccinate self; three quarters of respondents who received or definitely would receive the vaccine also had vaccinated children in the household. This relationship between respondent intent and intent for children and differences by sociodemographic characteristics were similar to patterns found in other recent studies891011. Non-Hispanic Asian and Hispanic respondents had higher percentages of children that received the vaccine and were less likely to probably or definitely not vaccinate the children than non-Hispanic White respondents. Respondents who were non-Hispanic Black had a lower percentage of vaccinated children compared to non-Hispanic White respondents, but a higher percentage reported they would definitely or probably get the children vaccinated, suggesting some barriers to vaccination despite intent. The three most common reasons for not vaccinating children were concerns about safety, mistrust of vaccines and the government, and not believing COVID-19 vaccines are necessary for children. Despite the recent increase in levels of hospitalizations among children 12 and the reporting on low risks of adverse side effects of the COVID-19 vaccines among children13, safety concerns were high among all levels of intent.
Limitations
The findings in this study are subject to at least five limitations. First, the HPS has a low response rate (<10%); the Census Bureau conducted an extensive nonresponse bias assessment and found that although the survey weights might mitigate some of this bias, bias in estimates will remain7. The COVID-19 vaccination coverage estimates among children aged 12–17 years old reported on the CDC COVID Data Tracker website for September 13, 2021 (54.6%) was approximately 10 percentage points lower than the estimated coverage in HPS (63.0%)3. This indicates that the weighted survey sample of respondents with at least 1 child aged 12-17 years old within the household is not representative of all eligible children in the population. Despite overestimation of vaccine coverage, there are similar patterns by sociodemographic characteristics compared to other vaccination data sources14; however, differential bias by levels of demographic variables not fully mitigated by weighting cannot be ruled out. Second, vaccination status of any of the eligible children in the household was provided by the selected adult respondent and is subject to recall and social desirability bias and, further, may not be accurate if the respondent is not the child(ren)'s parent or guardian. Third, responses to the question "would you...get a vaccine" might indicate not only hesitancy but also consideration of likelihood given practical and structural barriers to vaccination. Fourth, HPS does not collect information on socio-behavioral factors beyond reasons for lack of intent that could be used to tailor efforts to improve vaccine confidence. Lastly, because a public-use data set was analyzed, the non-Hispanic other or multiple races group could not be disaggregated to further assess which specific groups were reporting lower coverage or willingness to get vaccinated.
Conclusion
Given the high association between adult respondent and child vaccination intent, efforts to encourage vaccinations among the general population may also impact vaccination among children. Many of the reported reasons for not vaccinating children, particularly safety concerns and whether COVID-19 vaccines are necessary for children, could be addressed by public health education efforts and may impact vaccination coverage. Healthcare professionals, health departments, and community organizations can implement evidence-based strategies to promote vaccine confidence and uptake5.
Disclaimer
Authors
Jessica Penn Lendon, PhD; Tammy A. Santibanez, PhD; James A. Singleton, PhD; James T. Lee, MD
Vaccine Task Force, CDC COVID-19 Response Team; National Center for Health Statistics; Immunization Services Division, National Center for Immunization and Respiratory Diseases; Epidemic Intelligence Service, CDC.
- FDA News Release: Coronavirus (COVID-19) Update: FDA Authorizes Pfizer-BioNTech COVID-19 Vaccine for Emergency Use in Adolescents in Another Important Action in Fight Against Pandemic. 2021 [5/10/2021]; Available from: https://www.fda.gov/news-events/press-announcements/coronavirus-covid-19-update-fda-authorizes-pfizer-biontech-covid-19-vaccine-emergency-use
- FDA News Release: FDA Approves First COVID-19 Vaccine. 2021 [8/23/2021]; Available from: https://www.fda.gov/news-events/press-announcements/fda-approves-first-covid-19-vaccine
- COVID Data Tracker. 2021 [9/22/2021]; Available from: https://covid.cdc.gov/covid-data-tracker/#vaccination-demographics-trends
- Delta Variant. 2021 [updated 8/26/2021]; Available from: www.cdc.gov/coronavirus/2019-ncov/variants/delta-variant.html
- 12 COVID-19 Vaccination Strategies for Your Community. Available from: www.cdc.gov/vaccines/covid-19/vaccinate-with-confidence/community.html
- Census Bureau US. Measuring Household Experiences during the Coronavirus Pandemic. 2021 [updated 10/12/2021]; Available from: https://www.census.gov/data/experimental-data-products/household-pulse-survey.html
- Census Bureau US. Source of the Data and Accuracy of the Estimates for the Household Pulse Survey- Phase 3.2. [9/9/2021]; Available from: https://www2.census.gov/programs-surveys/demo/technical-documentation/hhp/Phase3-2_Source_and_Accuracy_Week%2036.pdf
- Santibanez TA, Singleton JA, Black CL, et al. Sociodemographic Factors Associated with Receipt of COVID-19 Vaccination and Intent to Definitely Get Vaccinated, Adults Aged ≥ 18 Years- Household Pulse Survey, United States, April 28-May 10, 2021. 2021; Available from: www.cdc.gov/vaccines/imz-managers/coverage/adultvaxview/pubs-resources/sociodemographic-factors-covid19-vaccination.html
- Nguyen KH, Nguyen K, Corlin L, et al.Changes in COVID-19 Vaccination Receipt and Intention to Vaccinate by Socioeconomic Characteristics and Geographic Area, United States, January 6 – March 29, 2021. Annals of Medicine. 2021; 53(1):1419-1428.
- Hamel L, Lopes L, Kearney A, et al. KFF COVID-19 Vaccine Monitor: Parents and the Pandemic. 2021; Available from: https://www.kff.org/coronavirus-covid-19/poll-finding/kff-covid-19-vaccine-monitor-parents-and-the-pandemic/
- Beleche T, Kolbe A, Bush L, and Sommers, B. Parents' Intentions to Vaccinate Children Ages 12-17 for COVID-19: Demographic Factors, Geographic Patterns, and Reasons for Hesitancy. Washington, DC: Office of the Assistant Secretary for Planning and Evaluation, U.S. Department of Health and Human Services. 2021; Available from: https://aspe.hhs.gov/reports/hesitancy-vaccinate-children
- Siegel DA, Reses HE, Cool AJ, et al. Trends in COVID-19 Cases, Emergency Department Visits, and Hospital Admissions Among Children and Adolescents Aged 0–17 Years — United States, August 2020–August 2021. MMWR Morb Mortal Wkly Rep 2021; 70:1249–1254. DOI: http://dx.doi.org/10.15585/mmwr.mm7036e1
- Hause AM, Gee J, Baggs J, et al. COVID-19 Vaccine Safety in Adolescents Aged 12–17 Years — United States, December 14, 2020–July 16, 2021. MMWR Morb Mortal Wkly Rep 2021; 70:1053-1058. DOI: http://dx.doi.org/10.15585/mmwr.mm7031e1
- Comparison of COVID-19 vaccination coverage estimates from the Household Pulse Survey, Omnibus Panel Surveys, and COVID-19 vaccine administration data, United States, March 2021. 2021; Available from: www.cdc.gov/vaccines/imz-managers/coverage/adultvaxview/pubs-resources/covid19-coverage-estimates-comparison.html.
